Financial Kpis
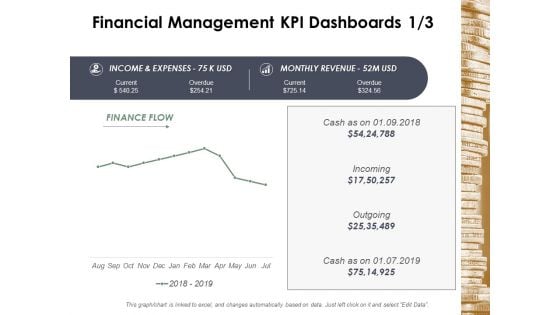
Financial Management Kpi Dashboards Business Ppt Powerpoint Presentation Infographic Template Deck
This is a financial management kpi dashboards business ppt powerpoint presentation infographic template deck. This is a four stage process. The stages in this process are finance, marketing, management, investment, analysis.
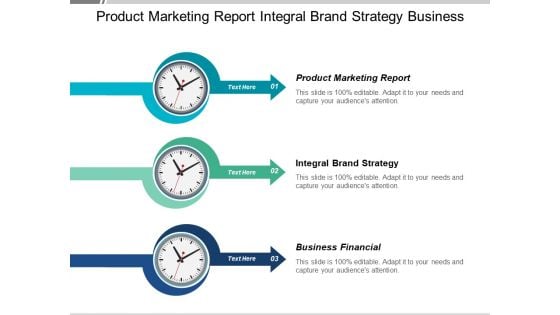
Product Marketing Report Integral Brand Strategy Business Financial Ppt PowerPoint Presentation Inspiration Backgrounds
This is a product marketing report integral brand strategy business financial ppt powerpoint presentation inspiration backgrounds. This is a three stage process. The stages in this process are product marketing report, integral brand strategy, business financial.
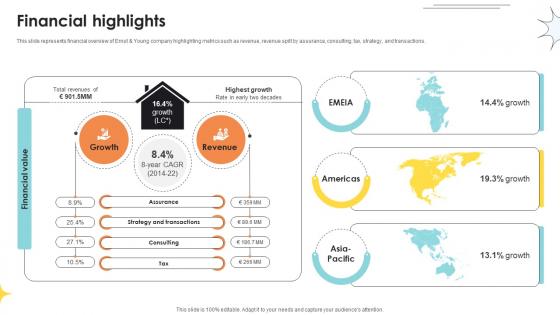
Financial Highlights Professional Services And Tax Advisory Company Profile CP SS V
This slide represents financial overview of Ernst and Young company highlighting metrics such as revenue, revenue spilt by assurance, consulting, tax, strategy, and transactions.Present like a pro with Financial Highlights Professional Services And Tax Advisory Company Profile CP SS V. Create beautiful presentations together with your team, using our easy-to-use presentation slides. Share your ideas in real-time and make changes on the fly by downloading our templates. So whether you are in the office, on the go, or in a remote location, you can stay in sync with your team and present your ideas with confidence. With Slidegeeks presentation got a whole lot easier. Grab these presentations today. This slide represents financial overview of Ernst and Young company highlighting metrics such as revenue, revenue spilt by assurance, consulting, tax, strategy, and transactions.
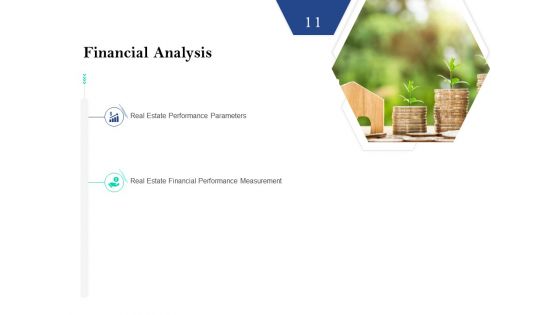
Property Investment Strategies Financial Analysis Slide Ppt PowerPoint Presentation Model Summary PDF
Presenting property investment strategies financial analysis slide ppt powerpoint presentation model summary pdf. to provide visual cues and insights. Share and navigate important information on two stages that need your due attention. This template can be used to pitch topics like real estate performance parameters, real estate financial performance measurement . In addtion, this PPT design contains high resolution images, graphics, etc, that are easily editable and available for immediate download.
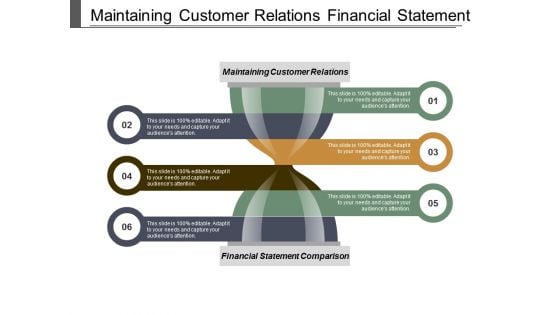
Maintaining Customer Relations Financial Statement Comparison Productivity Metrics Ppt PowerPoint Presentation Infographics Graphic Images
This is a maintaining customer relations financial statement comparison productivity metrics ppt powerpoint presentation infographics graphic images. This is a six stage process. The stages in this process are maintaining customer relations, financial statement comparison, productivity metrics.
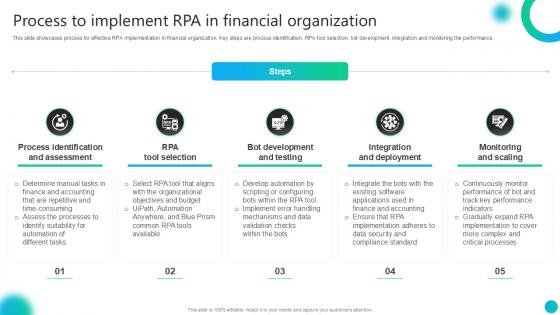
Process To Implement RPA In Financial Organization PPT Presentation AI SS V
This slide showcases process for effective RPA implementation in financial organization. Key steps are process identification, RPA tool selection, bot development, integration and monitoring the performance. This Process To Implement RPA In Financial Organization PPT Presentation AI SS V is perfect for any presentation, be it in front of clients or colleagues. It is a versatile and stylish solution for organizing your meetings. The Process To Implement RPA In Financial Organization PPT Presentation AI SS V features a modern design for your presentation meetings. The adjustable and customizable slides provide unlimited possibilities for acing up your presentation. Slidegeeks has done all the homework before launching the product for you. So, do not wait, grab the presentation templates today This slide showcases process for effective RPA implementation in financial organization. Key steps are process identification, RPA tool selection, bot development, integration and monitoring the performance.
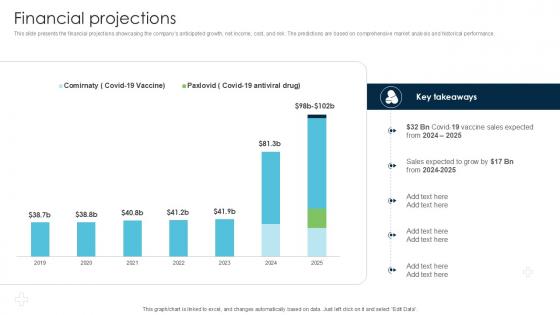
Financial Projections Strategies Driving Business Triumph Through Pfizer PPT Slide BMC SS V
This slide presents the financial projections showcasing the companys anticipated growth, net income, cost, and risk. The predictions are based on comprehensive market analysis and historical performance. This Financial Projections Strategies Driving Business Triumph Through Pfizer PPT Slide BMC SS V is perfect for any presentation, be it in front of clients or colleagues. It is a versatile and stylish solution for organizing your meetings. The Financial Projections Strategies Driving Business Triumph Through Pfizer PPT Slide BMC SS V features a modern design for your presentation meetings. The adjustable and customizable slides provide unlimited possibilities for acing up your presentation. Slidegeeks has done all the homework before launching the product for you. So, do not wait, grab the presentation templates today This slide presents the financial projections showcasing the companys anticipated growth, net income, cost, and risk. The predictions are based on comprehensive market analysis and historical performance.
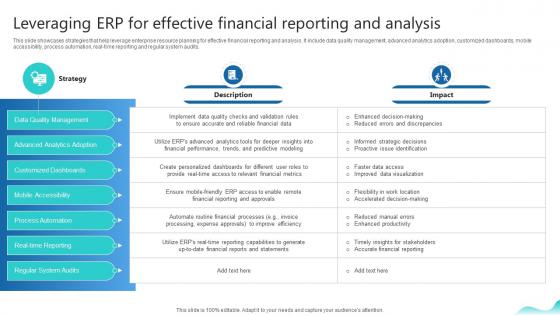
Leveraging Erp For Effective Financial Reporting Erp And Digital Transformation For Maximizing DT SS V
This slide showcases strategies that help leverage enterprise resource planning for effective financial reporting and analysis. It include data quality management, advanced analytics adoption, customized dashboards, mobile accessibility, process automation, real-time reporting and regular system audits.Make sure to capture your audiences attention in your business displays with our gratis customizable Leveraging Erp For Effective Financial Reporting Erp And Digital Transformation For Maximizing DT SS V. These are great for business strategies, office conferences, capital raising or task suggestions. If you desire to acquire more customers for your tech business and ensure they stay satisfied, create your own sales presentation with these plain slides. This slide showcases strategies that help leverage enterprise resource planning for effective financial reporting and analysis. It include data quality management, advanced analytics adoption, customized dashboards, mobile accessibility, process automation, real-time reporting and regular system audits.
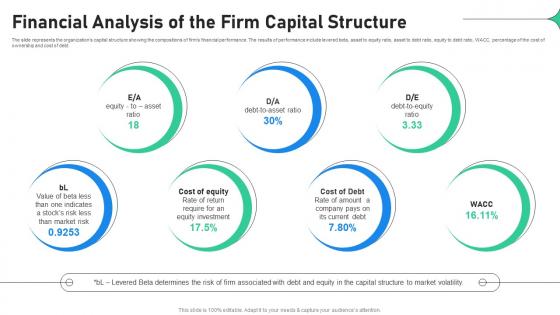
Financial Analysis Of The Firm Capital Increasing Profitability Through Better Product
The slide represents the organizations capital structure showing the compositions of firms financial performance. The results of performance include levered beta, asset to equity ratio, asset to debt ratio, equity to debt ratio, WACC, percentage of the cost of ownership and cost of debt. If your project calls for a presentation, then Slidegeeks is your go-to partner because we have professionally designed, easy-to-edit templates that are perfect for any presentation. After downloading, you can easily edit Financial Analysis Of The Firm Capital Increasing Profitability Through Better Product and make the changes accordingly. You can rearrange slides or fill them with different images. Check out all the handy templates The slide represents the organizations capital structure showing the compositions of firms financial performance. The results of performance include levered beta, asset to equity ratio, asset to debt ratio, equity to debt ratio, WACC, percentage of the cost of ownership and cost of debt.
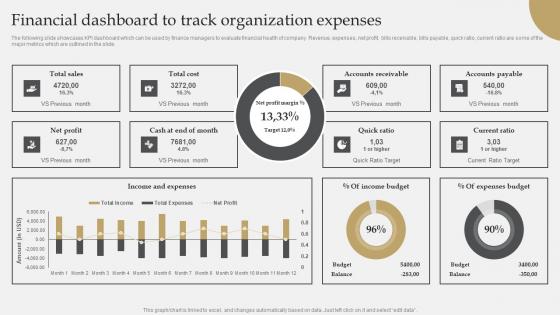
IT Industry Market Research Financial Dashboard To Track Organization Expenses Introduction Pdf
The following slide showcases KPI dashboard which can be used by finance managers to evaluate financial health of company. Revenue, expenses, net profit, bills receivable, bills payable, quick ratio, current ratio are some of the major metrics which are outlined in the slide. Present like a pro with IT Industry Market Research Financial Dashboard To Track Organization Expenses Introduction Pdf Create beautiful presentations together with your team, using our easy-to-use presentation slides. Share your ideas in real-time and make changes on the fly by downloading our templates. So whether you are in the office, on the go, or in a remote location, you can stay in sync with your team and present your ideas with confidence. With Slidegeeks presentation got a whole lot easier. Grab these presentations today. The following slide showcases KPI dashboard which can be used by finance managers to evaluate financial health of company. Revenue, expenses, net profit, bills receivable, bills payable, quick ratio, current ratio are some of the major metrics which are outlined in the slide.
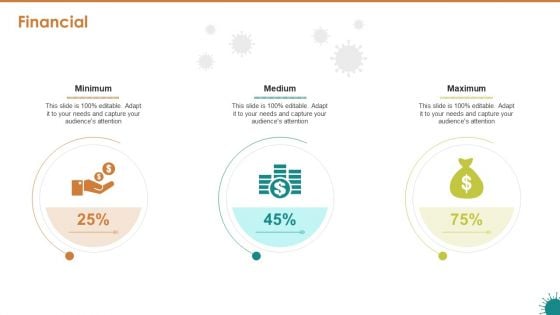
Covid 19 Risk Mitigation Measures On Live Sports Financial Brochure PDF
Presenting covid 19 risk mitigation measures on live sports financial brochure pdf to provide visual cues and insights. Share and navigate important information on three stages that need your due attention. This template can be used to pitch topics like minimum, medium, maximum. In addition, this PPT design contains high-resolution images, graphics, etc, that are easily editable and available for immediate download.
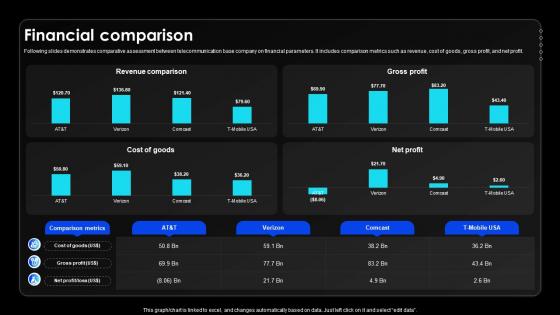
Financial Comparison Wireless Communication Services Provider Company Profile CP SS V
Following slides demonstrates comparative assessment between telecommunication base company on financial parameters. It includes comparison metrics such as revenue, cost of goods, gross profit, and net profit.If your project calls for a presentation, then Slidegeeks is your go-to partner because we have professionally designed, easy-to-edit templates that are perfect for any presentation. After downloading, you can easily edit Financial Comparison Wireless Communication Services Provider Company Profile CP SS V and make the changes accordingly. You can rearrange slides or fill them with different images. Check out all the handy templates Following slides demonstrates comparative assessment between telecommunication base company on financial parameters. It includes comparison metrics such as revenue, cost of goods, gross profit, and net profit.
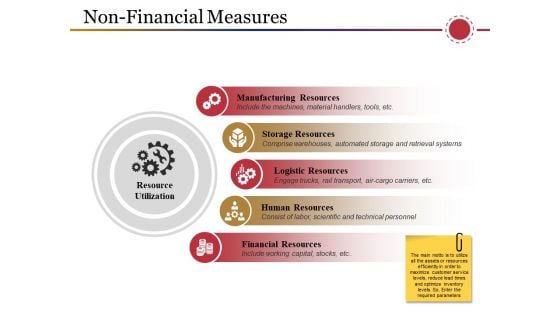
Non Financial Measures Template 3 Ppt PowerPoint Presentation Styles Design Ideas
This is a non financial measures template 3 ppt powerpoint presentation styles design ideas. This is a five stage process. The stages in this process are manufacturing resources, storage resources, logistic resources, human resources, financial resources.
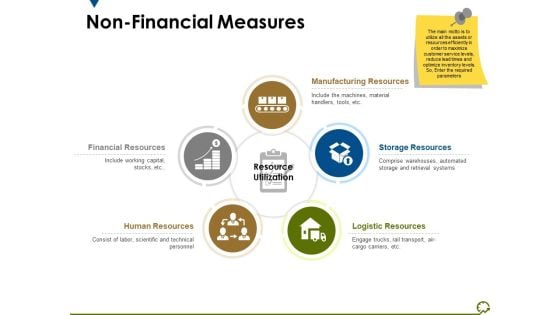
Non Financial Measures Template 3 Ppt PowerPoint Presentation Professional Graphic Images
This is a non financial measures template 3 ppt powerpoint presentation professional graphic images. This is a five stage process. The stages in this process are manufacturing resources, financial resources, human resources, logistic resources, storage resources.
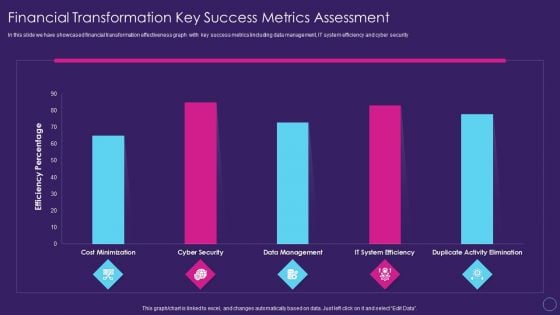
Financial Transformation Key Success Metrics Assessment Digital Transformation Toolkit Accounting Finance Introduction PDF
In this slide we have showcased financial transformation effectiveness graph with key success metrics lincluding data management, IT system efficiency and cyber security Deliver an awe inspiring pitch with this creative financial transformation key success metrics assessment digital transformation toolkit accounting finance introduction pdf bundle. Topics like financial transformation key success metrics assessment can be discussed with this completely editable template. It is available for immediate download depending on the needs and requirements of the user.
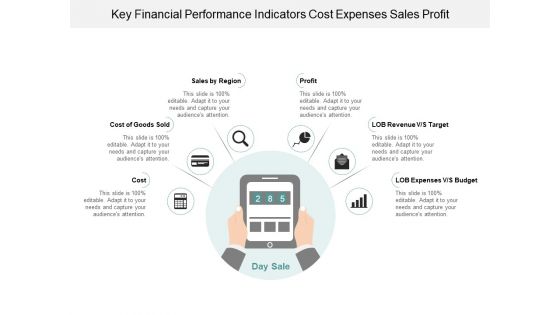
Key Financial Performance Indicators Cost Expenses Sales Profit Ppt Powerpoint Presentation Infographic Template Graphic Images
This is a key financial performance indicators cost expenses sales profit ppt powerpoint presentation infographic template graphic images. This is a six stage process. The stages in this process are dashboard, kpi, metrics.
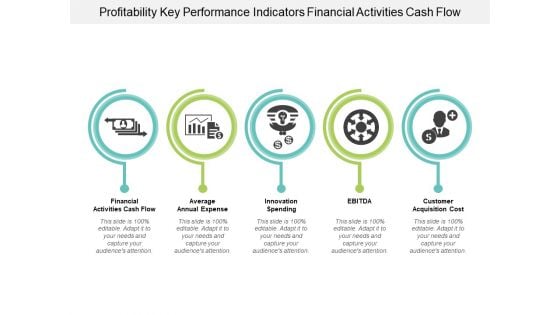
Profitability Key Performance Indicators Financial Activities Cash Flow Ppt Powerpoint Presentation Portfolio Clipart Images
This is a profitability key performance indicators financial activities cash flow ppt powerpoint presentation portfolio clipart images. This is a five stage process. The stages in this process are dashboard, kpi, metrics.
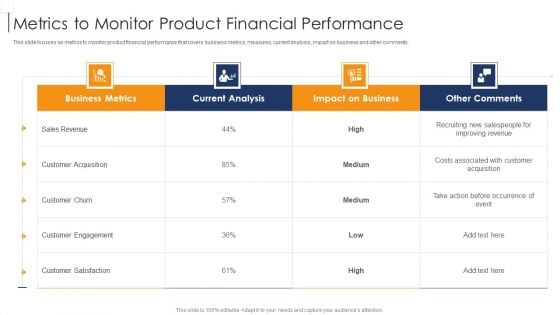
Product Lifecycle Management IT Metrics To Monitor Product Financial Performance Topics PDF
This slide focuses on metrics to monitor product financial performance that covers business metrics, measures, current analysis, impact on business and other comments. Deliver and pitch your topic in the best possible manner with this product lifecycle management it metrics to monitor product financial performance topics pdf. Use them to share invaluable insights on metrics to monitor product financial performance and impress your audience. This template can be altered and modified as per your expectations. So, grab it now.

Strategic Financial Planning And Administration Ppt Powerpoint Presentation Complete Deck With Slides
This is another content ready PowerPoint Template to help you assess your business progress. This Strategic Financial Planning And Administration Ppt Powerpoint Presentation Complete Deck With Slides comprises visuals to evaluate key metrices you may wish to track. You can incorporate this ready made PowerPoint Diagram to view the performing and non performing areas of your business domain. In sixty nine slides,this complete deck is also a design marvel with its well researched color theme. The presentation template is also equipped to do this with its 100 percent editable and customizable capability. Download now. Our Strategic Financial Planning And Administration Ppt Powerpoint Presentation Complete Deck With Slides are topically designed to provide an attractive backdrop to any subject. Use them to look like a presentation pro.
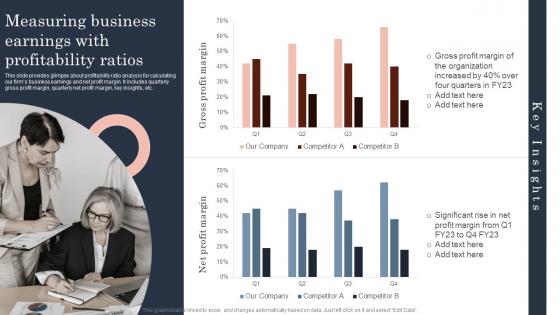
Measuring Business Earnings With Guide To Corporate Financial Growth Plan Background Pdf
This slide provides glimpse about profitability ratio analysis for calculating our firms business earnings and net profit margin. It includes quarterly gross profit margin, quarterly net profit margin, key insights, etc.Here you can discover an assortment of the finest PowerPoint and Google Slides templates. With these templates, you can create presentations for a variety of purposes while simultaneously providing your audience with an eye-catching visual experience. Download Measuring Business Earnings With Guide To Corporate Financial Growth Plan Background Pdf to deliver an impeccable presentation. These templates will make your job of preparing presentations much quicker, yet still, maintain a high level of quality. Slidegeeks has experienced researchers who prepare these templates and write high-quality content for you. Later on, you can personalize the content by editing the Measuring Business Earnings With Guide To Corporate Financial Growth Plan Background Pdf. This slide provides glimpse about profitability ratio analysis for calculating our firms business earnings and net profit margin. It includes quarterly gross profit margin, quarterly net profit margin, key insights, etc.

Budgeting Risk Management For Financial Effective And Efficient Tools To Develop Fin SS V
This slide shows various measures which can be used by individuals or budget managers to manage financial risk that may affect budget. It includes methods such as cash flow management, debt management, interest hedging, etc. Want to ace your presentation in front of a live audience Our Budgeting Risk Management For Financial Effective And Efficient Tools To Develop Fin SS V can help you do that by engaging all the users towards you. Slidegeeks experts have put their efforts and expertise into creating these impeccable powerpoint presentations so that you can communicate your ideas clearly. Moreover, all the templates are customizable, and easy-to-edit and downloadable. Use these for both personal and commercial use. This slide shows various measures which can be used by individuals or budget managers to manage financial risk that may affect budget. It includes methods such as cash flow management, debt management, interest hedging, etc.
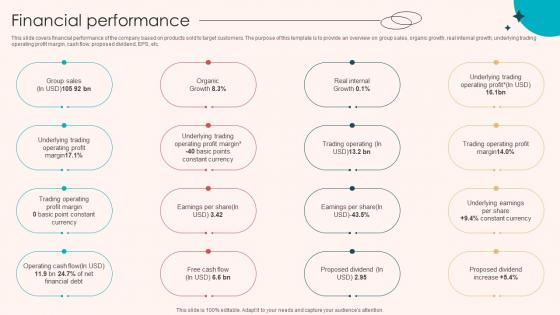
Financial Performance Retail Merchandising Company Investor Funding Elevator Pitch Deck Ppt Slides
This slide covers financial performance of the company based on products sold to target customers. The purpose of this template is to provide an overview on group sales, organic growth, real internal growth, underlying trading operating profit margin, cash flow, proposed dividend, EPS, etc. Present like a pro with Financial Performance Retail Merchandising Company Investor Funding Elevator Pitch Deck Ppt Slides. Create beautiful presentations together with your team, using our easy-to-use presentation slides. Share your ideas in real-time and make changes on the fly by downloading our templates. So whether you are in the office, on the go, or in a remote location, you can stay in sync with your team and present your ideas with confidence. With Slidegeeks presentation got a whole lot easier. Grab these presentations today. This slide covers financial performance of the company based on products sold to target customers. The purpose of this template is to provide an overview on group sales, organic growth, real internal growth, underlying trading operating profit margin, cash flow, proposed dividend, EPS, etc.
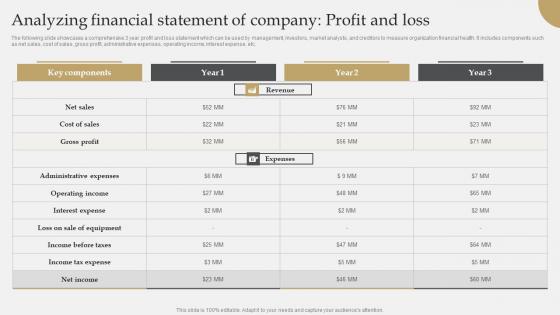
Analyzing Financial Statement Of Company Profit And Loss IT Industry Market Research Formats Pdf
The following slide showcases a comprehensive 3 year profit and loss statement which can be used by management, investors, market analysts, and creditors to measure organization financial health. It includes components such as net sales, cost of sales, gross profit, administrative expenses, operating income, interest expense, etc. Slidegeeks is one of the best resources for PowerPoint templates. You can download easily and regulate Analyzing Financial Statement Of Company Profit And Loss IT Industry Market Research Formats Pdf for your personal presentations from our wonderful collection. A few clicks is all it takes to discover and get the most relevant and appropriate templates. Use our Templates to add a unique zing and appeal to your presentation and meetings. All the slides are easy to edit and you can use them even for advertisement purposes. The following slide showcases a comprehensive 3 year profit and loss statement which can be used by management, investors, market analysts, and creditors to measure organization financial health. It includes components such as net sales, cost of sales, gross profit, administrative expenses, operating income, interest expense, etc.
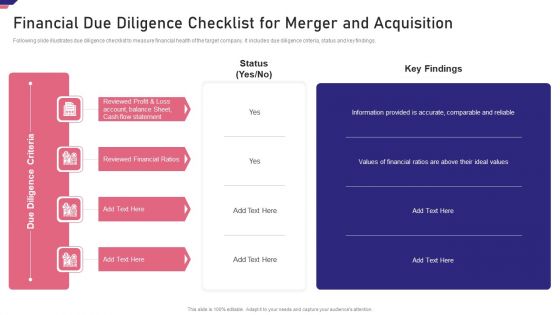
Mergers Acquisition Playbook Mergers Acquisition Playbook Financial Due Diligence Topics PDF
Following slide illustrates due diligence checklist to measure financial health of the target company. It includes due diligence criteria, status and key findings.Deliver and pitch your topic in the best possible manner with this Mergers Acquisition Playbook Mergers Acquisition Playbook Financial Due Diligence Topics PDF Use them to share invaluable insights on Reviewed Financial Ratios, Information Provided, Values Of Financial and impress your audience. This template can be altered and modified as per your expectations. So, grab it now.
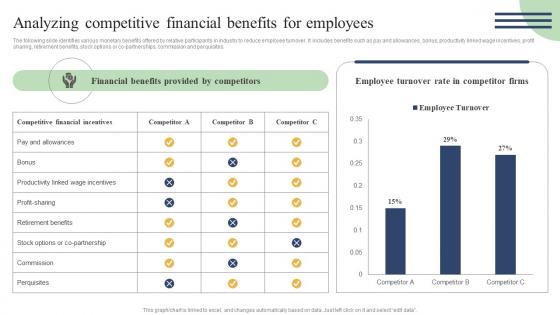
Action Measures To Build Staff Analyzing Competitive Financial Benefits For Employees Formats Pdf
The following slide identifies various monetary benefits offered by relative participants in industry to reduce employee turnover. It includes benefits such as pay and allowances, bonus, productivity linked wage incentives, profit sharing, retirement benefits, stock options or co-partnerships, commission and perquisites. Find a pre-designed and impeccable Action Measures To Build Staff Analyzing Competitive Financial Benefits For Employees Formats Pdf. The templates can ace your presentation without additional effort. You can download these easy-to-edit presentation templates to make your presentation stand out from others. So, what are you waiting for Download the template from Slidegeeks today and give a unique touch to your presentation. The following slide identifies various monetary benefits offered by relative participants in industry to reduce employee turnover. It includes benefits such as pay and allowances, bonus, productivity linked wage incentives, profit sharing, retirement benefits, stock options or co-partnerships, commission and perquisites.
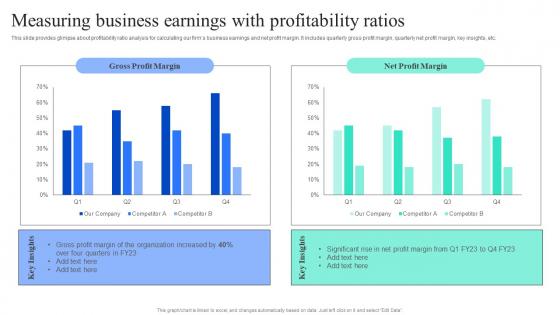
Strategic Financial Planning And Administration Measuring Business Earnings Profitability Ratios Designs PDF
This slide provides glimpse about profitability ratio analysis for calculating our firms business earnings and net profit margin. It includes quarterly gross profit margin, quarterly net profit margin, key insights, etc. Slidegeeks has constructed Strategic Financial Planning And Administration Measuring Business Earnings Profitability Ratios Designs PDF after conducting extensive research and examination. These presentation templates are constantly being generated and modified based on user preferences and critiques from editors. Here, you will find the most attractive templates for a range of purposes while taking into account ratings and remarks from users regarding the content. This is an excellent jumping-off point to explore our content and will give new users an insight into our top-notch PowerPoint Templates. This slide provides glimpse about profitability ratio analysis for calculating our firms business earnings and net profit margin. It includes quarterly gross profit margin, quarterly net profit margin, key insights, etc.
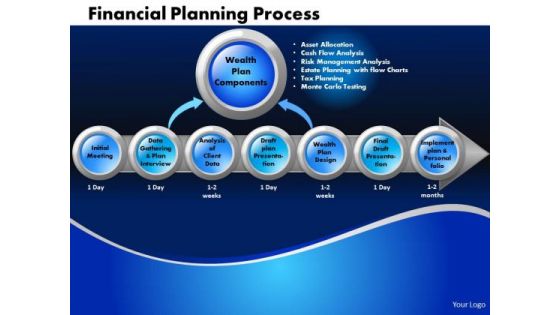
Business Circle Charts PowerPoint Templates Marketing Financial Planning Process Ppt Slides
Business Circle Charts PowerPoint Templates Marketing Financial Planning Process PPT Slides-This circle chart can be used in business, education and economic presentations to help the audience visualize the content better, or to find flaws in a financial planning process.-Business Circle Charts PowerPoint Templates Marketing Financial Planning Process PPT Slides-This template can be used for presentations relating to Abstract, Action, Business, Chart, Commerce, Competitor, Components, Concept, Conceptual, Design, Diagram, Executive, Financial, Goals, Guide, Guidelines, Hierarchy, Icon, Idea, Illustration, Manage, Management, Marketing, Mind, Mission, Model, Operations, Organization, Performance, Plan, Planning, Process Our Business Circle Charts PowerPoint Templates Marketing Financial Planning Process Ppt Slides team are good at their craft. They have chiselled out designer products.
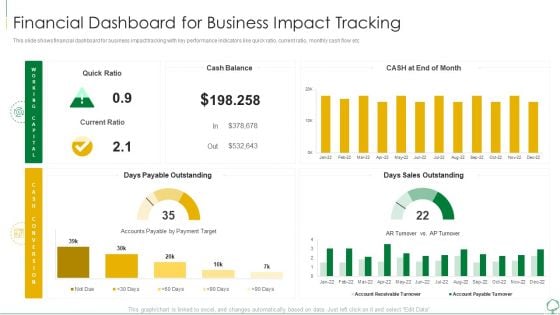
Environmental Examination Tools And Approaches Financial Dashboard For Business Professional PDF
This slide shows financial dashboard for business impact tracking with key performance indicators like quick ratio, current ratio, monthly cash flow etc. Deliver an awe inspiring pitch with this creative environmental examination tools and approaches financial dashboard for business professional pdf bundle. Topics like financial dashboard for business impact tracking can be discussed with this completely editable template. It is available for immediate download depending on the needs and requirements of the user.
Internal And External Business Environment Analysis Financial Dashboard For Business Impact Tracking Formats PDF
This slide shows financial dashboard for business impact tracking with key performance indicators like quick ratio, current ratio, monthly cash flow etc Deliver an awe inspiring pitch with this creative internal and external business environment analysis financial dashboard for business impact tracking formats pdf bundle. Topics like financial dashboard for business impact tracking can be discussed with this completely editable template. It is available for immediate download depending on the needs and requirements of the user.
Business Financial Summary Report And Marketing Highlights Ppt File Icon PDF
This slide represents business snapshot for financial and marketing highlights. It includes business objectives, opportunities and challenges, financial highlights, marketing strategy, future steps and priorities. Showcasing this set of slides titled Business Financial Summary Report And Marketing Highlights Ppt File Icon PDF. The topics addressed in these templates are Location, Marketing Strategy, Financials, Objectives. All the content presented in this PPT design is completely editable. Download it and make adjustments in color, background, font etc. as per your unique business setting.
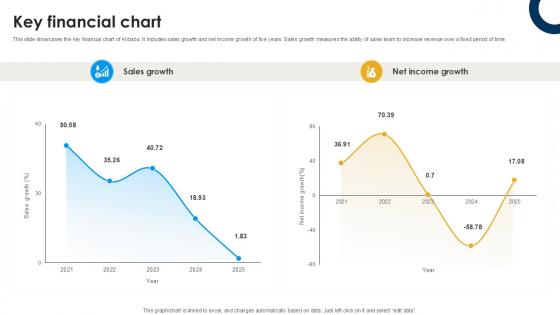
Key Financial Chart International Trade Of Products And Services PPT Template CP SS V
This slide showcases the key financial chart of Alibaba. It includes sales growth and net income growth of five years. Sales growth measures the ability of sales team to increase revenue over a fixed period of time. This modern and well-arranged Key Financial Chart International Trade Of Products And Services PPT Template CP SS V provides lots of creative possibilities. It is very simple to customize and edit with the Powerpoint Software. Just drag and drop your pictures into the shapes. All facets of this template can be edited with Powerpoint, no extra software is necessary. Add your own material, put your images in the places assigned for them, adjust the colors, and then you can show your slides to the world, with an animated slide included. This slide showcases the key financial chart of Alibaba. It includes sales growth and net income growth of five years. Sales growth measures the ability of sales team to increase revenue over a fixed period of time.
Cash Flow Metrics To Measure Firms Financial Position Icon Ppt Gallery Deck PDF
Showcasing this set of slides titled Cash Flow Metrics To Measure Firms Financial Position Icon Ppt Gallery Deck PDF. The topics addressed in these templates are Cash Flow, Metrics To Measure, Firms Financial, Position Icon. All the content presented in this PPT design is completely editable. Download it and make adjustments in color, background, font etc. as per your unique business setting.
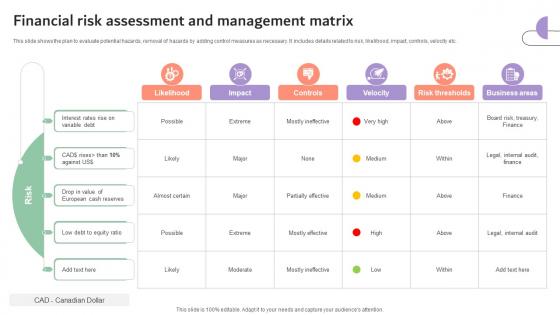
Financial Risk Assessment And Management Matrix Company Risk Monitoring And Mitigation DTE SS V
From laying roadmaps to briefing everything in detail, our templates are perfect for you. You can set the stage with your presentation slides. All you have to do is download these easy-to-edit and customizable templates. Financial Risk Assessment And Management Matrix Company Risk Monitoring And Mitigation DTE SS V will help you deliver an outstanding performance that everyone would remember and praise you for. Do download this presentation today. This slide shows the plan to evaluate potential hazards, removal of hazards by adding control measures as necessary. It includes details related to risk, likelihood, impact, controls, velocity etc.
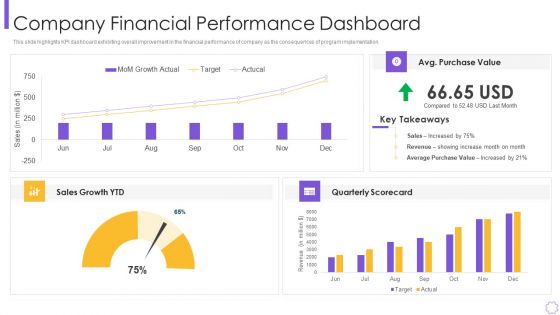
Organizational Program To Improve Team Productivity And Efficiency Company Financial Pictures PDF
This slide highlights KPI dashboard exhibiting overall improvement in the financial performance of company as the consequences of program implementation. Deliver an awe inspiring pitch with this creative organizational program to improve team productivity and efficiency company financial pictures pdf bundle. Topics like company financial performance dashboard can be discussed with this completely editable template. It is available for immediate download depending on the needs and requirements of the user.
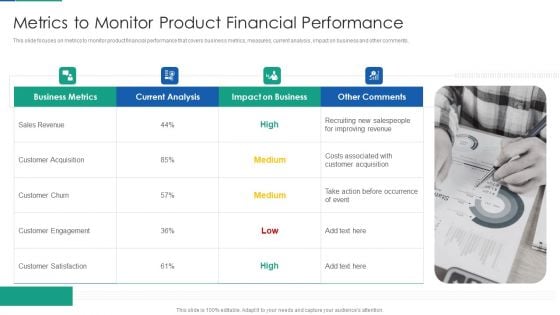
Agile Product Life Process Management Metrics To Monitor Product Financial Performance Ideas PDF
This slide focuses on metrics to monitor product financial performance that covers business metrics, measures, current analysis, impact on business and other comments. Presenting agile product life process management metrics to monitor product financial performance ideas pdf to provide visual cues and insights. Share and navigate important information on four stages that need your due attention. This template can be used to pitch topics like metrics to monitor product financial performance . In addtion, this PPT design contains high resolution images, graphics, etc, that are easily editable and available for immediate download.
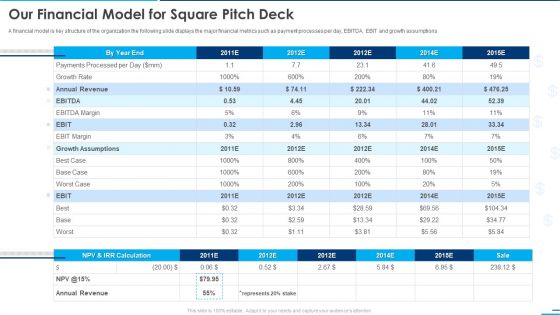
Our Financial Model For Square Pitch Deck Ppt Outline Master Slide PDF
A financial model is key structure of the organization the following slide displays the major financial metrics such as payment processes per day, EBITDA, EBIT and growth assumptions Deliver an awe inspiring pitch with this creative our financial model for square pitch deck ppt outline master slide pdf bundle. Topics like margin, growth rate, payments, annual revenue can be discussed with this completely editable template. It is available for immediate download depending on the needs and requirements of the user.
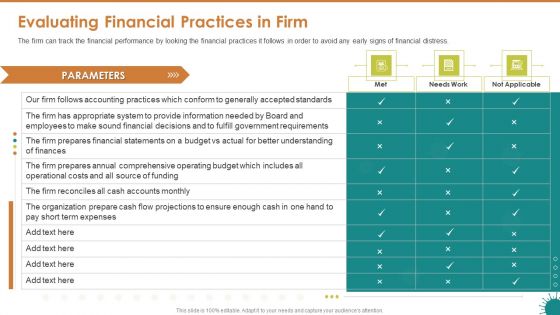
Covid 19 Risk Mitigation Measures On Live Sports Evaluating Financial Practices In Firm Template PDF
The firm can track the financial performance by looking the financial practices it follows in order to avoid any early signs of financial distress. Deliver and pitch your topic in the best possible manner with this covid 19 risk mitigation measures on live sports evaluating financial practices in firm template pdf. Use them to share invaluable insights on operational costs, operating budget, cash flow projections, short term expenses and impress your audience. This template can be altered and modified as per your expectations. So, grab it now.
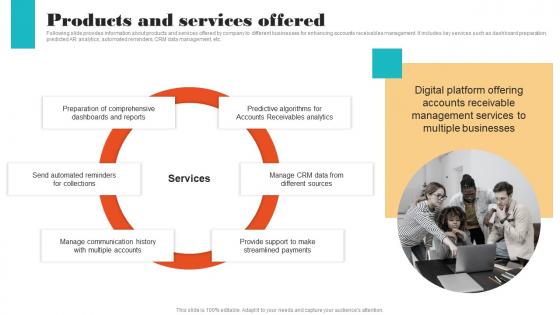
Products And Services Offered Online Financial Management Funding Elevator Portrait Pdf
Following slide provides information about products and services offered by company to different businesses for enhancing accounts receivables management. It includes key services such as dashboard preparation, predicted AR analytics, automated reminders, CRM data management, etc. Formulating a presentation can take up a lot of effort and time, so the content and message should always be the primary focus. The visuals of the PowerPoint can enhance the presenters message, so our Products And Services Offered Online Financial Management Funding Elevator Portrait Pdf was created to help save time. Instead of worrying about the design, the presenter can concentrate on the message while our designers work on creating the ideal templates for whatever situation is needed. Slidegeeks has experts for everything from amazing designs to valuable content, we have put everything into Products And Services Offered Online Financial Management Funding Elevator Portrait Pdf Following slide provides information about products and services offered by company to different businesses for enhancing accounts receivables management. It includes key services such as dashboard preparation, predicted AR analytics, automated reminders, CRM data management, etc.
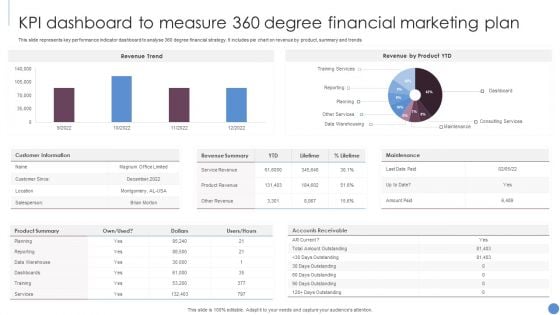
KPI Dashboard To Measure 360 Degree Financial Marketing Plan Slides PDF
This slide represents key performance indicator dashboard to analyse 360 degree financial strategy. It includes pie chart on revenue by product, summary and trends. Showcasing this set of slides titled KPI Dashboard To Measure 360 Degree Financial Marketing Plan Slides PDF. The topics addressed in these templates are Revenue Trend, Revenue Product YTD, Customer Information. All the content presented in this PPT design is completely editable. Download it and make adjustments in color, background, font etc. as per your unique business setting.
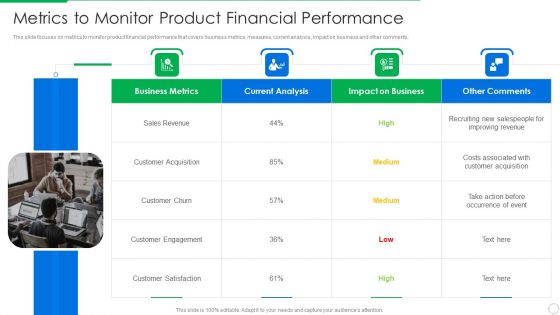
PLM Execution In Company Metrics To Monitor Product Financial Performance Demonstration PDF
This slide focuses on metrics to monitor product financial performance that covers business metrics, measures, current analysis, impact on business and other comments. Presenting plm execution in company metrics to monitor product financial performance demonstration pdf to provide visual cues and insights. Share and navigate important information on four stages that need your due attention. This template can be used to pitch topics like metrics to monitor product financial performance . In addtion, this PPT design contains high resolution images, graphics, etc, that are easily editable and available for immediate download.
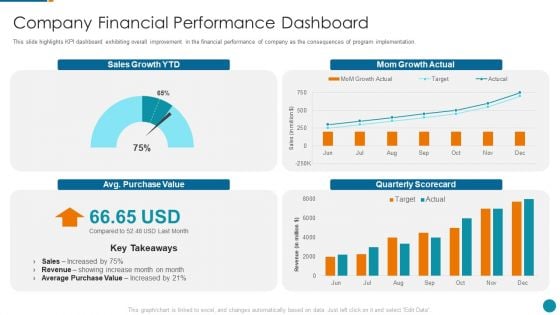
Strategic Procedure To Improve Employee Efficiency Company Financial Performance Dashboard Infographics PDF
This slide highlights KPI dashboard exhibiting overall improvement in the financial performance of company as the consequences of program implementation. Deliver and pitch your topic in the best possible manner with this strategic procedure to improve employee efficiency company financial performance dashboard infographics pdf Use them to share invaluable insights on company financial performance dashboard and impress your audience. This template can be altered and modified as per your expectations. So, grab it now.
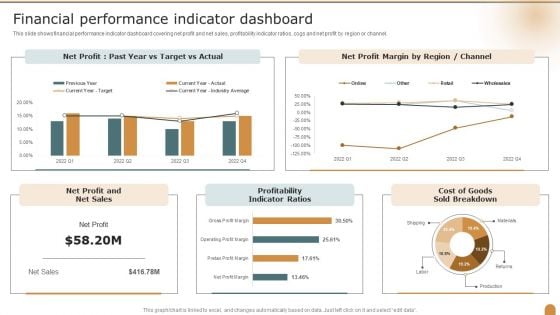
Financial Performance Indicator Dashboard Company Performance Evaluation Using KPI Structure PDF
This slide shows financial performance indicator dashboard covering net profit and net sales, profitability indicator ratios, cogs and net profit by region or channel. Deliver and pitch your topic in the best possible manner with this Financial Performance Indicator Dashboard Company Performance Evaluation Using KPI Structure PDF. Use them to share invaluable insights on Financial Performance, Indicator Dashboard, Profitability Indicator and impress your audience. This template can be altered and modified as per your expectations. So, grab it now.
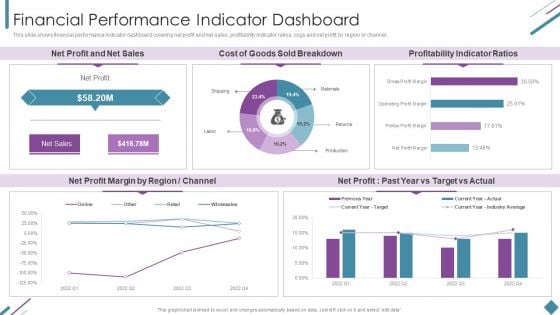
Metrics To Measure Business Performance Financial Performance Indicator Dashboard Pictures PDF
This slide shows financial performance indicator dashboard covering net profit and net sales, profitability indicator ratios, cogs and net profit by region or channel. Deliver an awe inspiring pitch with this creative Metrics To Measure Business Performance Financial Performance Indicator Dashboard Pictures PDF bundle. Topics like Net Profit, Net Sales, Cost Goods, Sold Breakdown can be discussed with this completely editable template. It is available for immediate download depending on the needs and requirements of the user.
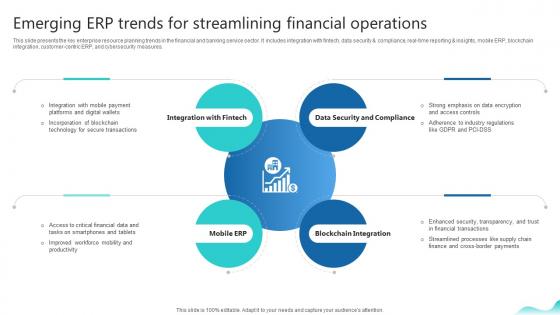
Emerging Erp Trends For Streamlining Financial Operations Erp And Digital Transformation For Maximizing DT SS V
This slide presents the key enterprise resource planning trends in the financial and banking service sector. It includes integration with fintech, data security and compliance, real-time reporting and insights, mobile ERP, blockchain integration, customer-centric ERP, and cybersecurity measures.Welcome to our selection of the Emerging Erp Trends For Streamlining Financial Operations Erp And Digital Transformation For Maximizing DT SS V. These are designed to help you showcase your creativity and bring your sphere to life. Planning and Innovation are essential for any business that is just starting out. This collection contains the designs that you need for your everyday presentations. All of our PowerPoints are 100 percent editable, so you can customize them to suit your needs. This multi-purpose template can be used in various situations. Grab these presentation templates today. This slide presents the key enterprise resource planning trends in the financial and banking service sector. It includes integration with fintech, data security and compliance, real-time reporting and insights, mobile ERP, blockchain integration, customer-centric ERP, and cybersecurity measures.
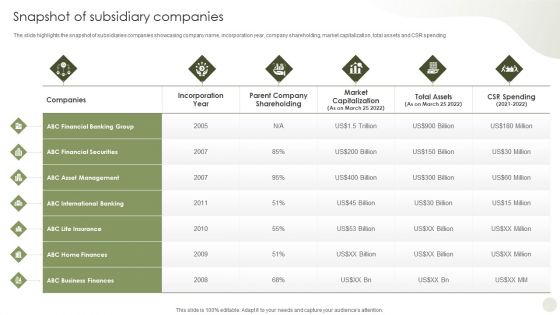
Commercial Bank Financial Services Company Profile Snapshot Of Subsidiary Companies Portrait PDF
The slide highlights the snapshot of subsidiaries companies showcasing company name, incorporation year, company shareholding, market capitalization, total assets and CSR spending. Deliver and pitch your topic in the best possible manner with this Commercial Bank Financial Services Company Profile Snapshot Of Subsidiary Companies Portrait PDF. Use them to share invaluable insights on Asset Management, Financial Securities, Home Finances, Business Finances and impress your audience. This template can be altered and modified as per your expectations. So, grab it now.
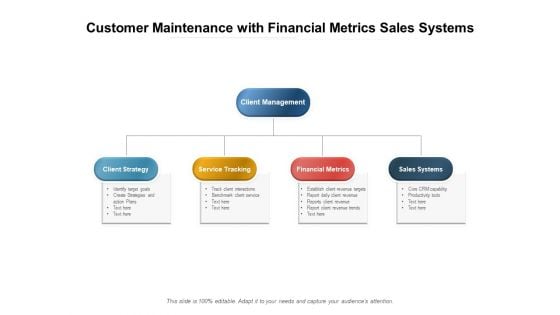
Customer Maintenance With Financial Metrics Sales Systems Ppt PowerPoint Presentation Portfolio Picture
Presenting this set of slides with name customer maintenance with financial metrics sales systems ppt powerpoint presentation portfolio picture. This is a four stage process. The stages in this process are client strategy, service tracking, financial metrics, sales systems. This is a completely editable PowerPoint presentation and is available for immediate download. Download now and impress your audience.
Financial Forecast And Essential Metrics Icon With Stats Ppt Background PDF
Presenting Financial Forecast And Essential Metrics Icon With Stats Ppt Background PDF to dispense important information. This template comprises three stages. It also presents valuable insights into the topics including Financial Forecast, Essential Metrics, Icon With Stats. This is a completely customizable PowerPoint theme that can be put to use immediately. So, download it and address the topic impactfully.
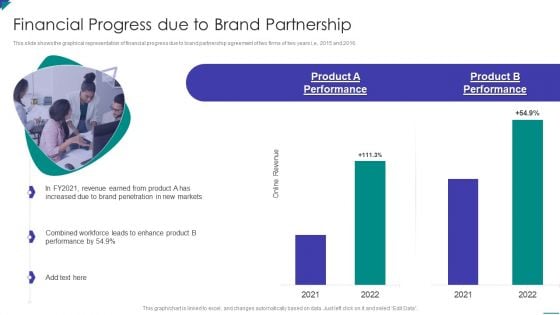
Project Schedule And Cost Management Bundle Financial Progress Due To Brand Partnership Summary PDF
This slide shows the graphical representation of financial progress due to brand partnership agreement of two firms of two years i,e, 2015 and 2016. Deliver and pitch your topic in the best possible manner with this Project Schedule And Cost Management Bundle Financial Progress Due To Brand Partnership Summary PDF. Use them to share invaluable insights on Brand Partnership, Financial Progress Product Performance and impress your audience. This template can be altered and modified as per your expectations. So, grab it now.
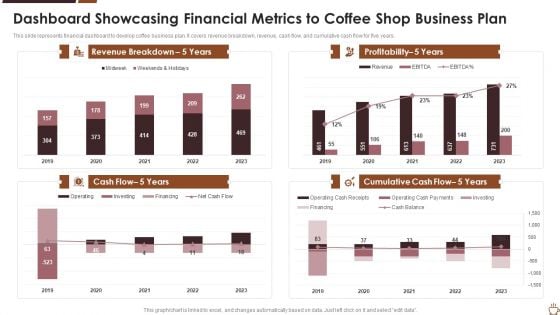
Dashboard Showcasing Financial Metrics To Coffee Shop Business Plan Background PDF
This slide represents financial dashboard to develop coffee business plan. It covers revenue breakdown, revenue, cash flow, and cumulative cash flow for five years. Showcasing this set of slides titled dashboard showcasing financial metrics to coffee shop business plan background pdf. The topics addressed in these templates are dashboard showcasing financial metrics to coffee shop business plan. All the content presented in this PPT design is completely editable. Download it and make adjustments in color, background, font etc. as per your unique business setting.
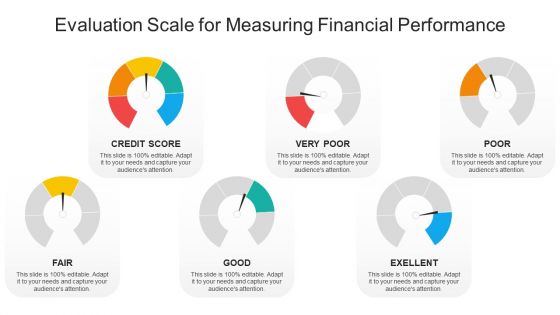
Evaluation Scale For Measuring Financial Performance Ppt PowerPoint Presentation File Professional PDF
Pitch your topic with ease and precision using this evaluation scale for measuring financial performance ppt powerpoint presentation file professional pdf. This layout presents information on evaluation scale for measuring financial performance. It is also available for immediate download and adjustment. So, changes can be made in the color, design, graphics or any other component to create a unique layout.
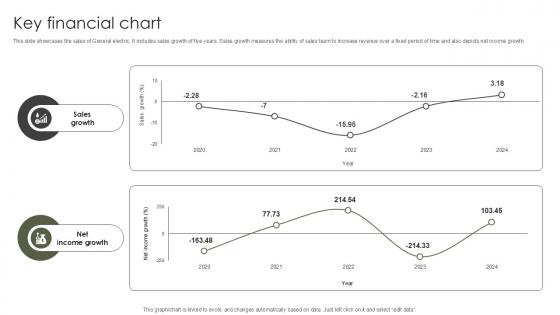
Key Financial Chart Military Aircraft Engine Manufacturing PPT Presentation CP SS V
This slide showcases the sales of General electric. It includes sales growth of five years. Sales growth measures the ability of sales team to increase revenue over a fixed period of time and also depicts net income growth. Explore a selection of the finest Key Financial Chart Military Aircraft Engine Manufacturing PPT Presentation CP SS V here. With a plethora of professionally designed and pre-made slide templates, you can quickly and easily find the right one for your upcoming presentation. You can use our Key Financial Chart Military Aircraft Engine Manufacturing PPT Presentation CP SS V to effectively convey your message to a wider audience. Slidegeeks has done a lot of research before preparing these presentation templates. The content can be personalized and the slides are highly editable. Grab templates today from Slidegeeks. This slide showcases the sales of General electric. It includes sales growth of five years. Sales growth measures the ability of sales team to increase revenue over a fixed period of time and also depicts net income growth.
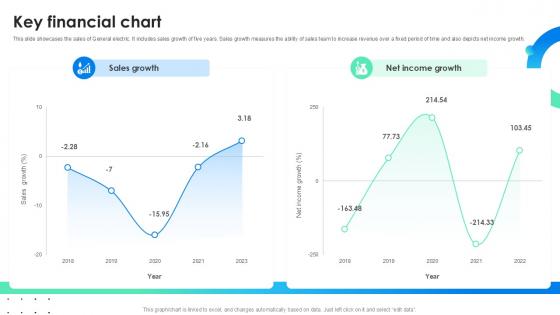
Key Financial Chart Global Energy Company Profile PPT Example CP SS V
This slide showcases the sales of General electric. It includes sales growth of five years. Sales growth measures the ability of sales team to increase revenue over a fixed period of time and also depicts net income growth. Explore a selection of the finest Key Financial Chart Global Energy Company Profile PPT Example CP SS V here. With a plethora of professionally designed and pre-made slide templates, you can quickly and easily find the right one for your upcoming presentation. You can use our Key Financial Chart Global Energy Company Profile PPT Example CP SS V to effectively convey your message to a wider audience. Slidegeeks has done a lot of research before preparing these presentation templates. The content can be personalized and the slides are highly editable. Grab templates today from Slidegeeks. This slide showcases the sales of General electric. It includes sales growth of five years. Sales growth measures the ability of sales team to increase revenue over a fixed period of time and also depicts net income growth.

Funding Pitch On Key Financial Metrics Dashboard Ppt Ideas Deck PDF
This slide illustrates facts and figures related to important financial metrics It includes cash flow, DSO, ROCE, EPS diluted for Q4 FY21, Q3 FY22 and Q4 FY22 etc. Showcasing this set of slides titled Funding Pitch On Key Financial Metrics Dashboard Ppt Ideas Deck PDF. The topics addressed in these templates are Cash Flow, EPS Diluted, ROCE. All the content presented in this PPT design is completely editable. Download it and make adjustments in color, background, font etc. as per your unique business setting.
Dashboard For Financial Summary Vector Icon Ppt PowerPoint Presentation Infographic Template Design Inspiration PDF
Presenting this set of slides with name dashboard for financial summary vector icon ppt powerpoint presentation infographic template design inspiration pdf. This is a three stage process. The stages in this process are dashboard for financial summary vector icon. This is a completely editable PowerPoint presentation and is available for immediate download. Download now and impress your audience.
KPI Dashboard For Tracking Commercial Banking And Financial Activities Download PDF
This slide depicts a dashboard for tracking the banking and financial activities of a business enterprise to measure the income and expenses. The key performing indicators are business accounts, paid, pending and cancelled transactions etc. Pitch your topic with ease and precision using this KPI Dashboard For Tracking Commercial Banking And Financial Activities Download PDF. This layout presents information on KPI Dashboard, Tracking Commercial Banking, Financial Activities. It is also available for immediate download and adjustment. So, changes can be made in the color, design, graphics or any other component to create a unique layout.

Financial Assets Management KPI And Dashboard Ppt PowerPoint Presentation Complete Deck With Slides
Presenting this set of slides with name financial assets management kpi and dashboard ppt powerpoint presentation complete deck with slides. The topics discussed in these slides are pipeline projects, financial forecast, work forecast. This is a completely editable PowerPoint presentation and is available for immediate download. Download now and impress your audience.
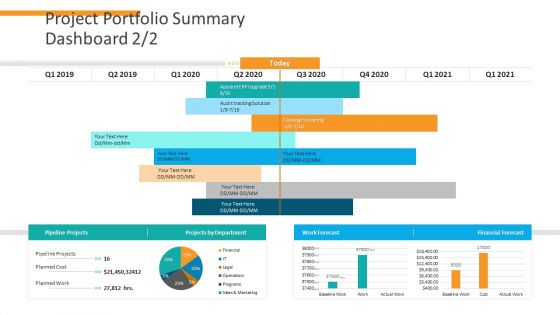
Organizational Financial Assets Assessment Project Portfolio Summary Dashboard Gride Designs PDF
Deliver an awe-inspiring pitch with this creative organizational financial assets assessment project portfolio summary dashboard gride designs pdf. bundle. Topics like pipeline projects, projects by department, financial forecast can be discussed with this completely editable template. It is available for immediate download depending on the needs and requirements of the user.
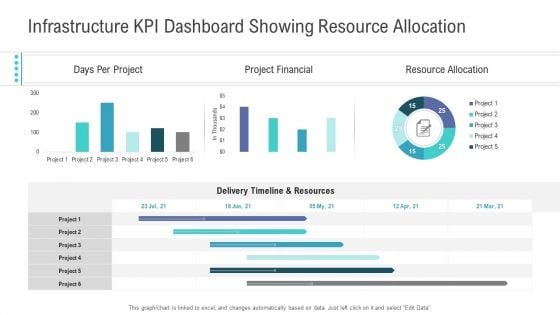
Financial Functional Assessment Infrastructure KPI Dashboard Showing Resource Allocation Ideas PDF
Deliver an awe-inspiring pitch with this creative financial functional assessment infrastructure kpi dashboard showing resource allocation ideas pdf bundle. Topics like resource allocation, project financial, delivery timeline, resources can be discussed with this completely editable template. It is available for immediate download depending on the needs and requirements of the user.
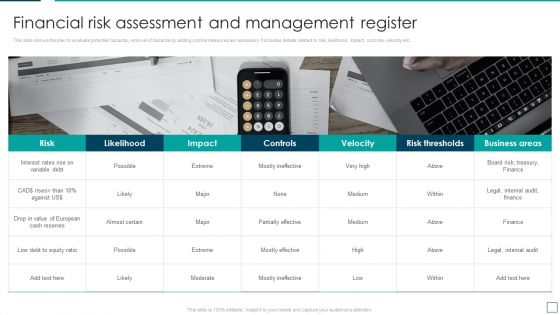
Strategic Risk Management And Mitigation Plan Financial Risk Assessment And Management Register Portrait PDF
This slide shows the plan to evaluate potential hazards, removal of hazards by adding control measures as necessary. It includes details related to risk, likelihood, impact, controls, velocity etc. Slidegeeks is one of the best resources for PowerPoint templates. You can download easily and regulate Strategic Risk Management And Mitigation Plan Financial Risk Assessment And Management Register Portrait PDF for your personal presentations from our wonderful collection. A few clicks is all it takes to discover and get the most relevant and appropriate templates. Use our Templates to add a unique zing and appeal to your presentation and meetings. All the slides are easy to edit and you can use them even for advertisement purposes.
Financial Performance Measures Ppt PowerPoint Presentation Infographic Template File Formats Cpb
Presenting this set of slides with name financial performance measures ppt powerpoint presentation infographic template file formats cpb. This is an editable Powerpoint seven stages graphic that deals with topics like financial performance measures to help convey your message better graphically. This product is a premium product available for immediate download and is 100 percent editable in Powerpoint. Download this now and use it in your presentations to impress your audience.


 Continue with Email

 Home
Home


