Growth Chart

Create A Restaurant Marketing Highlighting Graphical Sales Growth Of Restaurant
This slide shows the current revenue growth chart of the restaurant business. The purpose of this slide is to compare the sales growth of pervious year with current year. Find highly impressive Create A Restaurant Marketing Highlighting Graphical Sales Growth Of Restaurant on Slidegeeks to deliver a meaningful presentation. You can save an ample amount of time using these presentation templates. No need to worry to prepare everything from scratch because Slidegeeks experts have already done a huge research and work for you. You need to download Create A Restaurant Marketing Highlighting Graphical Sales Growth Of Restaurant for your upcoming presentation. All the presentation templates are 100 percent editable and you can change the color and personalize the content accordingly. Download now This slide shows the current revenue growth chart of the restaurant business. The purpose of this slide is to compare the sales growth of pervious year with current year.

PowerPoint Presentation Chart Hexagon Jigsaw Ppt Backgrounds
PowerPoint_Presentation_Chart_Hexagon_Jigsaw_PPT_Backgrounds.pptx-Puzzles PowerPoint templates being the perennial educational tool. Emphasize the process of your business/corporate growth. Highlight your ideas broad- based on strong fundamentals and illustrate how they step by step achieve the set growth factor. Our PowerPoint Presentation Chart Hexagon Jigsaw Ppt Backgrounds aredelightfully crafted. Designed to charm the biggest disbelievers.
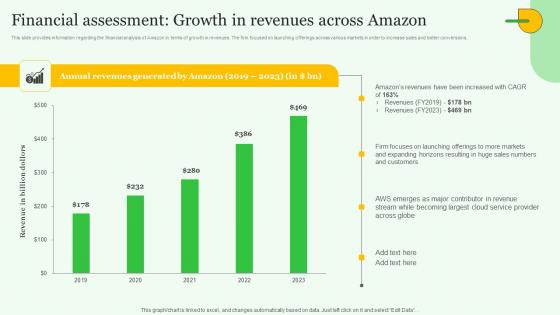
Financial Assessment Growth Exploring Amazons Global Business Model Growth Graphics Pdf
This slide provides information regarding the financial analysis of Amazon in terms of growth in revenues. The firm focused on launching offerings across various markets in order to increase sales and better conversions. Make sure to capture your audiences attention in your business displays with our gratis customizable Financial Assessment Growth Exploring Amazons Global Business Model Growth Graphics Pdf. These are great for business strategies, office conferences, capital raising or task suggestions. If you desire to acquire more customers for your tech business and ensure they stay satisfied, create your own sales presentation with these plain slides. This slide provides information regarding the financial analysis of Amazon in terms of growth in revenues. The firm focused on launching offerings across various markets in order to increase sales and better conversions.

Micosoft Intensive Growth Microsoft Corporations Revenue Growth Graph Strategy SS V
This slide represents graph which ca be used to calculate the revenue growth of microsoft in last twenty years. Microsofts revenue has been growing continuously over the past 5 years since. Slidegeeks has constructed Micosoft Intensive Growth Microsoft Corporations Revenue Growth Graph Strategy SS V after conducting extensive research and examination. These presentation templates are constantly being generated and modified based on user preferences and critiques from editors. Here, you will find the most attractive templates for a range of purposes while taking into account ratings and remarks from users regarding the content. This is an excellent jumping-off point to explore our content and will give new users an insight into our top-notch PowerPoint Templates. This slide represents graph which ca be used to calculate the revenue growth of microsoft in last twenty years. Microsofts revenue has been growing continuously over the past 5 years since.
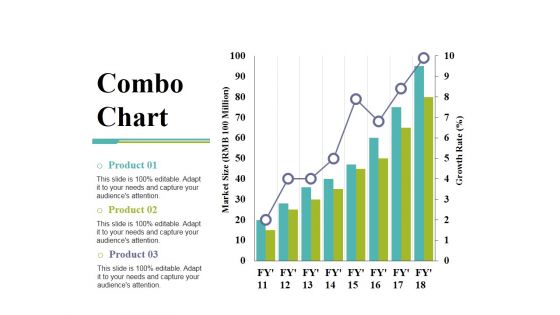
Combo Chart Ppt PowerPoint Presentation Show Deck
This is a combo chart ppt powerpoint presentation show deck. This is a three stage process. The stages in this process are growth rate, market size, product, bar graph, growth.
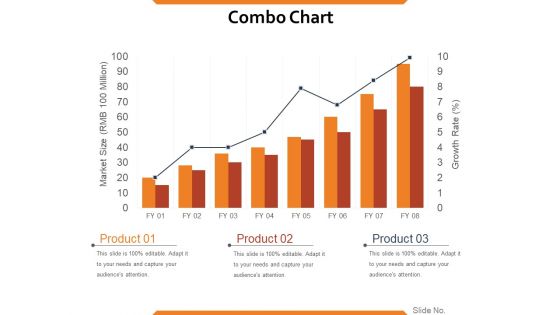
Combo Chart Ppt PowerPoint Presentation Styles Good
This is a combo chart ppt powerpoint presentation styles good. This is a eight stage process. The stages in this process are market size, growth rate, product, growth, strategy, graph, finance.
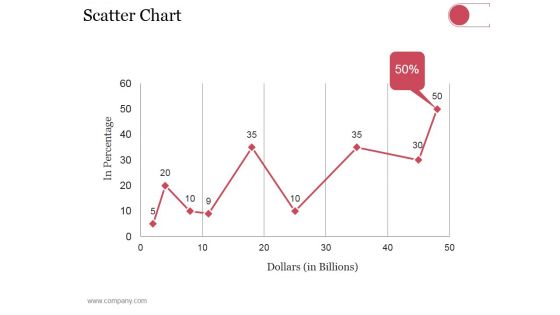
Scatter Chart Ppt PowerPoint Presentation Styles Show
This is a scatter chart ppt powerpoint presentation styles show. This is a nine stage process. The stages in this process are dollars, in percentage, finance, growth strategy.
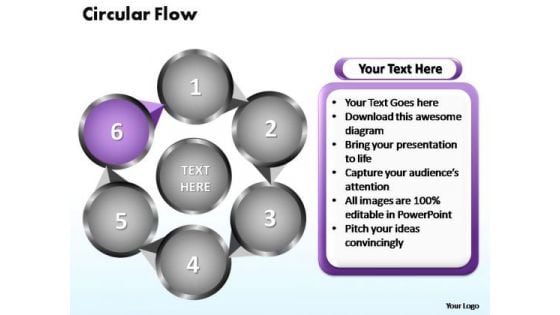
PowerPoint Themes Circular Flow Chart Ppt Slide
PowerPoint Themes Circular Flow Chart PPT Slide-Flowchart is a simple mapping tool that shows the sequence of actions within a process. Flowchart is widely used in business, education and economic presentations to help the audience visualize the content better, or to find flaws in a process.-PowerPoint Themes Circular Flow Chart PPT Slide Intensify growth with our PowerPoint Themes Circular Flow Chart Ppt Slide. Download without worries with our money back guaranteee.
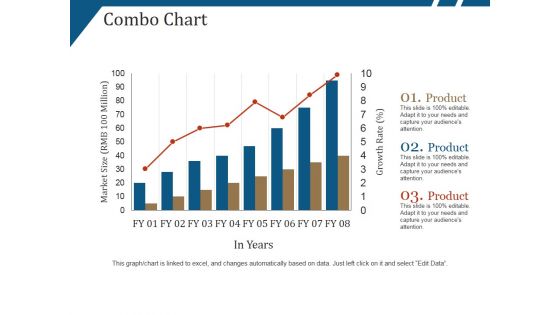
Combo Chart Ppt PowerPoint Presentation Summary Ideas
This is a combo chart ppt powerpoint presentation summary ideas. This is a eight stage process. The stages in this process are market size, growth rate, product, in years.
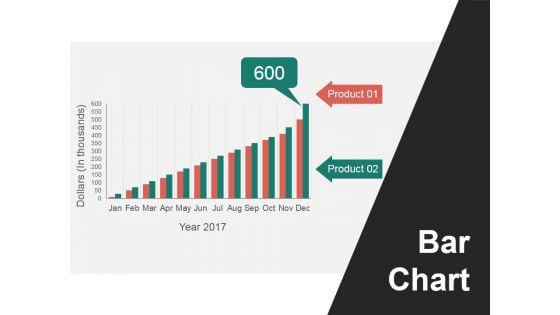
Bar Chart Ppt PowerPoint Presentation Pictures Mockup
This is a bar chart ppt powerpoint presentation pictures mockup. This is a twelve stage process. The stages in this process are dollars, product, bar chart.
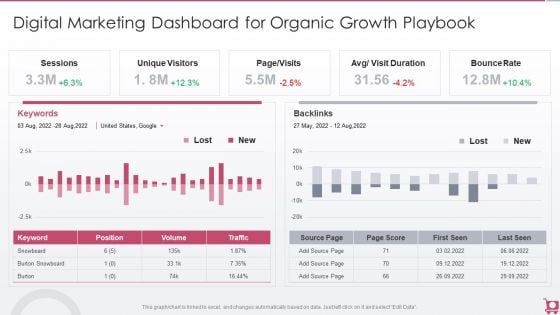
Playbook For Sales Growth Strategies Digital Marketing Dashboard For Organic Growth Designs PDF
This graph or chart is linked to excel, and changes automatically based on data. Just left click on it and select Edit Data. Deliver and pitch your topic in the best possible manner with this Playbook For Sales Growth Strategies Digital Marketing Dashboard For Organic Growth Designs PDF. Use them to share invaluable insights on Unique Visitors, Sessions, Bounce Rate and impress your audience. This template can be altered and modified as per your expectations. So, grab it now.
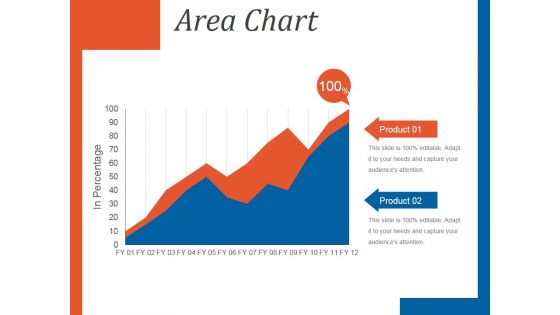
Area Chart Ppt PowerPoint Presentation Diagrams
This is a area chart ppt powerpoint presentation diagrams.This is a two stage process. The stages in this process are in percentage, area chart, product.
Column Chart Ppt PowerPoint Presentation Summary Icon
This is a column chart ppt powerpoint presentation summary icon. This is a two stage process. The stages in this process are column chart, dollars, product.
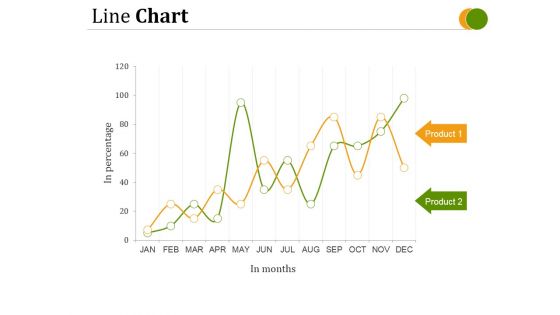
Line Chart Ppt PowerPoint Presentation Microsoft
This is a line chart ppt powerpoint presentation microsoft. This is a two stage process. The stages in this process are line chart, business, marketing, success, management.
Combo Chart Ppt PowerPoint Presentation Icon Portrait
This is a combo chart ppt powerpoint presentation icon portrait. This is a three stage process. The stages in this process are combo chart, finance, marketing, strategy, analysis.
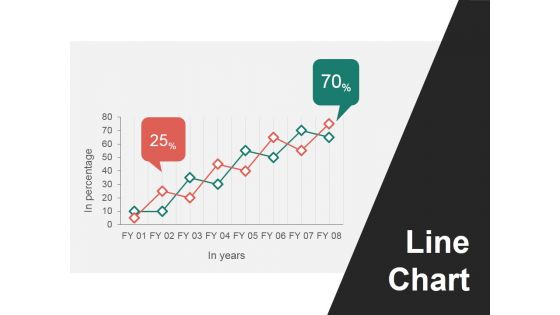
Line Chart Ppt PowerPoint Presentation Ideas Portfolio
This is a line chart ppt powerpoint presentation ideas portfolio. This is a two stage process. The stages in this process are line chart, in years, in percentage.
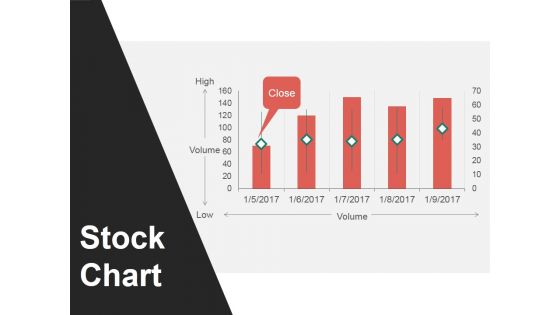
Stock Chart Ppt PowerPoint Presentation Slides Download
This is a stock chart ppt powerpoint presentation slides download. This is a five stage process. The stages in this process are stock chart, high, volume, low.
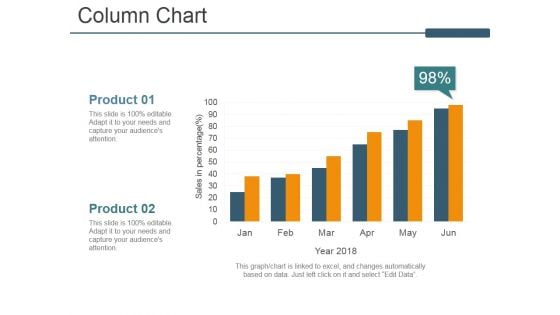
Column Chart Ppt PowerPoint Presentation Ideas Guidelines
This is a column chart ppt powerpoint presentation ideas guidelines. This is a two stage process. The stages in this process are column chart, product, year, business, marketing.
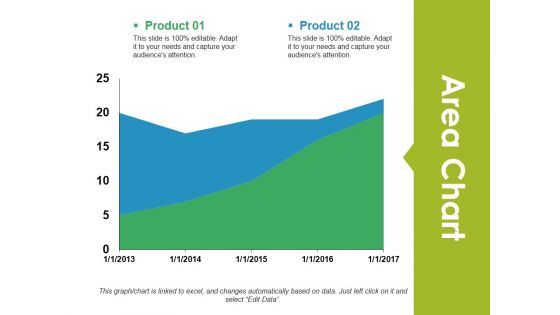
Area Chart Ppt PowerPoint Presentation Outline Deck
This is a area chart ppt powerpoint presentation outline deck. This is a two stage process. The stages in this process are area chart, finance, marketing, analysis, business.
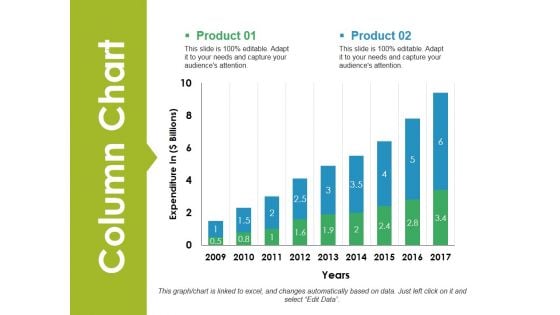
Column Chart Ppt PowerPoint Presentation File Graphics
This is a column chart ppt powerpoint presentation file graphics. This is a two stage process. The stages in this process are column chart, finance, analysis, marketing, business.

Business Growth Statistics PowerPoint Templates And PowerPoint Themes 0912
Business Growth Statistics PowerPoint Templates And PowerPoint Themes 0912-Microsoft Powerpoint Templates and Background with business growth chart-Business growth chart, internet, technology, marketing, success, finance Arm your team with our Business Growth Statistics PowerPoint Templates And PowerPoint Themes 0912. You will come out on top.
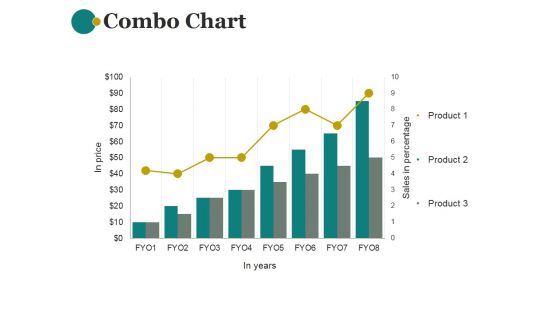
Combo Chart Ppt PowerPoint Presentation Shapes
This is a combo chart ppt powerpoint presentation shapes. This is a eight stage process. The stages in this process are combo chart, business, marketing, sales in percentage, bar graph.
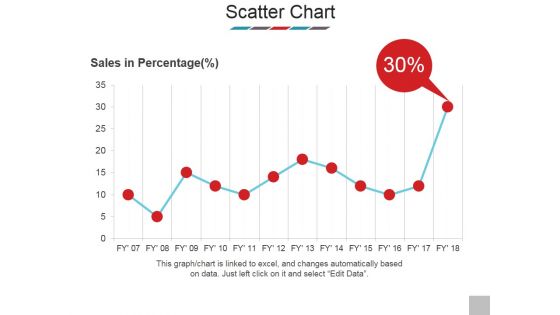
Scatter Chart Ppt PowerPoint Presentation Model Show
This is a scatter chart ppt powerpoint presentation model show. This is a one stage process. The stages in this process are sales in percentage, scatter chart, business, bar graph, marketing.
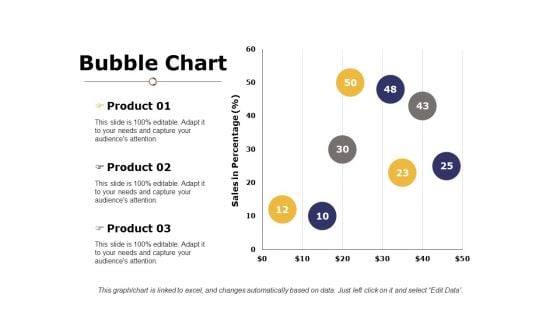
Bubble Chart Ppt PowerPoint Presentation Layouts Demonstration
This is a bubble chart ppt powerpoint presentation icon structure. This is a three stage process. The stages in this process are product, sales in percentage, bubble chart.
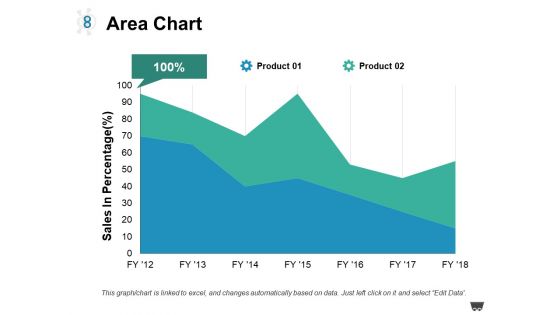
Area Chart Ppt PowerPoint Presentation Model Guidelines
This is a area chart ppt powerpoint presentation model guidelines. This is a two stage process. The stages in this process are product, area chart, sales in percentage.
Line Chart Ppt PowerPoint Presentation Icon Example
This is a line chart ppt powerpoint presentation icon example. This is a two stage process. The stages in this process are products, profit, line chart, business, marketing.
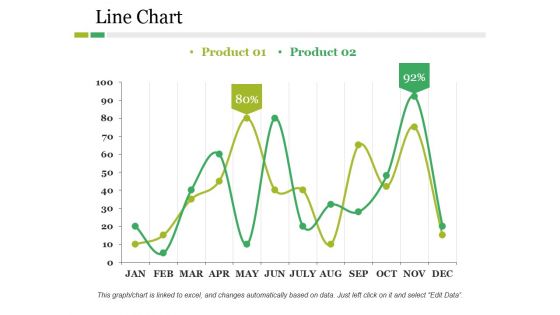
Line Chart Ppt PowerPoint Presentation Pictures Structure
This is a line chart ppt powerpoint presentation pictures structure. This is a two stage process. The stages in this process are product, business, line chart, finance, percentage.
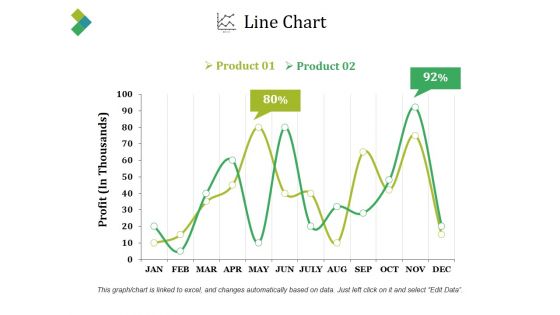
Line Chart Ppt PowerPoint Presentation Slides
This is a line chart ppt powerpoint presentation slides. This is a two stage process. The stages in this process are product, profit, percentage, finance, line chart.
Bubble Chart Ppt PowerPoint Presentation Pictures Icons
This is a bubble chart ppt powerpoint presentation pictures icons. This is a two stage process. The stages in this process are product, profit, bubble chart.
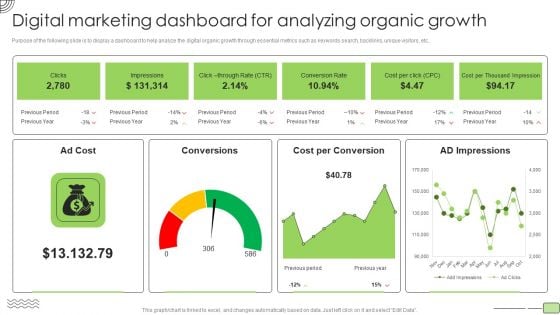
Organic Business Growth Strategies Digital Marketing Dashboard For Analyzing Organic Growth Introduction PDF
Purpose of the following slide is to display a dashboard to help analyze the digital organic growth through essential metrics such as keywords search, backlinks, unique visitors, etc. Deliver an awe inspiring pitch with this creative Organic Business Growth Strategies Digital Marketing Dashboard For Analyzing Organic Growth Introduction PDF bundle. Topics like Cost, Conversion Rate, Analyzing Organic Growth can be discussed with this completely editable template. It is available for immediate download depending on the needs and requirements of the user.
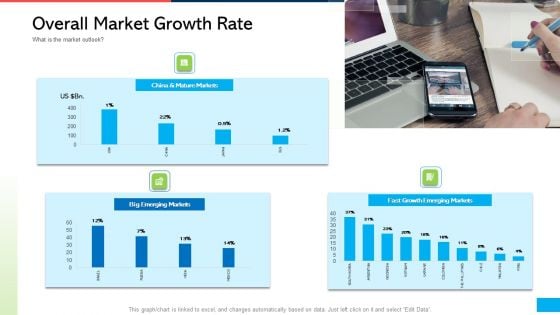
How Develop Perfect Growth Strategy For Your Company Overall Market Growth Rate Ppt Gallery Picture PDF
Deliver an awe-inspiring pitch with this creative how develop perfect growth strategy for your company overall market growth rate ppt gallery picture pdf bundle. Topics like mature markets, big emerging markets, fast growth emerging markets can be discussed with this completely editable template. It is available for immediate download depending on the needs and requirements of the user.
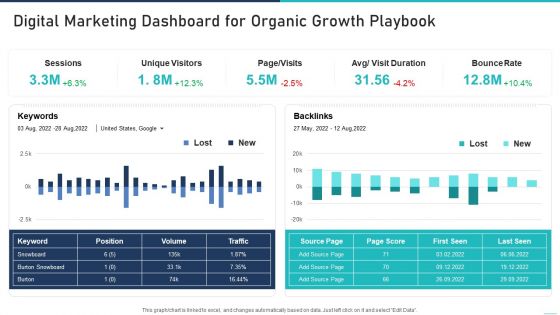
Generic Growth Playbook Digital Marketing Dashboard For Organic Growth Playbook Guidelines PDF
Deliver and pitch your topic in the best possible manner with this generic growth playbook digital marketing dashboard for organic growth playbook guidelines pdf Use them to share invaluable insights on digital marketing dashboard for organic growth playbook and impress your audience. This template can be altered and modified as per your expectations. So, grab it now.
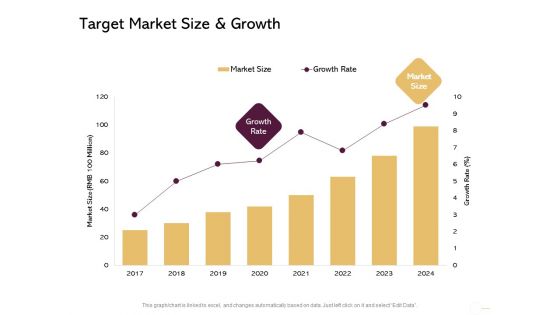
Managing Portfolio Growth Options Target Market Size And Growth Rate Inspiration PDF
Presenting this set of slides with name managing portfolio growth options target market size and growth rate inspiration pdf. The topics discussed in these slides are market size, growth rate. This is a completely editable PowerPoint presentation and is available for immediate download. Download now and impress your audience.
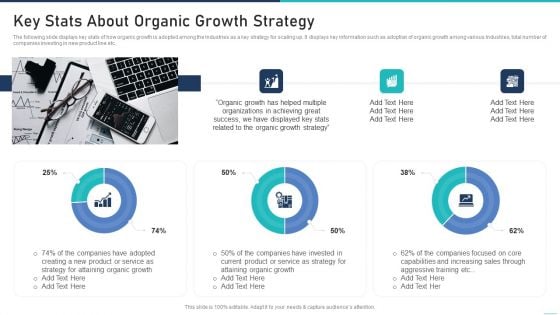
Generic Growth Playbook Key Stats About Organic Growth Strategy Guidelines PDF
The following slide displays key stats of how organic growth is adopted among the Industries as a key strategy for scaling up. It displays key information such as adoption of organic growth among various Industries, total number of companies investing in new product line etc. Deliver and pitch your topic in the best possible manner with this generic growth playbook key stats about organic growth strategy guidelines pdf Use them to share invaluable insights on key stats about organic growth strategy and impress your audience. This template can be altered and modified as per your expectations. So, grab it now.
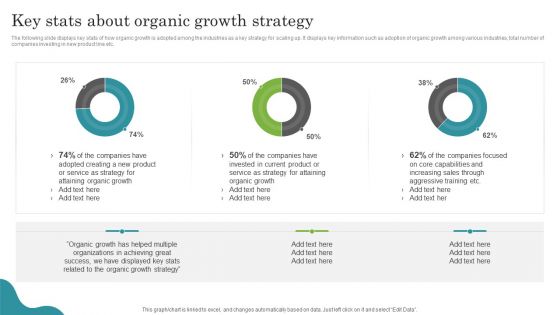
Promoting Growth Internal Operations Techniques Playbook Key Stats About Organic Growth Strategy Professional PDF
The following slide displays key stats of how organic growth is adopted among the industries as a key strategy for scaling up. It displays key information such as adoption of organic growth among various industries, total number of companies investing in new product line etc. Deliver an awe inspiring pitch with this creative Promoting Growth Internal Operations Techniques Playbook Key Stats About Organic Growth Strategy Professional PDF bundle. Topics like Organizations, Organic Growth, Strategy can be discussed with this completely editable template. It is available for immediate download depending on the needs and requirements of the user.
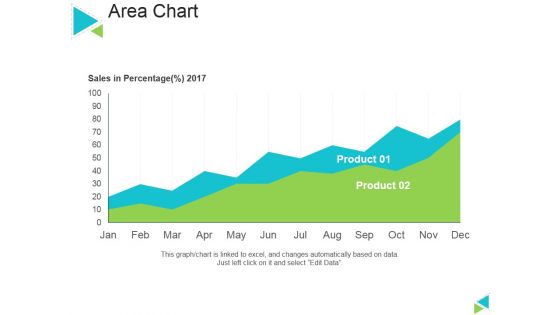
Area Chart Ppt PowerPoint Presentation Inspiration Themes
This is a area chart ppt powerpoint presentation inspiration themes. This is a two stage process. The stages in this process are sales in percentage, product, area chart, business, marketing.
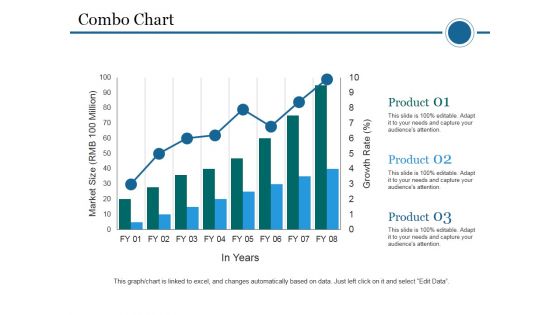
Combo Chart Ppt PowerPoint Presentation Infographics Summary
This is a combo chart ppt powerpoint presentation infographics summary. This is a three stage process. The stages in this process are market size, product, combo chart, years, business.
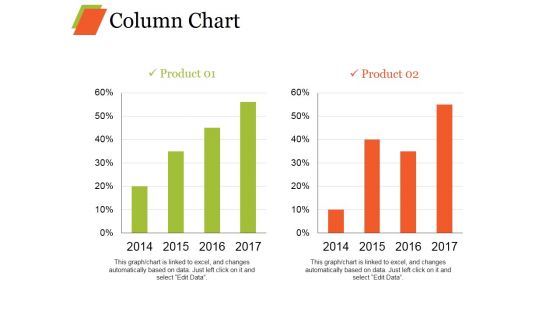
Column Chart Ppt PowerPoint Presentation Infographics Model
This is a column chart ppt powerpoint presentation infographics model. This is a two stage process. The stages in this process are bar graph, growth, product, percentage, year.
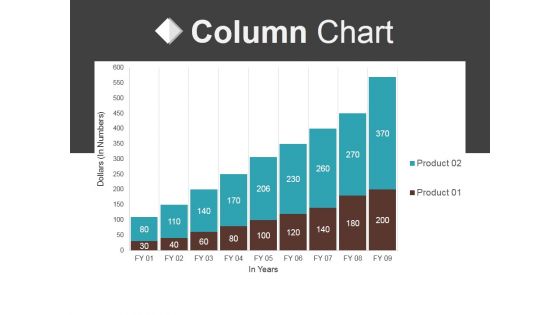
Column Chart Ppt PowerPoint Presentation Professional Vector
This is a column chart ppt powerpoint presentation professional vector. This is a nine stage process. The stages in this process are business, marketing, graph, finance, growth.
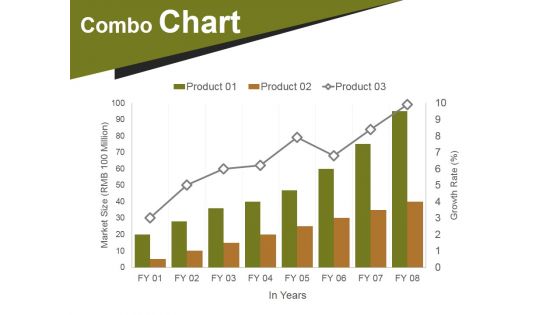
Combo Chart Ppt PowerPoint Presentation Portfolio Infographics
This is a combo chart ppt powerpoint presentation portfolio infographics. This is a eight stage process. The stages in this process are market size, growth, years, finance, business.
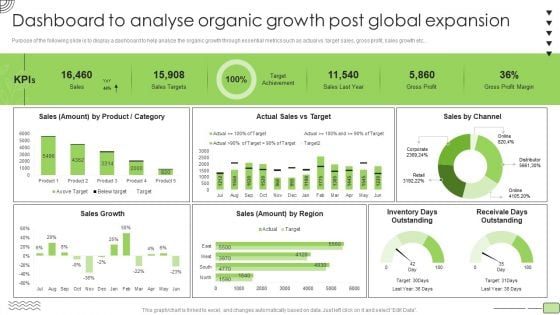
Organic Business Growth Strategies Dashboard To Analyse Organic Growth Post Global Expansion Background PDF
Purpose of the following slide is to display a dashboard to help analyze the organic growth through essential metrics such as actual vs. target sales, gross profit, sales growth etc. Deliver and pitch your topic in the best possible manner with this Organic Business Growth Strategies Dashboard To Analyse Organic Growth Post Global Expansion Background PDF. Use them to share invaluable insights on Sales, Product, Target and impress your audience. This template can be altered and modified as per your expectations. So, grab it now.
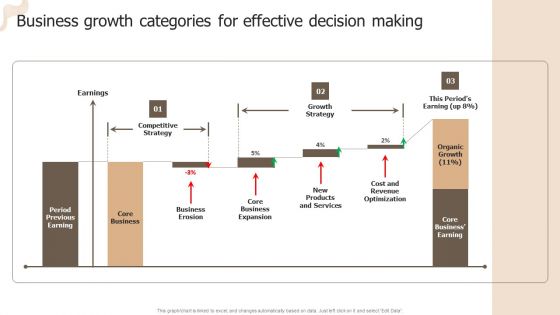
Designing Strategies For Company Growth And Success Business Growth Categories For Effective Decision Making Clipart PDF
Whether you have daily or monthly meetings, a brilliant presentation is necessary. Designing Strategies For Company Growth And Success Business Growth Categories For Effective Decision Making Clipart PDF can be your best option for delivering a presentation. Represent everything in detail using Designing Strategies For Company Growth And Success Business Growth Categories For Effective Decision Making Clipart PDF and make yourself stand out in meetings. The template is versatile and follows a structure that will cater to your requirements. All the templates prepared by Slidegeeks are easy to download and edit. Our research experts have taken care of the corporate themes as well. So, give it a try and see the results.
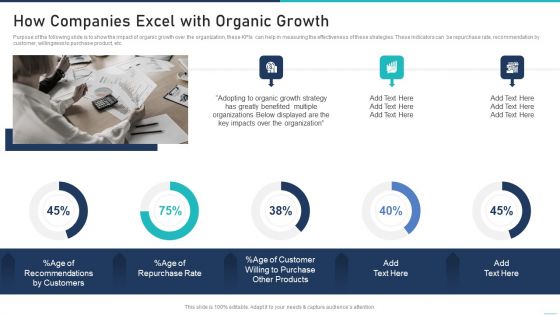
Generic Growth Playbook How Companies Excel With Organic Growth Designs PDF
Purpose of the following slide is to show the impact of organic growth over the organization, these KPIs can help in measuring the effectiveness of these strategies. These indicators can be repurchase rate, recommendation by customer, willingness to purchase product, etc. Deliver and pitch your topic in the best possible manner with this generic growth playbook how companies excel with organic growth designs pdf Use them to share invaluable insights on how companies excel with organic growth and impress your audience. This template can be altered and modified as per your expectations. So, grab it now.
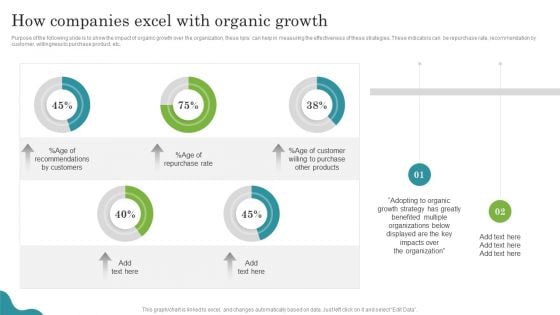
Promoting Growth Internal Operations Techniques Playbook How Companies Excel With Organic Growth Rules PDF
Purpose of the following slide is to show the impact of organic growth over the organization, these kpis can help in measuring the effectiveness of these strategies. These indicators can be repurchase rate, recommendation by customer, willingness to purchase product, etc. Deliver an awe inspiring pitch with this creative Promoting Growth Internal Operations Techniques Playbook How Companies Excel With Organic Growth Rules PDF bundle. Topics like Organizations, Growth Strategy, Purchase can be discussed with this completely editable template. It is available for immediate download depending on the needs and requirements of the user.
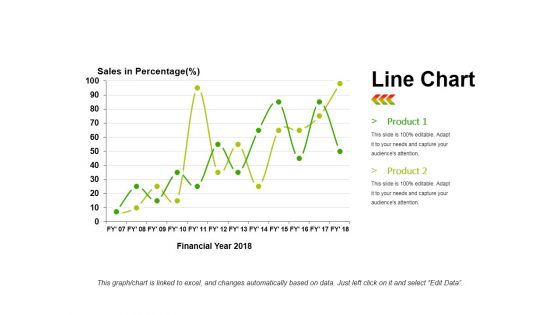
Line Chart Ppt PowerPoint Presentation Infographics Infographics
This is a line chart ppt powerpoint presentation infographics infographics. This is a two stage process. The stages in this process are product, sales in percentage, financial year, line chart, finance.
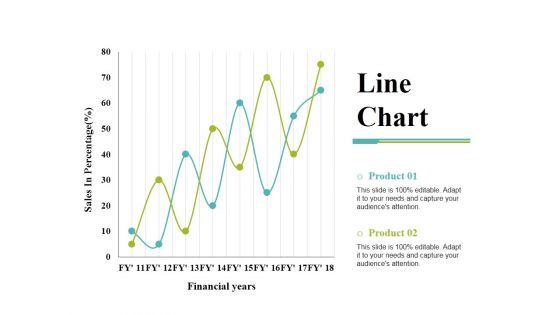
Line Chart Ppt PowerPoint Presentation Gallery Templates
This is a line chart ppt powerpoint presentation gallery templates. This is a two stage process. The stages in this process are product, financial years, sales in percentage, line chart.
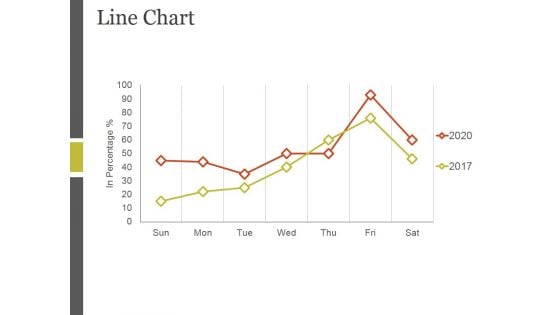
Line Chart Ppt PowerPoint Presentation Ideas Example
This is a line chart ppt powerpoint presentation ideas example. This is a two stage process. The stages in this process are sales in percentage, bar graph, business, marketing, growth.
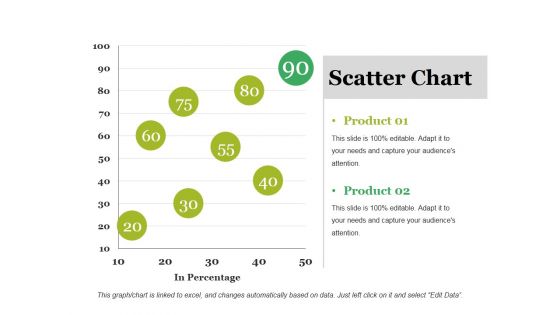
Scatter Chart Ppt PowerPoint Presentation Outline Ideas
This is a scatter chart ppt powerpoint presentation outline ideas. This is a two stage process. The stages in this process are product, scatter chart, business, in percentage, marketing.
Area Chart Ppt PowerPoint Presentation Icon Show
This is a area chart ppt powerpoint presentation icon show. This is a two stage process. The stages in this process are product, financial year, in percentage, area chart.
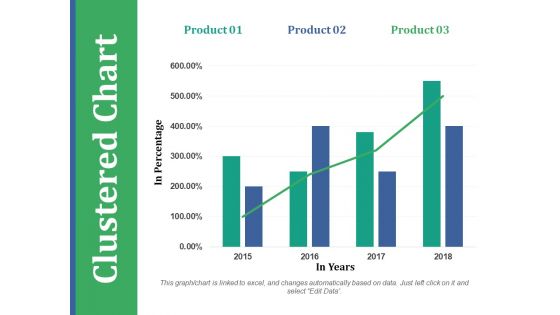
Clustered Chart Ppt PowerPoint Presentation Outline Templates
This is a clustered chart ppt powerpoint presentation outline templates. This is a three stage process. The stages in this process are product, in percentage, in years, clustered chart.
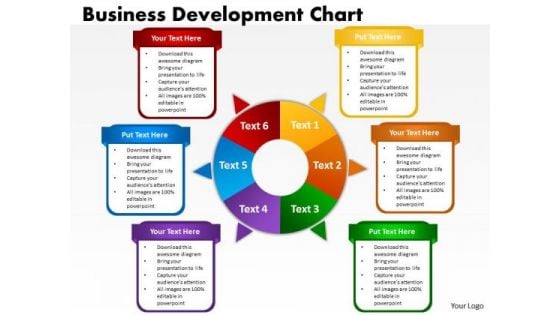
Consulting Diagram Business Development Chart Strategic Management
Document Your Views On Our Consulting Diagram Business Development Chart Strategic Management Powerpoint Templates. They Will Create A Strong Impression.
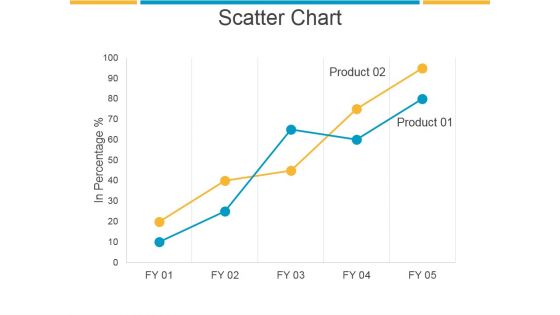
Scatter Chart Ppt PowerPoint Presentation Example File
This is a scatter chart ppt powerpoint presentation example file. This is a two stage process. The stages in this process are business, marketing, scatter chart, process, strategy.
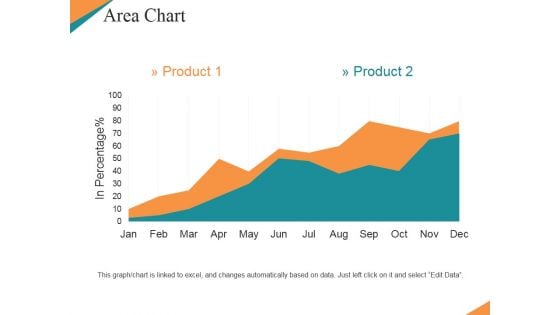
Area Chart Ppt PowerPoint Presentation Summary Templates
This is a area chart ppt powerpoint presentation summary templates. This is a two stage process. The stages in this process are product, in percentage, bar graph, growth, business.
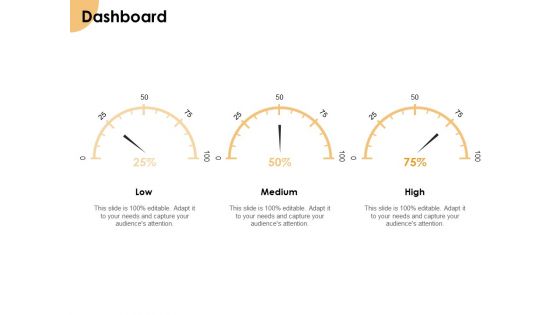
Growth Strategy And Growth Management Implementation Dashboard Ppt Outline Topics PDF
Presenting this set of slides with name growth strategy and growth management implementation dashboard ppt outline topics pdf. The topics discussed in these slide is dashboard. This is a completely editable PowerPoint presentation and is available for immediate download. Download now and impress your audience.
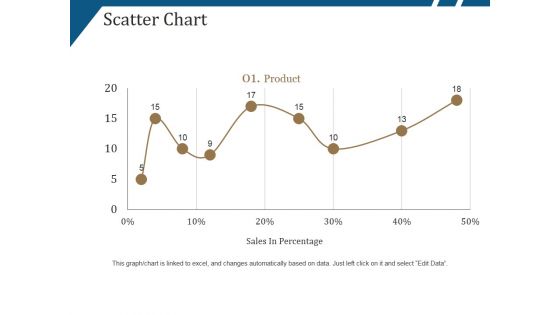
Scatter Chart Ppt PowerPoint Presentation Summary Deck
This is a scatter chart ppt powerpoint presentation summary deck. This is a nine stage process. The stages in this process are product, sales in percentage, growth, success.
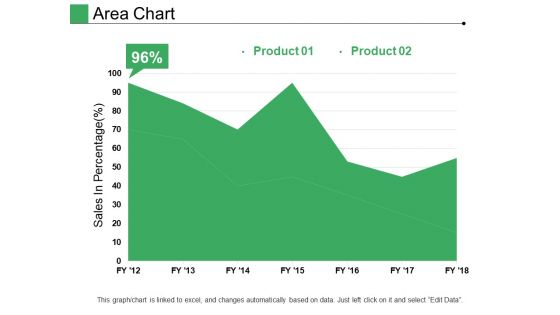
Area Chart Ppt PowerPoint Presentation Pictures Designs
This is a area chart ppt powerpoint presentation pictures designs. This is a two stage process. The stages in this process are product, sales in percentage, growth, success.
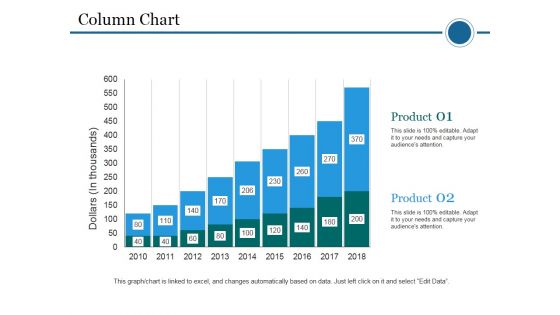
Column Chart Ppt PowerPoint Presentation Ideas Styles
This is a column chart ppt powerpoint presentation ideas styles. This is a two stage process. The stages in this process are dollars, product, planning, business, years.
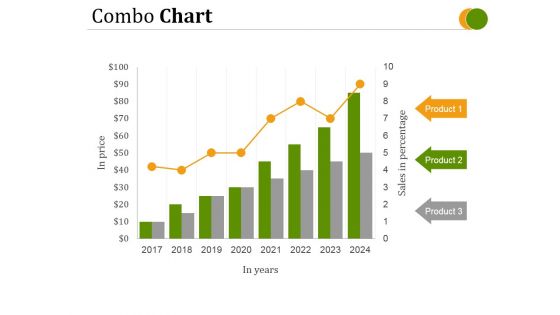
Combo Chart Ppt PowerPoint Presentation Deck
This is a combo chart ppt powerpoint presentation deck. This is a eight stage process. The stages in this process are in price, in years, product.
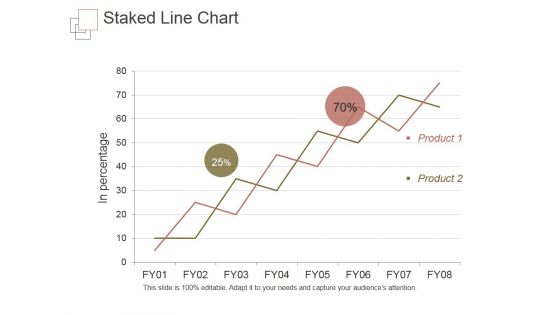
Staked Line Chart Ppt PowerPoint Presentation Topics
This is a staked line chart ppt powerpoint presentation topics. This is a two stage process. The stages in this process are in percentage, product.
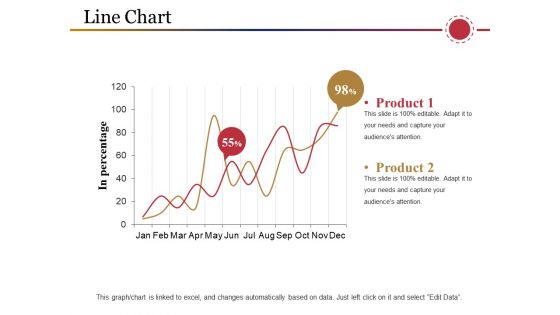
Line Chart Ppt PowerPoint Presentation Inspiration Samples
This is a line chart ppt powerpoint presentation inspiration samples. This is a two stage process. The stages in this process are product, in percentage, business, marketing, graph.


 Continue with Email

 Home
Home


