Growth Chart
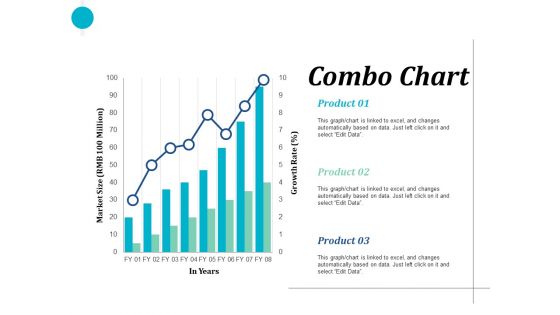
Combo Chart Finance Ppt PowerPoint Presentation Clipart
This is a combo chart finance ppt powerpoint presentation pictures show. This is a two stage process. The stages in this process are finance, marketing, management, investment, analysis.
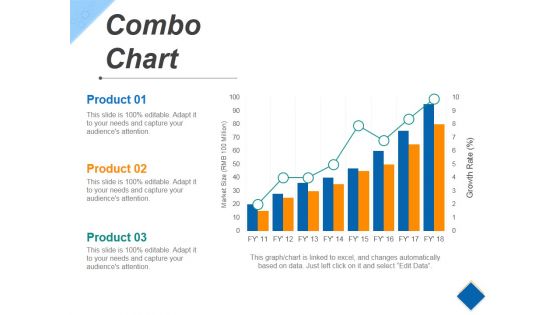
Combo Chart Ppt PowerPoint Presentation Diagram Images
This is a combo chart ppt powerpoint presentation diagram images. This is a eight stage process. The stages in this process are growth, success, business, marketing, product.
Scatter Chart Ppt PowerPoint Presentation Icon Visuals
This is a scatter chart ppt powerpoint presentation icon visuals. This is a nine stage process. The stages in this process are business, growth, finance, success, marketing.
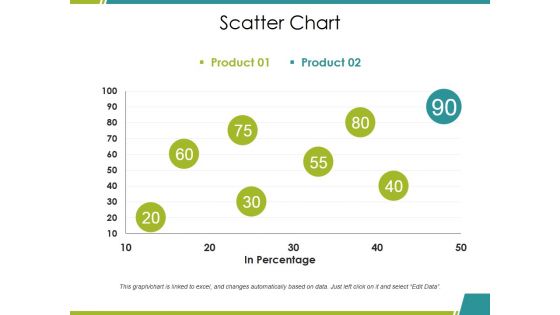
Scatter Chart Ppt PowerPoint Presentation Summary Inspiration
This is a scatter chart ppt powerpoint presentation summary inspiration. This is a two stage process. The stages in this process are product, in percentage, growth, success, business.
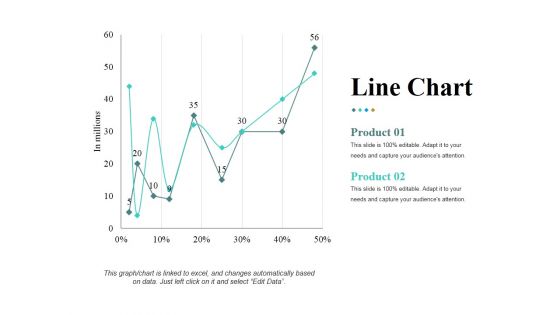
Line Chart Ppt PowerPoint Presentation Pictures Ideas
This is a line chart ppt powerpoint presentation pictures ideas. This is a two stage process. The stages in this process are in millions, percentage, finance, product, growth.
Scatter Chart Ppt PowerPoint Presentation Icon
This is a scatter chart ppt powerpoint presentation icon. This is a two stage process. The stages in this process are product, growth, business, marketing.
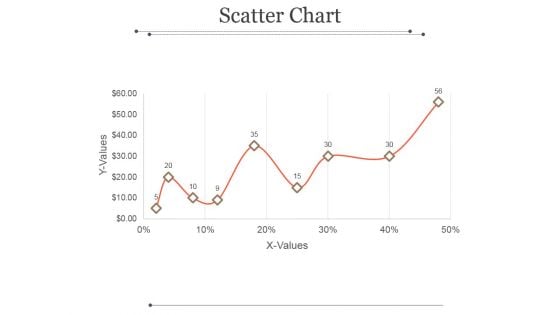
Scatter Chart Ppt PowerPoint Presentation Example
This is a scatter chart ppt powerpoint presentation example. This is a nine stage process. The stages in this process are x values, y values, business, growth, success.
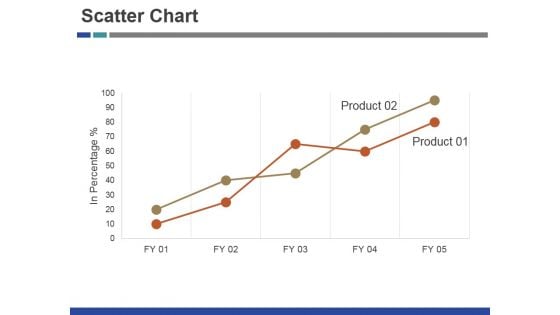
Scatter Chart Ppt PowerPoint Presentation Inspiration Brochure
This is a scatter chart ppt powerpoint presentation inspiration brochure. This is a two stage process. The stages in this process are product, growth, success, business.
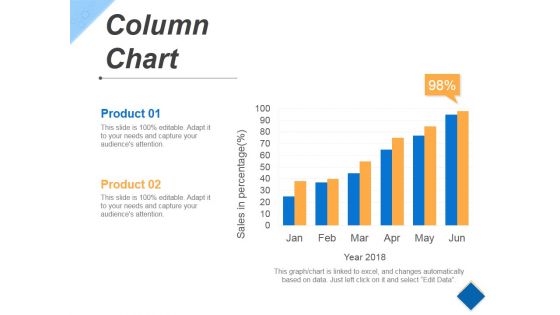
Column Chart Ppt PowerPoint Presentation Styles Vector
This is a column chart ppt powerpoint presentation styles vector. This is a six stage process. The stages in this process are growth, success, business, marketing, product.
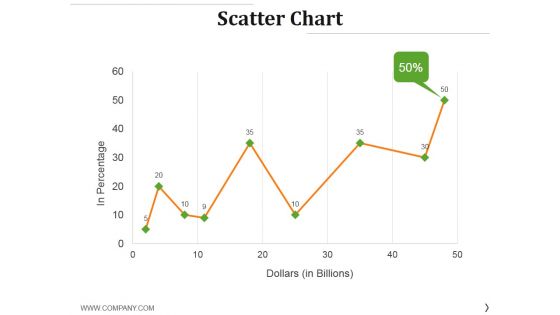
Scatter Chart Ppt PowerPoint Presentation Layouts Gridlines
This is a scatter chart ppt powerpoint presentation layouts gridlines. This is a nine stage process. The stages in this process are in percentage, dollars, growth, success, finance.

Line Chart Ppt PowerPoint Presentation Pictures Maker
This is a line chart ppt powerpoint presentation pictures maker. This is a two stage process. The stages in this process are financial years, product, growth, success.
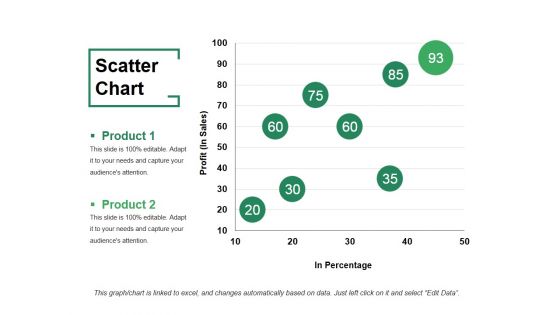
Scatter Chart Ppt PowerPoint Presentation File Visuals
This is a scatter chart ppt powerpoint presentation file visuals. This is a two stage process. The stages in this process are product, profit, in percentage, growth, success.
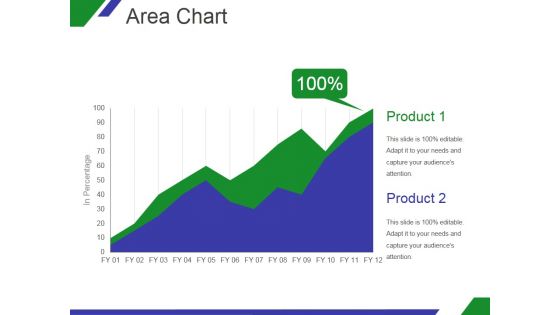
Area Chart Ppt PowerPoint Presentation Designs
This is a area chart ppt powerpoint presentation designs. This is a two stage process. The stages in this process are product, graph, in percentage, growth, business.
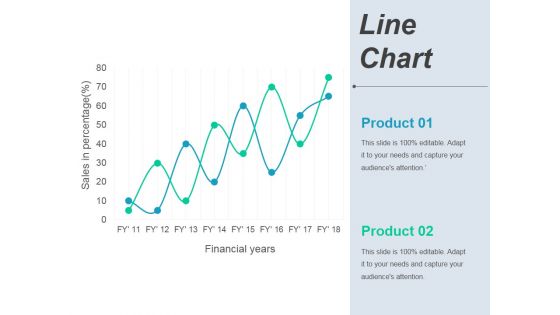
Line Chart Ppt PowerPoint Presentation Ideas Deck
This is a line chart ppt powerpoint presentation ideas deck. This is a two stage process. The stages in this process are business, marketing, finance, growth.
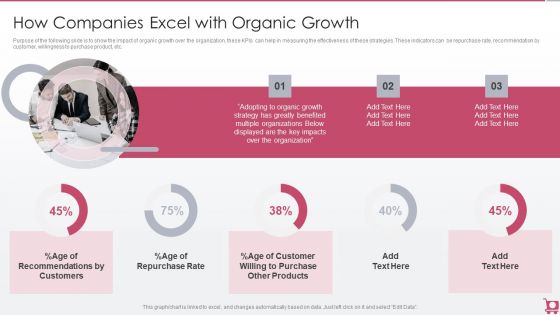
Playbook For Sales Growth Strategies How Companies Excel With Organic Growth Download PDF
Purpose of the following slide is to show the impact of organic growth over the organization, these KPIs can help in measuring the effectiveness of these strategies. These indicators can be repurchase rate, recommendation by customer, willingness to purchase product, etc. Deliver and pitch your topic in the best possible manner with this Playbook For Sales Growth Strategies How Companies Excel With Organic Growth Download PDF. Use them to share invaluable insights on Customers, Purchase Other Products, Organization and impress your audience. This template can be altered and modified as per your expectations. So, grab it now.
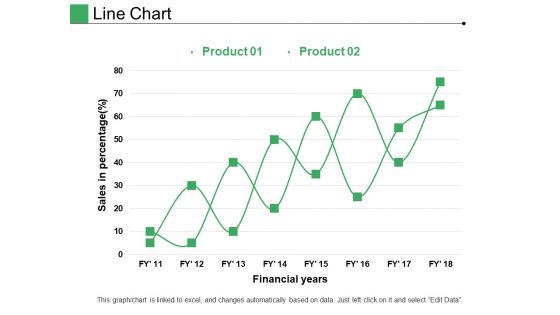
Line Chart Ppt PowerPoint Presentation Pictures Layout
This is a line chart ppt powerpoint presentation pictures layout. This is a two stage process. The stages in this process are product, financial years, sales in percentage.
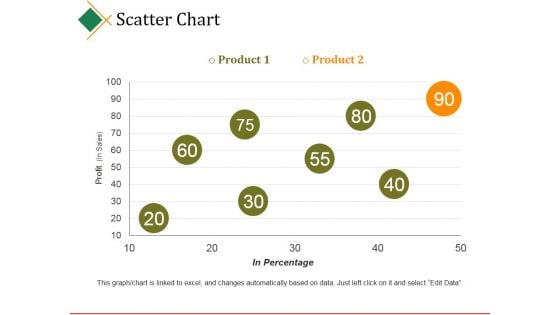
Scatter Chart Ppt PowerPoint Presentation Model
This is a scatter chart ppt powerpoint presentation model. This is a two stage process. The stages in this process are business, product, profit, in percentage, business.
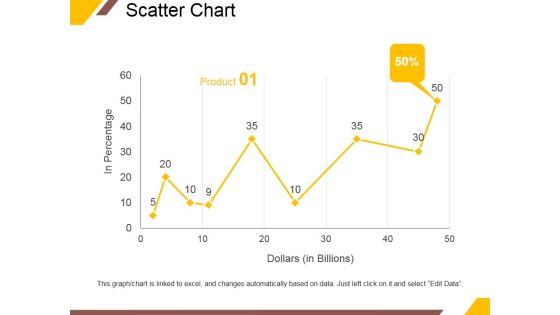
Scatter Chart Ppt PowerPoint Presentation Gallery Vector
This is a scatter chart ppt powerpoint presentation gallery vector. This is a nine stage process. The stages in this process are in percentage, dollars, product, percentage, finance.
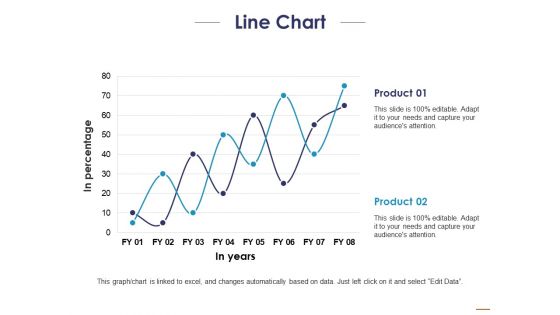
Line Chart Ppt PowerPoint Presentation Layouts Templates
This is a line chart ppt powerpoint presentation layouts templates. This is a two stage process. The stages in this process are product, in percentage, in years.
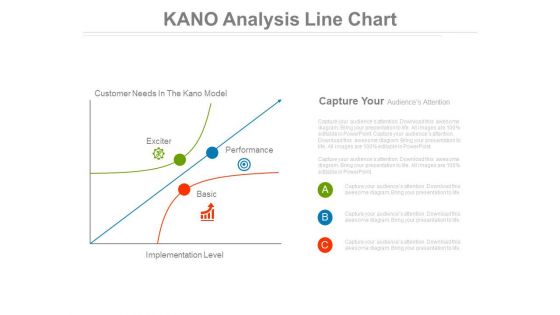
Kano Analysis Line Chart Ppt Slides
This is a kano analysis line chart ppt slides. This is a three stage process. The stages in this process are marketing, business.\n\n
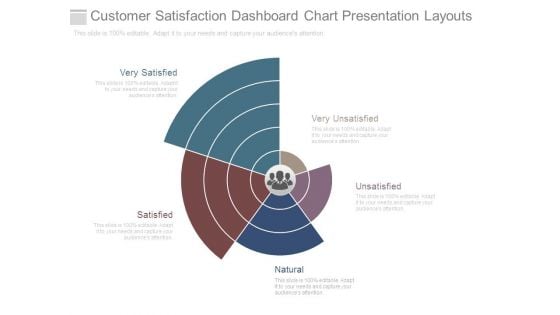
Customer Satisfaction Dashboard Chart Presentation Layouts
This is a customer satisfaction dashboard chart presentation layouts. This is a five stage process. The stages in this process are very satisfied, satisfied, unsatisfied, natural, very unsatisfied.
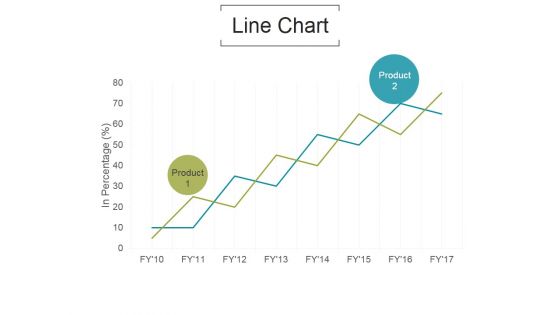
Line Chart Ppt PowerPoint Presentation Model
This is a line chart ppt powerpoint presentation model. This is a two stage process. The stages in this process are in percentage, product, business.
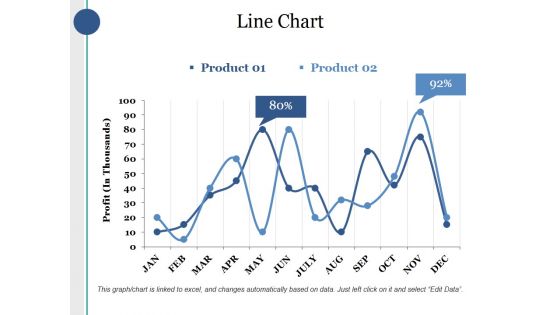
Line Chart Ppt PowerPoint Presentation Layouts Sample
This is a line chart ppt powerpoint presentation layouts sample. This is a two stage process. The stages in this process are product, profit, percentage, finance, business.
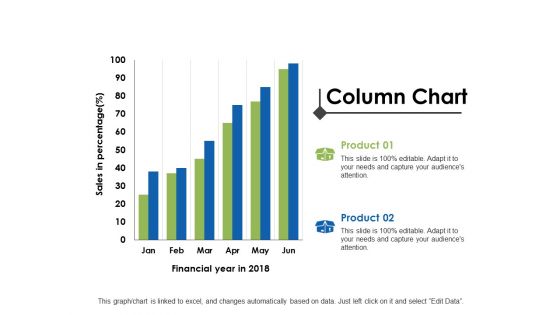
Column Chart Ppt PowerPoint Presentation Layouts Rules
This is a column chart ppt powerpoint presentation layouts rules. This is a two stage process. The stages in this process are analysis, finance, marketing, management, investment.
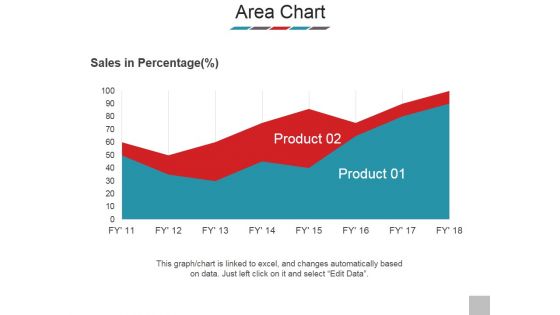
Area Chart Ppt PowerPoint Presentation Styles Images
This is a area chart ppt powerpoint presentation styles images. This is a two stage process. The stages in this process are sales in percentage, product, graph, business, marketing.
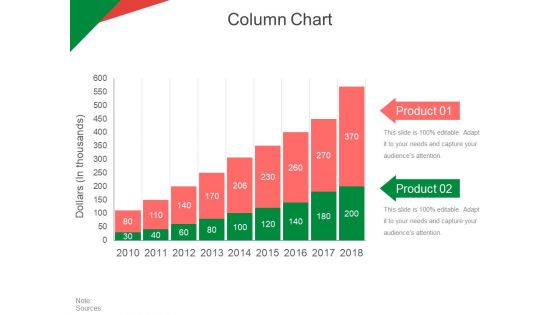
Column Chart Ppt PowerPoint Presentation Gallery Topics
This is a column chart ppt powerpoint presentation gallery topics. This is a two stage process. The stages in this process are dollars in thousands, product, business, marketing, strategy.
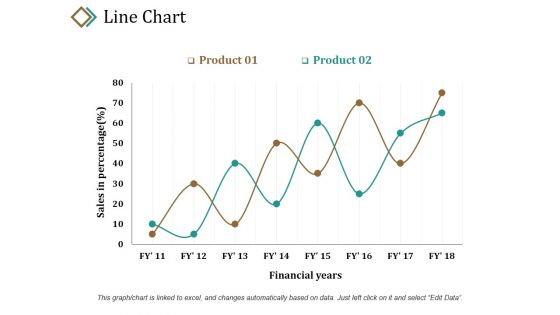
Line Chart Ppt PowerPoint Presentation Layouts Example
This is a line chart ppt powerpoint presentation layouts example. This is a two stage process. The stages in this process are sales in percentage, product, financial years, growth, success.

Line Chart Ppt PowerPoint Presentation Show Guide
This is a line chart ppt powerpoint presentation show guide. This is a two stage process. The stages in this process are product, sales in percentage, financial years, growth, success.

Scatter Chart Ppt PowerPoint Presentation Model Template
This is a scatter chart ppt powerpoint presentation model template. This is a nine stage process. The stages in this process are x values, y values, graph, growth, success.
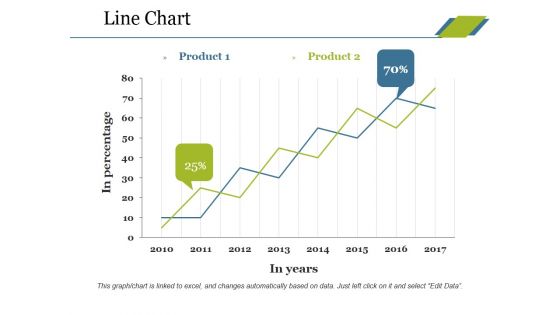
Line Chart Ppt PowerPoint Presentation Professional Tips
This is a line chart ppt powerpoint presentation professional tips. This is a two stage process. The stages in this process are product, in percentage, in years, growth, success.
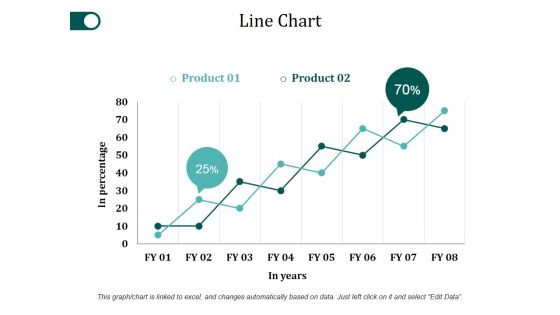
Line Chart Ppt PowerPoint Presentation Slides Ideas
This is a line chart ppt powerpoint presentation slides ideas. This is a two stage process. The stages in this process are product, in percentage, in years, growth, success.
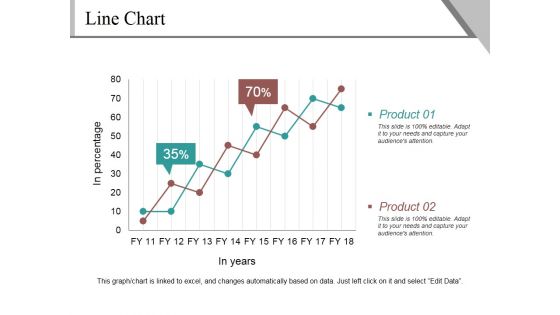
Line Chart Ppt PowerPoint Presentation Infographics Example
This is a line chart ppt powerpoint presentation infographics example. This is a two stage process. The stages in this process are product, in percentage, in years, finance, growth.
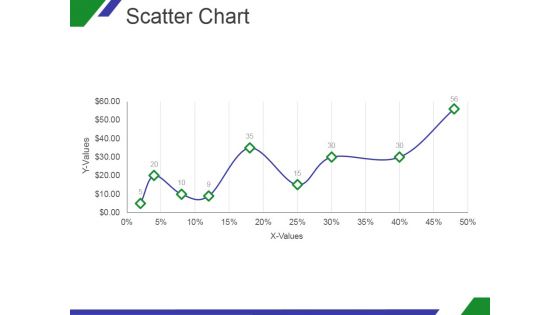
Scatter Chart Ppt PowerPoint Presentation Designs Download
This is a scatter chart ppt powerpoint presentation designs download. This is a nine stage process. The stages in this process are x values, y values, graph, growth, success.
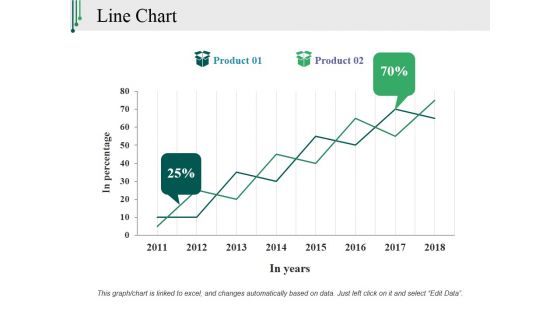
Line Chart Ppt PowerPoint Presentation Slides Mockup
This is a line chart ppt powerpoint presentation slides mockup. This is a two stage process. The stages in this process are in percentage, in years, product, growth, success.
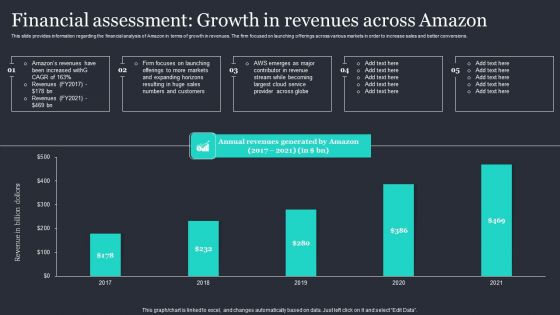
Amazon Strategic Growth Initiative On Global Scale Financial Assessment Growth In Revenues Rules PDF
This slide provides information regarding the financial analysis of Amazon in terms of growth in revenues. The firm focused on launching offerings across various markets in order to increase sales and better conversions. Slidegeeks is one of the best resources for PowerPoint templates. You can download easily and regulate Amazon Strategic Growth Initiative On Global Scale Financial Assessment Growth In Revenues Rules PDF for your personal presentations from our wonderful collection. A few clicks is all it takes to discover and get the most relevant and appropriate templates. Use our Templates to add a unique zing and appeal to your presentation and meetings. All the slides are easy to edit and you can use them even for advertisement purposes.
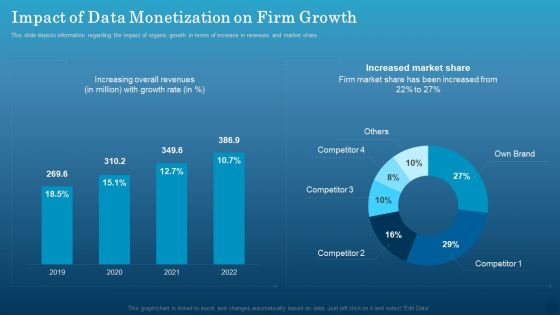
Data Monetization Approach To Drive Business Growth Impact Of Data Monetization On Firm Growth Sample PDF
This slide depicts information regarding the impact of organic growth in terms of increase in revenues and market share. Are you in need of a template that can accommodate all of your creative concepts. This one is crafted professionally and can be altered to fit any style. Use it with Google Slides or PowerPoint. Include striking photographs, symbols, depictions, and other visuals. Fill, move around, or remove text boxes as desired. Test out color palettes and font mixtures. Edit and save your work, or work with colleagues. Download Data Monetization Approach To Drive Business Growth Impact Of Data Monetization On Firm Growth Sample PDF and observe how to make your presentation outstanding. Give an impeccable presentation to your group and make your presentation unforgettable.
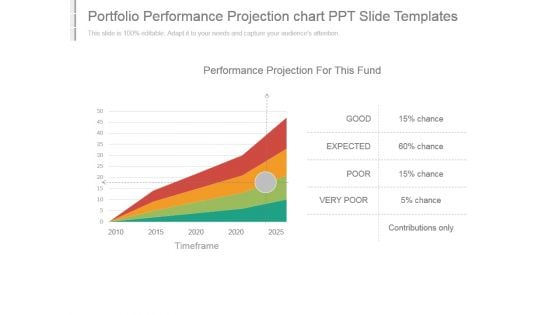
Portfolio Performance Projection Chart Ppt Slide Templates
This is a portfolio performance projection chart ppt slide templates. This is a four stage process. The stages in this process are performance projection for this fund, good, expected, poor, very poor, contributions only, timeframe.
Area Chart Ppt PowerPoint Presentation Icon Good
This is a area chart ppt powerpoint presentation icon good. This is a two stage process. The stages in this process are business, marketing, growth, planning, strategy.
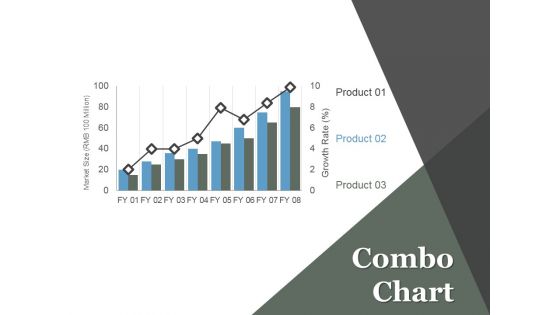
Combo Chart Ppt PowerPoint Presentation Visual Aids
This is a combo chart ppt powerpoint presentation visual aids. This is a eight stage process. The stages in this process are business, growth, strategy, planning, management.
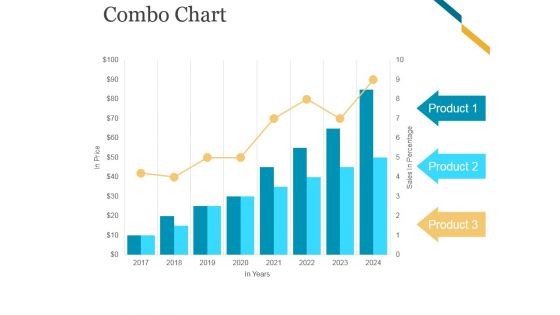
Combo Chart Ppt PowerPoint Presentation Files
This is a combo chart ppt powerpoint presentation files. This is a eight stage process. The stages in this process are business, marketing, growth, timeline, graph.
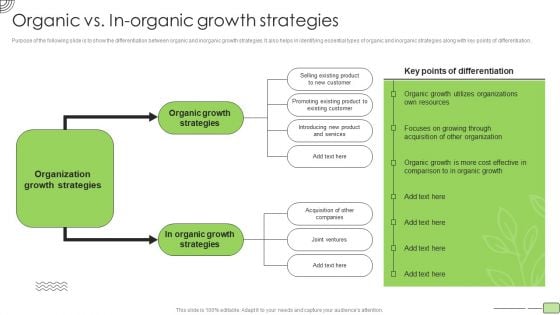
Organic Business Growth Strategies Organic Vs In Organic Growth Strategies Sample PDF
Purpose of the following slide is to show the differentiation between organic and inorganic growth strategies. It also helps in identifying essential types of organic and inorganic strategies along with key points of differentiation. Presenting Organic Business Growth Strategies Organic Vs In Organic Growth Strategies Sample PDF to provide visual cues and insights. Share and navigate important information on two stages that need your due attention. This template can be used to pitch topics like Organization Growth Strategies, Cost, Resources. In addtion, this PPT design contains high resolution images, graphics, etc, that are easily editable and available for immediate download.
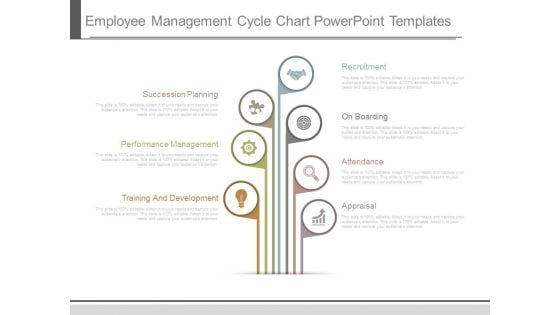
Employee Management Cycle Chart Powerpoint Templates
This is a employee management cycle chart powerpoint templates. This is a seven stage process. The stages in this process are succession planning, performance management, training and development, recruitment, on boarding, attendance, appraisal.
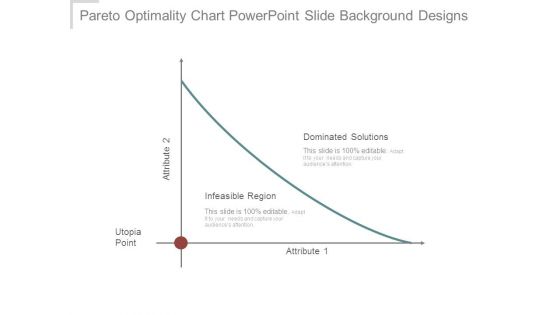
Pareto Optimality Chart Powerpoint Slide Background Designs
This is a pareto optimality chart powerpoint slide background designs. This is a one stage process. The stages in this process are dominated solutions, infeasible region, utopia point, attribute.
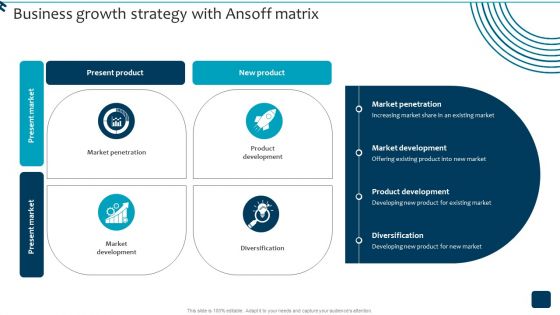
Strategic Brand Growth Plan For Market Leadership Business Growth Strategy With Ansoff Matrix Rules PDF
There are so many reasons you need a Strategic Brand Growth Plan For Market Leadership Business Growth Strategy With Ansoff Matrix Rules PDF. The first reason is you can not spend time making everything from scratch, Thus, Slidegeeks has made presentation templates for you too. You can easily download these templates from our website easily.
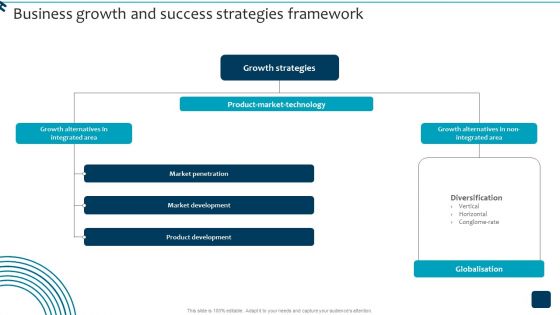
Strategic Brand Growth Plan For Market Leadership Business Growth And Success Strategies Diagrams PDF
Take your projects to the next level with our ultimate collection of Strategic Brand Growth Plan For Market Leadership Business Growth And Success Strategies Diagrams PDF. Slidegeeks has designed a range of layouts that are perfect for representing task or activity duration, keeping track of all your deadlines at a glance. Tailor these designs to your exact needs and give them a truly corporate look with your own brand colors they will make your projects stand out from the rest.
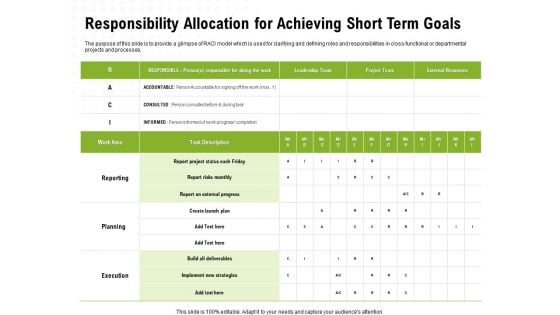
Strategic Growth Technique Responsibility Allocation For Achieving Short Term Goals Ppt Diagram Graph Charts PDF
Presenting this set of slides with name strategic growth technique responsibility allocation for achieving short term goals ppt diagram graph charts pdf. The topics discussed in these slides are implement, strategies, leadership team, external resources. This is a completely editable PowerPoint presentation and is available for immediate download. Download now and impress your audience.
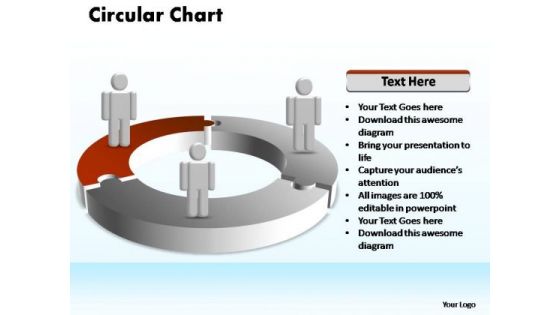
PowerPoint Process Chart Circular Ppt Themes
PowerPoint Process Chart Circular PPT Themes-Puzzles PowerPoint templates being the perennial educational tool. Emphasize the process of your business/corporate growth. Highlight your ideas broad- based on strong fundamentals and illustrate how they step by step achieve the set growth factor. Be superman with our PowerPoint Process Chart Circular Ppt Themes. You will come out on top.
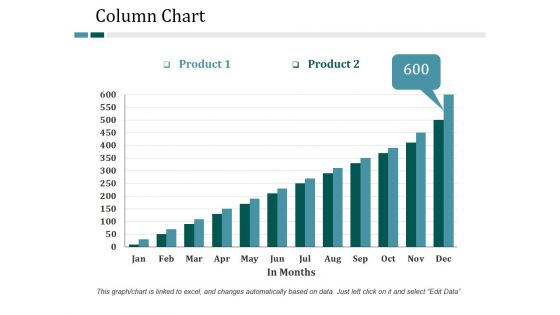
Column Chart Ppt PowerPoint Presentation File Show
This is a column chart ppt powerpoint presentation file show. This is a two stage process. The stages in this process are column chart, finance, marketing, growth, strategy, business.
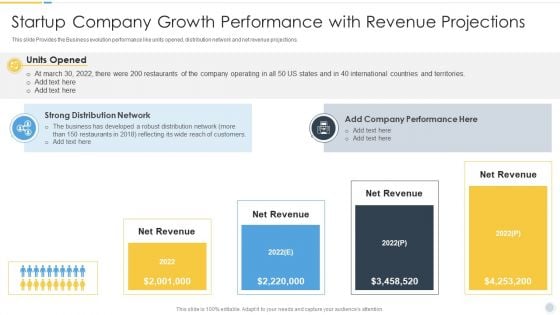
Growth Strategy For Startup Company Startup Company Growth Performance With Revenue Ideas PDF
This slide Provides the Business evolution performance like units opened, distribution network and net revenue projections. This is a Growth Strategy For Startup Company Startup Company Growth Performance With Revenue Ideas PDF template with various stages. Focus and dispense information on four stages using this creative set, that comes with editable features. It contains large content boxes to add your information on topics like Net Revenue, Performance, Strong Distribution Network, 2022. You can also showcase facts, figures, and other relevant content using this PPT layout. Grab it now.

Bar Graph Growth Success PowerPoint Templates And PowerPoint Themes 0712
Bar Graph Gowth Success PowerPoint Templates And PowerPoint Themes 0712-Microsoft Powerpoint Templates and Background with bar chart growth Go get 'em with our Bar Graph Growth Success PowerPoint Templates And PowerPoint Themes 0712.Be sure there will be no false bravado.
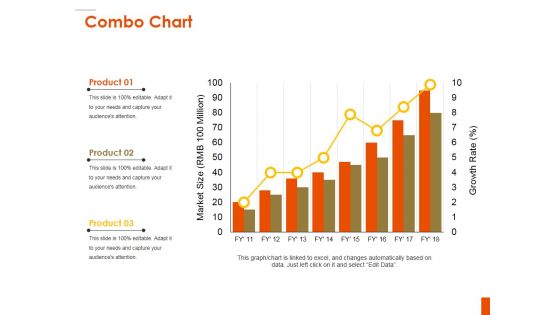
Combo Chart Ppt PowerPoint Presentation Inspiration Background
This is a combo chart ppt powerpoint presentation inspiration background. This is a three stage process. The stages in this process are product, bar graph, market size, growth, growth rate.
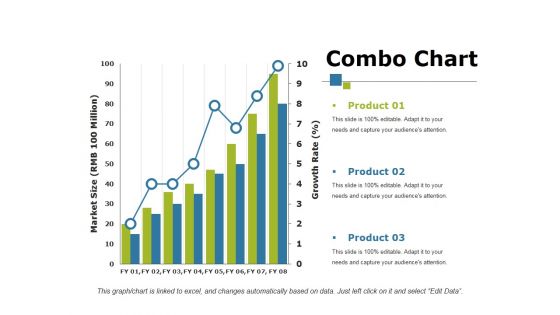
Combo Chart Ppt PowerPoint Presentation Show Influencers
This is a combo chart ppt powerpoint presentation show influencers. This is a three stage process. The stages in this process are product, bar graph, growth, growth rate, market size.
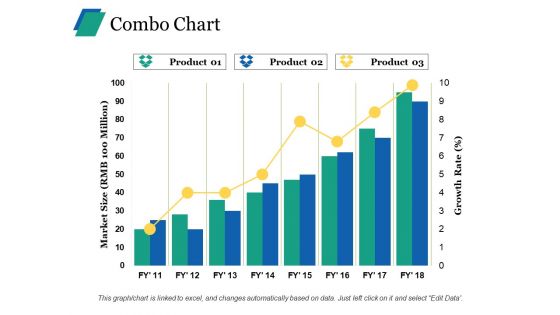
Combo Chart Ppt PowerPoint Presentation File Formats
This is a combo chart ppt powerpoint presentation file formats. This is a three stage process. The stages in this process are product, growth rate, market size.
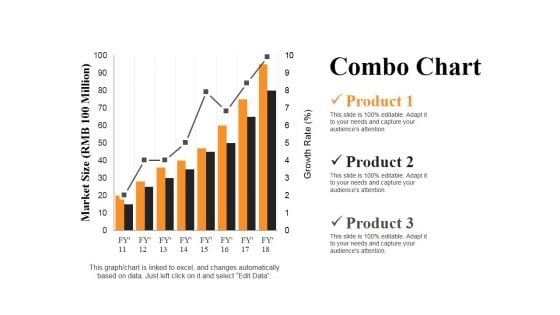
Combo Chart Ppt PowerPoint Presentation Summary Slides
This is a combo chart ppt powerpoint presentation summary slides. This is a three stage process. The stages in this process are market size, product, growth rate, bar graph, success.
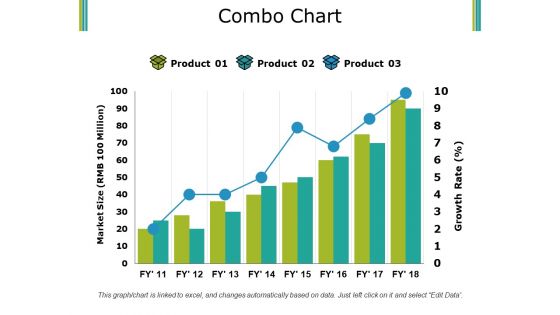
Combo Chart Ppt PowerPoint Presentation Pictures Summary
This is a combo chart ppt powerpoint presentation pictures summary. This is a three stage process. The stages in this process are product, market size, growth rate, bar graph, success.
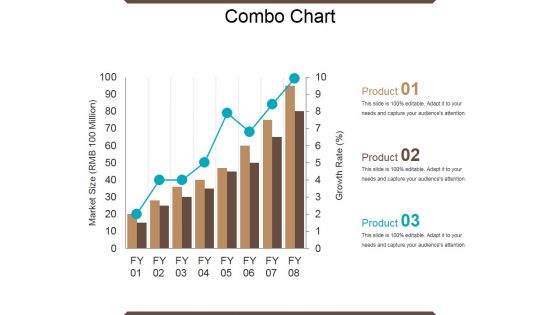
Combo Chart Ppt PowerPoint Presentation Outline Model
This is a combo chart ppt powerpoint presentation outline model. This is a eight stage process. The stages in this process are market size, growth rate, growth, success, graph.
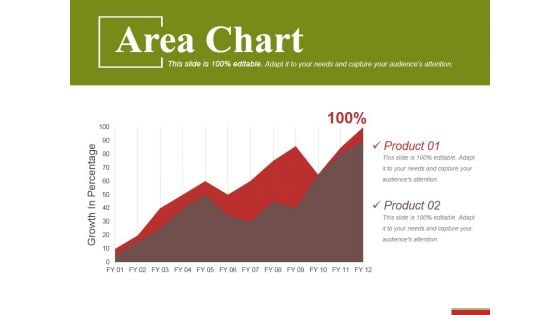
Area Chart Ppt PowerPoint Presentation Gallery Brochure
This is a area chart ppt powerpoint presentation gallery brochure. This is a two stage process. The stages in this process are product, growth in percentage, success, business.
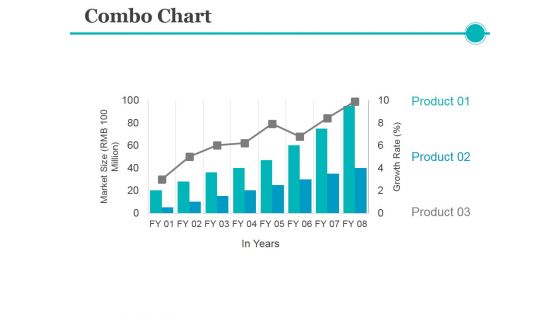
Combo Chart Ppt PowerPoint Presentation Pictures Layouts
This is a combo chart ppt powerpoint presentation pictures layouts. This is a eight stage process. The stages in this process are product, growth rate, market size, years.
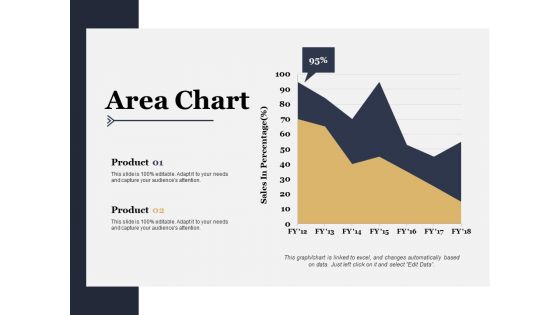
Area Chart Ppt PowerPoint Presentation Styles Professional
This is a area chart ppt powerpoint presentation styles professional. This is a two stage process. The stages in this process are sales in percentage, product, area chart.
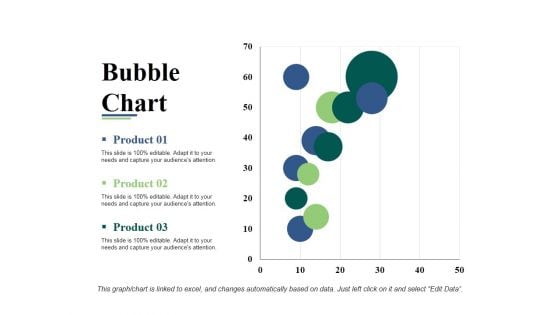
Bubble Chart Ppt PowerPoint Presentation Model Gallery
This is a bubble chart ppt powerpoint presentation model gallery. This is a three stage process. The stages in this process are product, bubble chart, business, marketing, graph.


 Continue with Email

 Home
Home


