Growth Chart
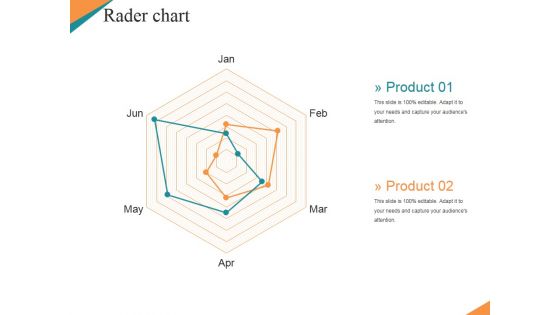
Rader Chart Ppt PowerPoint Presentation Summary Images
This is a rader chart ppt powerpoint presentation summary images. This is a two stage process. The stages in this process are radar chart, management, strategy, marketing, business.
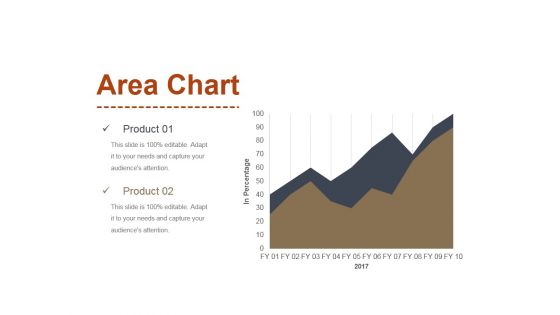
Area Chart Ppt PowerPoint Presentation Inspiration Slides
This is a area chart ppt powerpoint presentation inspiration slides. This is a two stage process. The stages in this process are area chart, product, in percentage.
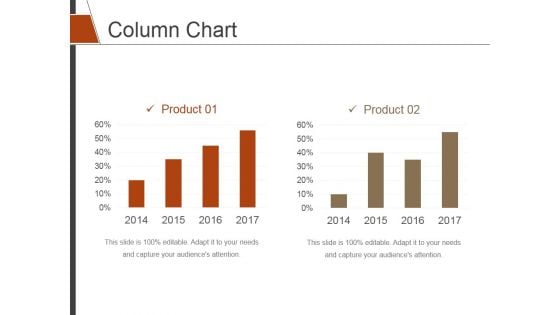
Column Chart Ppt PowerPoint Presentation Infographics Display
This is a column chart ppt powerpoint presentation infographics display. This is a two stage process. The stages in this process are column chart, finance, marketing, strategy, analysis.

Combo Chart Ppt PowerPoint Presentation Professional Infographics
This is a combo chart ppt powerpoint presentation professional infographics. This is a three stage process. The stages in this process are combo chart, market size, product.
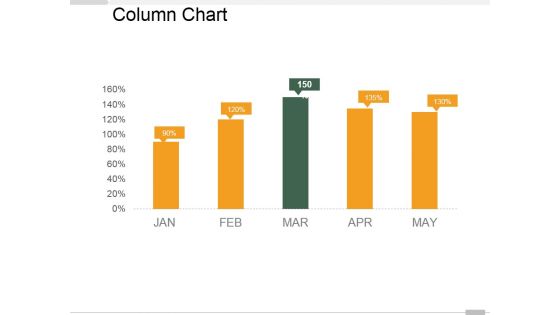
Column Chart Ppt PowerPoint Presentation Summary Samples
This is a column chart ppt powerpoint presentation summary samples. This is a five stage process. The stages in this process are column chart, finance, marketing, strategy, business.
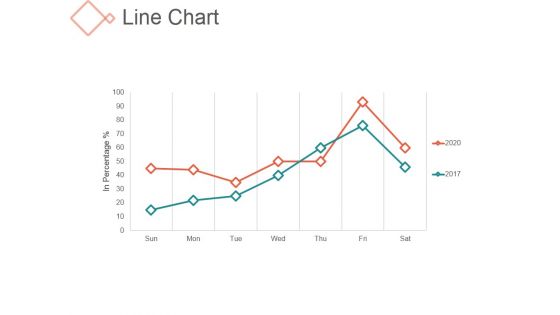
Line Chart Ppt PowerPoint Presentation Show
This is a line chart ppt powerpoint presentation show. This is a seven stage process. The stages in this process are sun, mon, tue, wed.
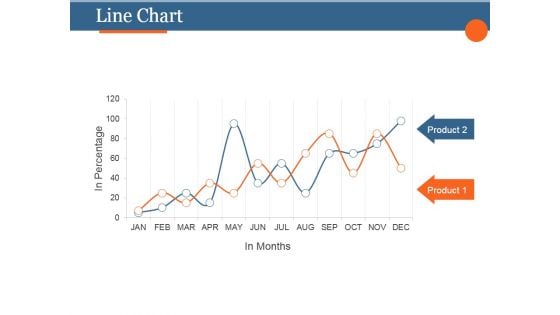
Line Chart Ppt PowerPoint Presentation Background Image
This is a line chart ppt powerpoint presentation background image. This is a two stage process. The stages in this process are product, planning, strategy, marketing, management.
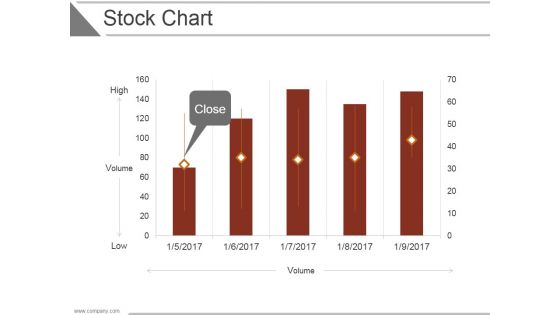
Stock Chart Ppt PowerPoint Presentation Introduction
This is a stock chart ppt powerpoint presentation introduction. This is a five stage process. The stages in this process are planning, strategy, business, marketing, management.
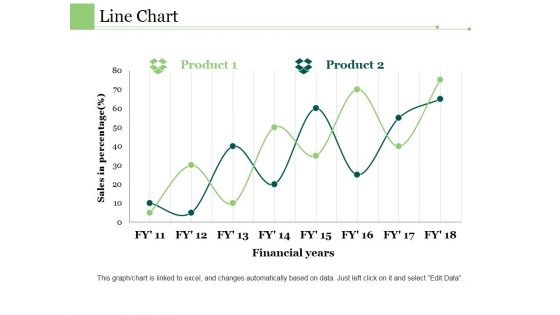
Line Chart Ppt PowerPoint Presentation Inspiration Smartart
This is a line chart ppt powerpoint presentation inspiration smartart. This is a two stage process. The stages in this process are business, marketing, strategy, planning, finance.
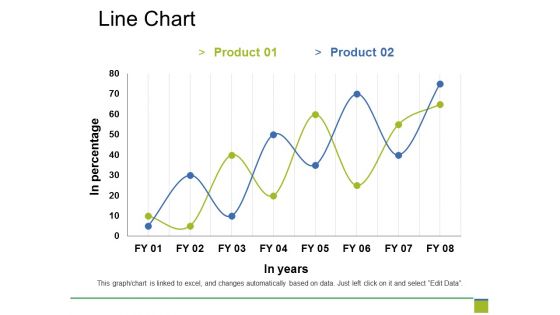
Line Chart Ppt PowerPoint Presentation Slides Inspiration
This is a line chart ppt powerpoint presentation slides inspiration. This is a two stage process. The stages in this process are business, marketing, strategy, planning, finance.
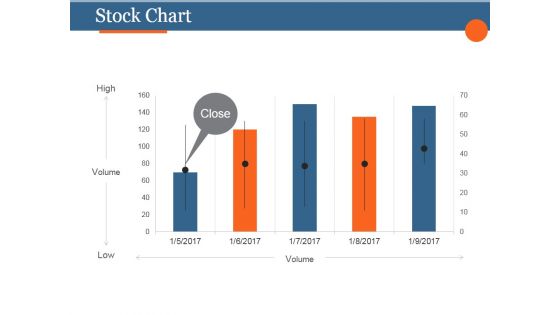
Stock Chart Ppt PowerPoint Presentation Clipart
This is a stock chart ppt powerpoint presentation clipart. This is a five stage process. The stages in this process are high, volume, low, close.
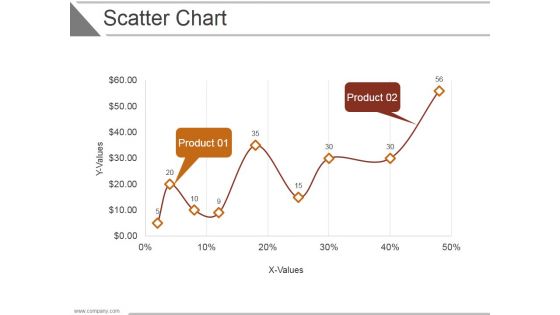
Scatter Chart Ppt PowerPoint Presentation Backgrounds
This is a scatter chart ppt powerpoint presentation backgrounds. This is a two stage process. The stages in this process are product, strategy, business, marketing, management.
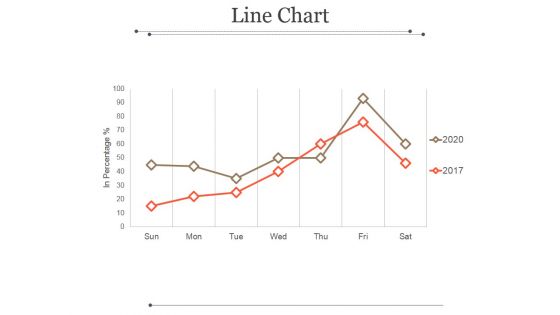
Line Chart Ppt PowerPoint Presentation Ideas
This is a line chart ppt powerpoint presentation ideas. This is a two stage process. The stages in this process are marketing, in percentage, sun, mon, tue, wed.
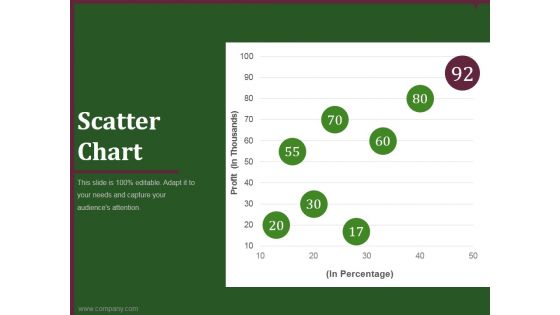
Scatter Chart Ppt PowerPoint Presentation Outline
This is a scatter chart ppt powerpoint presentation outline. This is a five stage process. The stages in this process are business, marketing, graph, percentage, finance.

Column Chart Ppt PowerPoint Presentation Model Visuals
This is a column chart ppt powerpoint presentation model visuals. This is a two stage process. The stages in this process are product, year, graph, business, finance.
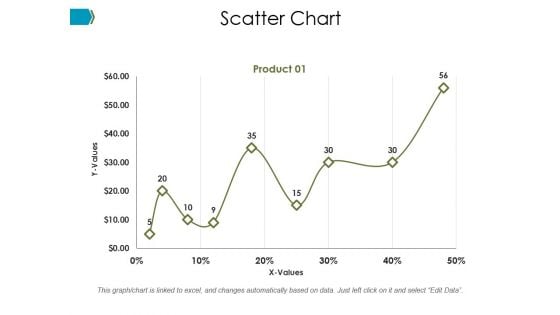
Scatter Chart Ppt PowerPoint Presentation Styles Background
This is a scatter chart ppt powerpoint presentation styles background. This is a one stage process. The stages in this process are business, marketing, strategy, finance, graph.
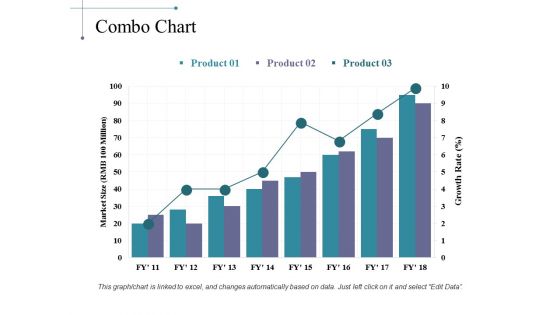
Combo Chart Ppt PowerPoint Presentation Ideas Visuals
This is a combo chart ppt powerpoint presentation ideas visuals. This is a three stage process. The stages in this process are business, marketing, strategy, finance, analysis.
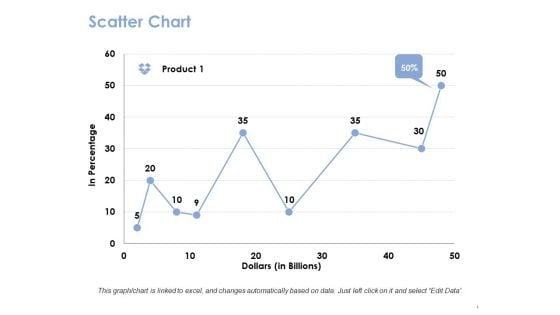
Scatter Chart Ppt PowerPoint Presentation Show Sample
This is a scatter chart ppt powerpoint presentation show sample. This is a one stage process. The stages in this process are product, dollar, in percentage.
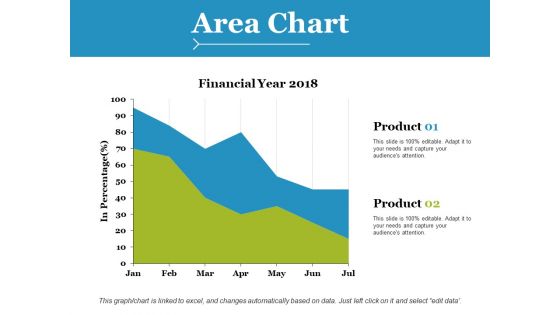
Area Chart Ppt PowerPoint Presentation Styles Brochure
This is a area chart ppt powerpoint presentation styles brochure. This is a two stage process. The stages in this process are product, financial years, in percentage.
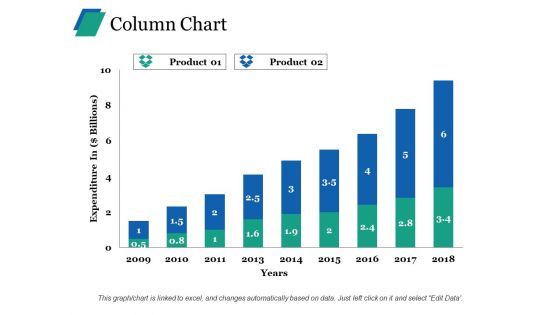
Column Chart Ppt PowerPoint Presentation Ideas Clipart
This is a column chart ppt powerpoint presentation ideas clipart. This is a two stage process. The stages in this process are product, expenditure in, years.
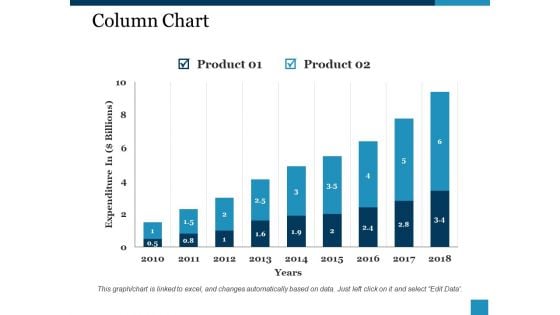
Column Chart Ppt PowerPoint Presentation Show Slideshow
This is a column chart ppt powerpoint presentation show slideshow. This is a two stage process. The stages in this process are product, expenditure, years.
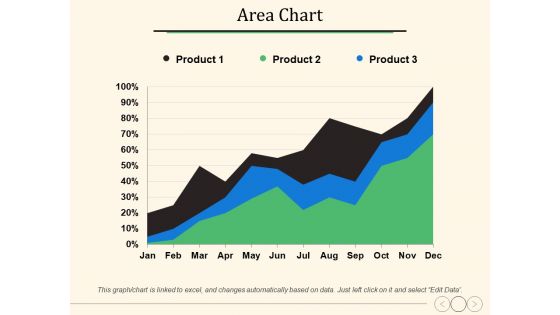
Area Chart Ppt PowerPoint Presentation Show Graphics
This is a area chart ppt powerpoint presentation show graphics. This is a three stage process. The stages in this process are percentage, product, marketing, management, business.
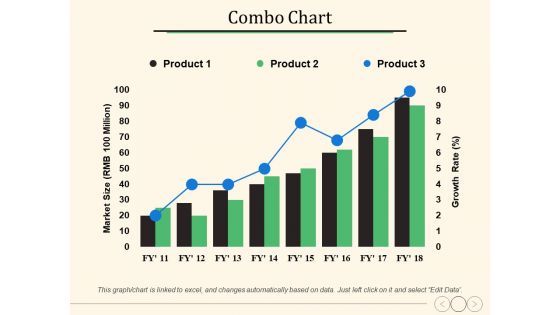
Combo Chart Ppt PowerPoint Presentation Slides Slideshow
This is a combo chart ppt powerpoint presentation slides slideshow. This is a three stage process. The stages in this process are percentage, product, marketing, management, business.
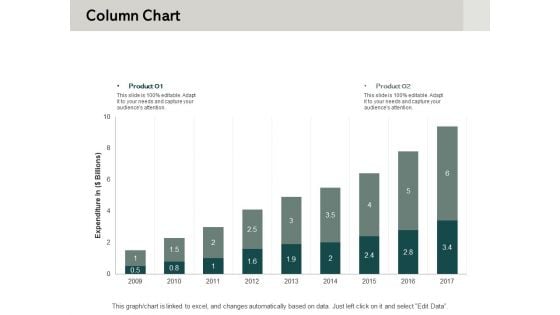
Column Chart Ppt PowerPoint Presentation Show Objects
This is a column chart ppt powerpoint presentation show objects. This is a two stage process. The stages in this process are percentage, product, business, management, marketing.
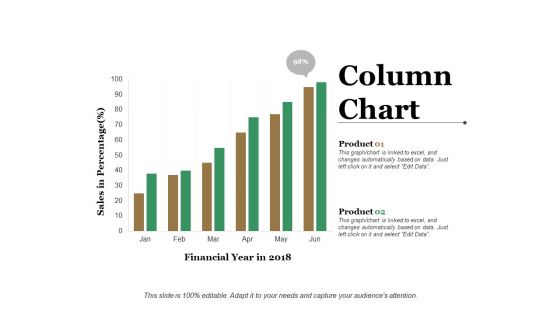
Column Chart Ppt PowerPoint Presentation Model Slideshow
This is a column chart ppt powerpoint presentation model slideshow. This is a two stage process. The stages in this process are percentage, product, business, marketing.
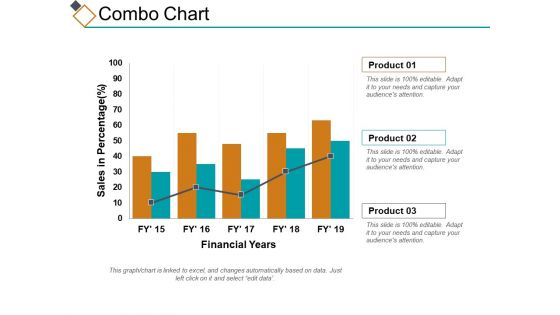
Combo Chart Ppt PowerPoint Presentation Styles Topics
This is a combo chart ppt powerpoint presentation styles topics. This is a three stage process. The stages in this process are percentage, product, business, management, marketing.
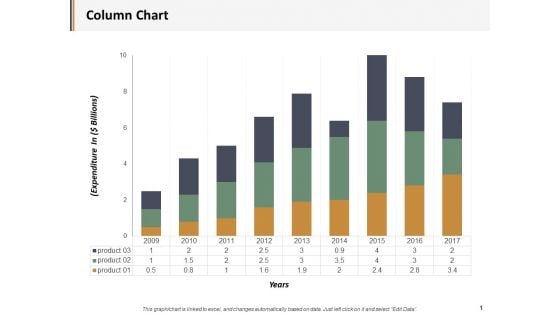
Column Chart Financial Ppt PowerPoint Presentation Information
This is a column chart financial ppt powerpoint presentation information. This is a three stage process. The stages in this process are business, management, marketing, percentage, product.
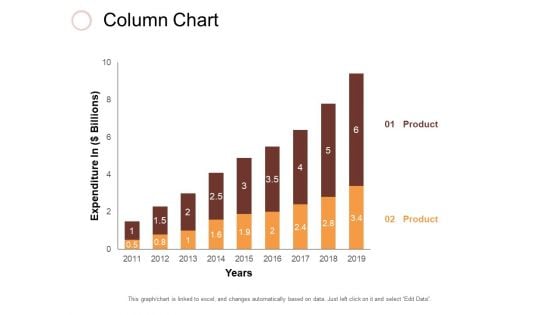
Column Chart Ppt PowerPoint Presentation Slides Clipart
This is a column chart ppt powerpoint presentation slides clipart. This is a two stage process. The stages in this process are business, management, marketing, percentage, product.
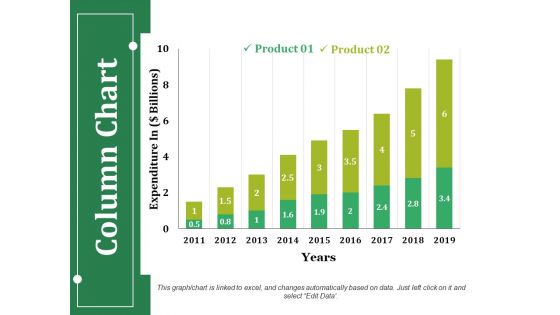
Column Chart Ppt PowerPoint Presentation Infographics Guidelines
This is a column chart ppt powerpoint presentation infographics guidelines. This is a two stage process. The stages in this process are product, expenditure in, years, business, bar graph.
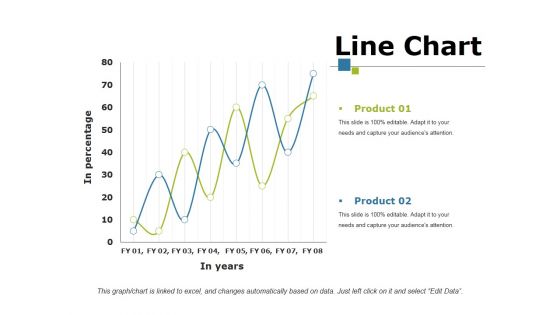
Line Chart Ppt PowerPoint Presentation Portfolio Mockup
This is a line chart ppt powerpoint presentation portfolio mockup. This is a two stage process. The stages in this process are product, in percentage, in year, growth, success.
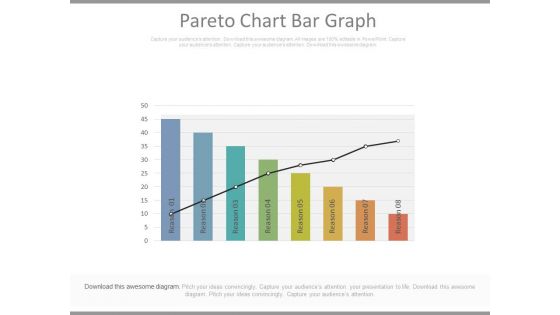
Pareto Chart Bar Graph Ppt Slides
This is a pareto chart bar graph ppt slides. This is a eight stage process. The stages in this process are business, marketing, success.\n
Bar Chart Ppt PowerPoint Presentation Icon Diagrams
This is a bar chart ppt powerpoint presentation icon diagrams. This is a two stage process. The stages in this process are bar chart, finance, analysis, business, marketing, strategy.
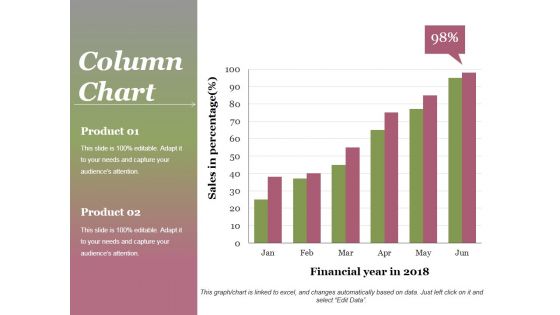
Column Chart Ppt PowerPoint Presentation Gallery Background
This is a column chart ppt powerpoint presentation gallery background. This is a two stage process. The stages in this process are product, sales in percentage, financial year, graph, success.
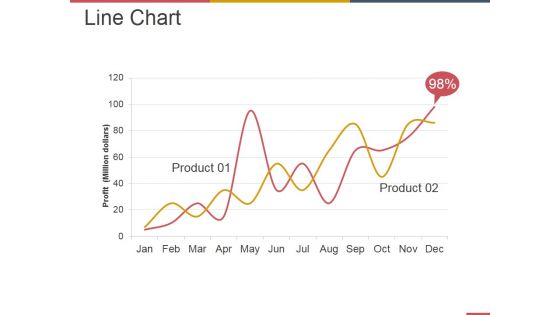
Line Chart Ppt PowerPoint Presentation Summary Information
This is a line chart ppt powerpoint presentation summary information. This is a two stage process. The stages in this process are business, strategy, marketing, analysis, profit million dollars.
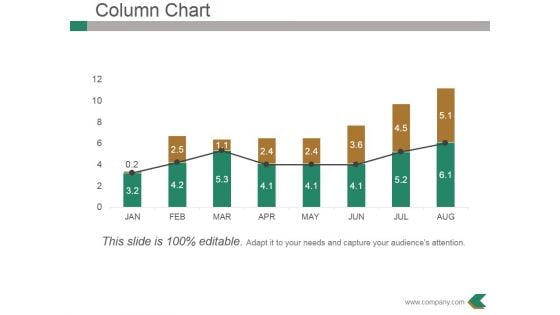
Column Chart Ppt PowerPoint Presentation Professional Example
This is a column chart ppt powerpoint presentation professional example. This is a eight stage process. The stages in this process are bar graph, growth, success, business, marketing.
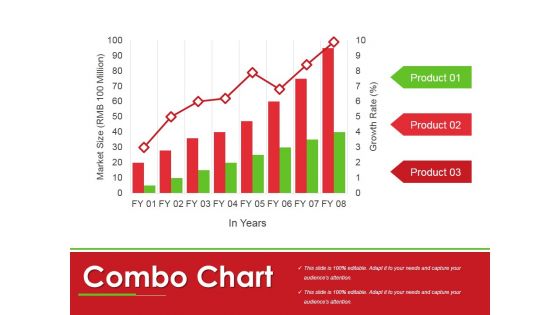
Combo Chart Ppt PowerPoint Presentation Portfolio Themes
This is a combo chart ppt powerpoint presentation portfolio themes. This is a three stage process. The stages in this process are market size, product, management, finance, chart, marketing.
Bubble Chart Ppt PowerPoint Presentation Icon Slides
This is a bubble chart ppt powerpoint presentation icon slides. This is a three stage process. The stages in this process are product, finance, business, marketing, bubble chart .
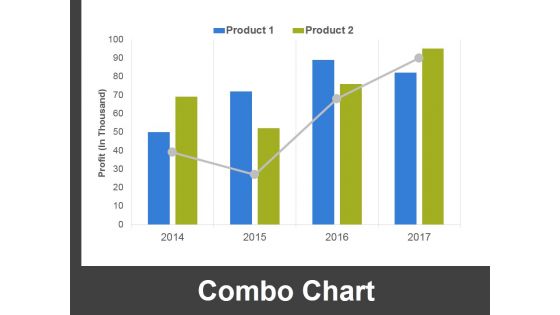
Combo Chart Ppt PowerPoint Presentation Ideas Outfit
This is a combo chart ppt powerpoint presentation ideas outfit. This is a four stage process. The stages in this process are combo chart, finance, analysis, marketing, strategy, business.
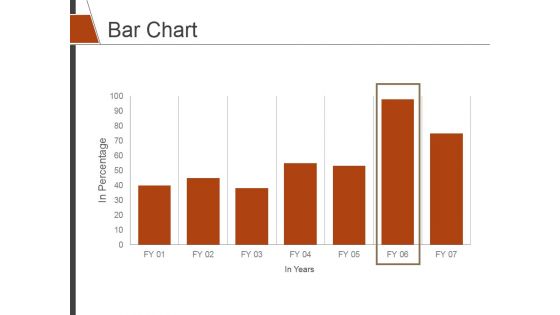
Bar Chart Ppt PowerPoint Presentation Slides Shapes
This is a bar chart ppt powerpoint presentation slides shapes. This is a seven stage process. The stages in this process are bar graph, finance, marketing, strategy, analysis.
Area Chart Ppt PowerPoint Presentation Icon Brochure
This is a area chart ppt powerpoint presentation icon brochure. This is a two stage process. The stages in this process are product, sales in percentage, growth, success.
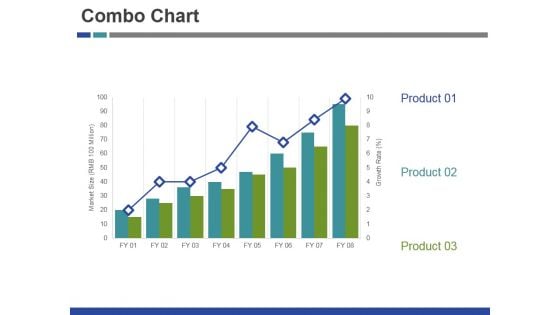
Combo Chart Ppt PowerPoint Presentation Diagram Lists
This is a combo chart ppt powerpoint presentation diagram lists. This is a eight stage process. The stages in this process are product, growth, success, business, graph.
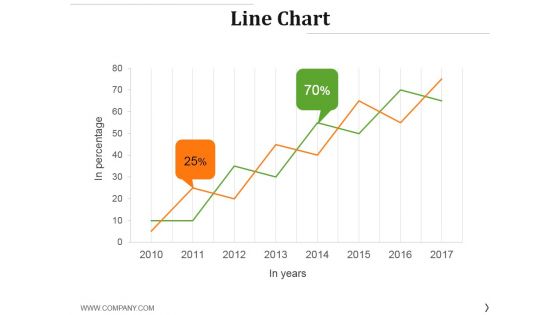
Line Chart Ppt PowerPoint Presentation Professional Template
This is a line chart ppt powerpoint presentation professional template. This is a two stage process. The stages in this process are business, finance, percentage, growth, success.
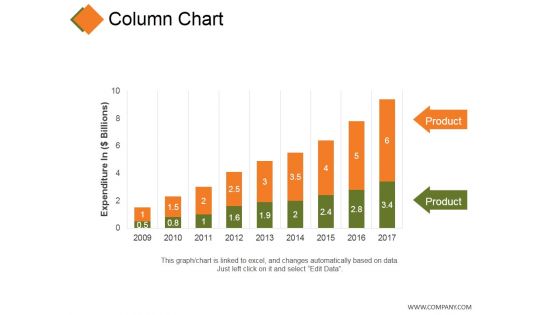
Column Chart Ppt PowerPoint Presentation Portfolio Background
This is a column chart ppt powerpoint presentation portfolio background. This is a nine stage process. The stages in this process are product, expenditure, growth, success, business.
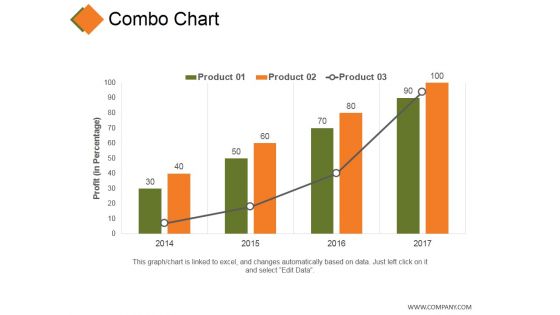
Combo Chart Ppt PowerPoint Presentation Ideas Brochure
This is a combo chart ppt powerpoint presentation ideas brochure. This is a four stage process. The stages in this process are product, profit, growth, success, business.
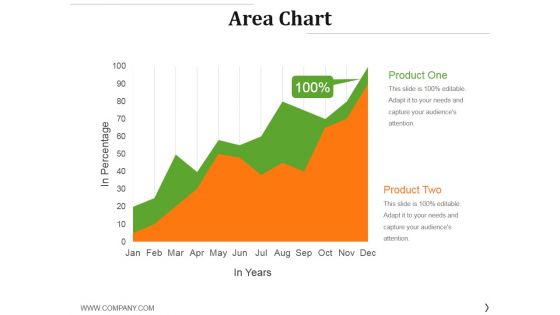
Area Chart Ppt PowerPoint Presentation Gallery Inspiration
This is a area chart ppt powerpoint presentation gallery inspiration. This is a two stage process. The stages in this process are product, growth, success, graph, finance.
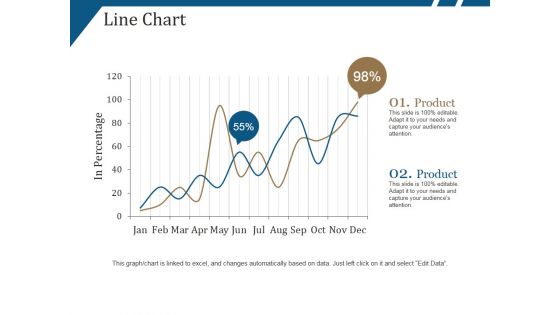
Line Chart Ppt PowerPoint Presentation Portfolio Show
This is a line chart ppt powerpoint presentation portfolio show. This is a two stage process. The stages in this process are product, in percentage, growth, success.
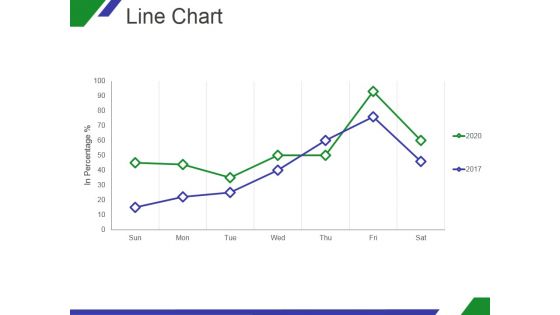
Line Chart Ppt PowerPoint Presentation Shapes
This is a line chart ppt powerpoint presentation shapes. This is a two stage process. The stages in this process are growth, in percentage, sun, mon, tue, wed.
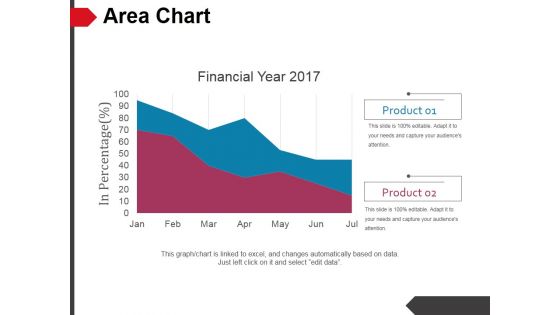
Area Chart Ppt PowerPoint Presentation Professional Display
This is a area chart ppt powerpoint presentation professional display. This is a two stage process. The stages in this process are business, finance, growth, strategy, marketing, analysis.
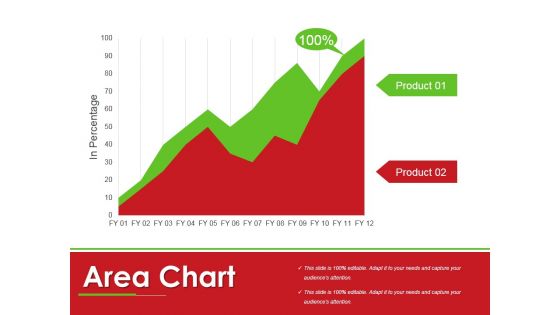
Area Chart Ppt PowerPoint Presentation Slides Inspiration
This is a area chart ppt powerpoint presentation slides inspiration. This is a two stage process. The stages in this process are business, marketing, finance, growth, management.
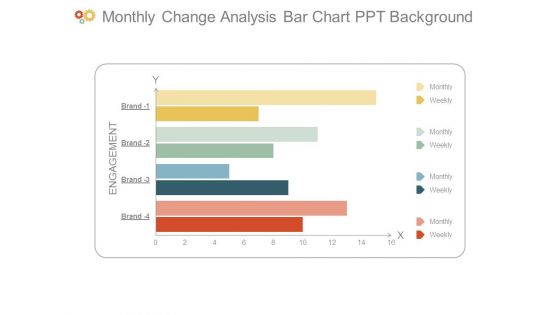
Monthly Change Analysis Bar Chart Ppt Background
This is a monthly change analysis bar chart ppt background. This is a four stage process. The stages in this process are engagement, monthly, weekly, brand.
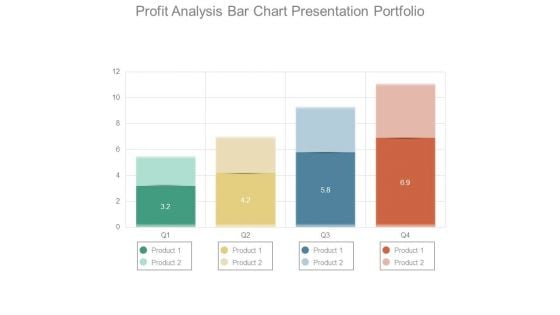
Profit Analysis Bar Chart Presentation Portfolio
This is a profit analysis bar chart presentation portfolio. This is a four stage process. The stages in this process are product.
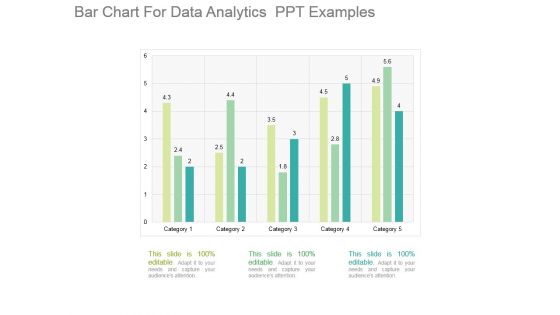
Bar Chart For Data Analytics Ppt Examples
This is a bar chart for data analytics ppt examples. This is a five stage process. The stages in this process are category.
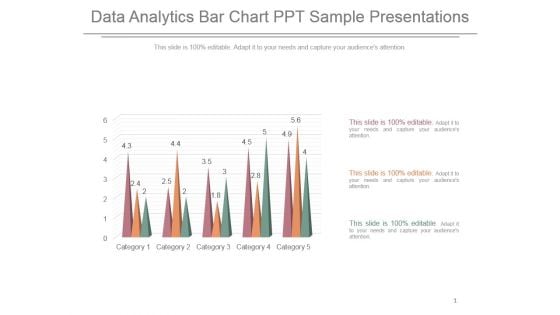
Data Analytics Bar Chart Ppt Sample Presentations
This is a data analytics bar chart ppt sample presentations. This is a five stage process. The stages in this process are category.
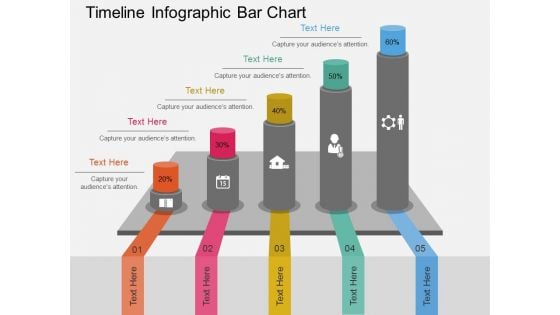
Timeline Infographic Bar Chart Powerpoint Template
This business diagram has been designed with timeline infographic bar chart. You may use this slide to display success and growth concepts. Make your mark with this unique slide and create an impression that will endure.
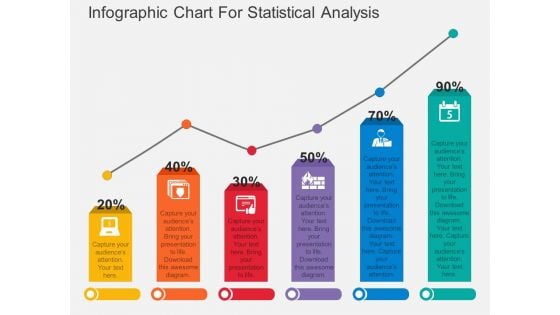
Infographic Chart For Statistical Analysis Powerpoint Template
Download this exclusive business diagram to display statistical analysis. This PowerPoint template contains bar chart with percentage values. This diagram is useful for business presentations.

Scatter Chart Ppt PowerPoint Presentation Examples
This is a scatter chart ppt powerpoint presentation examples. This is a eight stage process. The stages in this process are business, strategy, marketing, success, profit in sales.
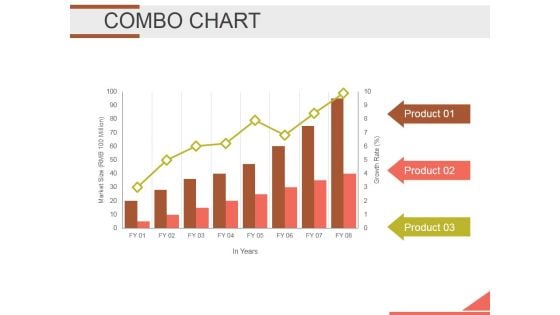
Combo Chart Ppt PowerPoint Presentation Infographics Infographics
This is a combo chart ppt powerpoint presentation infographics infographics. This is a three stage process. The stages in this process are bar graph, growth, finance, marketing, strategy, business.
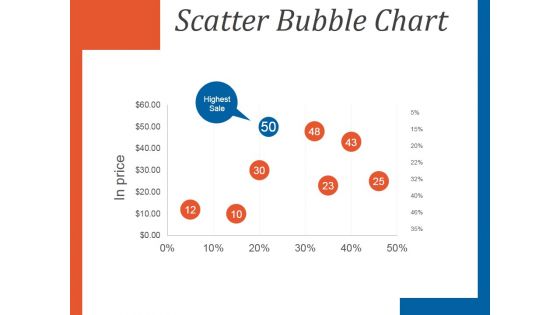
Scatter Bubble Chart Ppt PowerPoint Presentation Slides
This is a scatter bubble chart ppt powerpoint presentation slides. This is a eight stage process. The stages in this process are in price, highest sale, business, management.
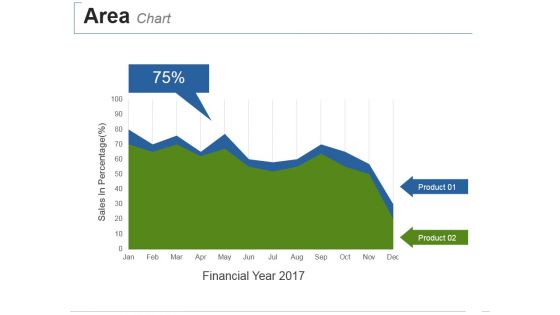
Area Chart Ppt PowerPoint Presentation Summary Deck
This is a area chart ppt powerpoint presentation summary deck. This is a two stage process. The stages in this process are sales in percentage, financial year.
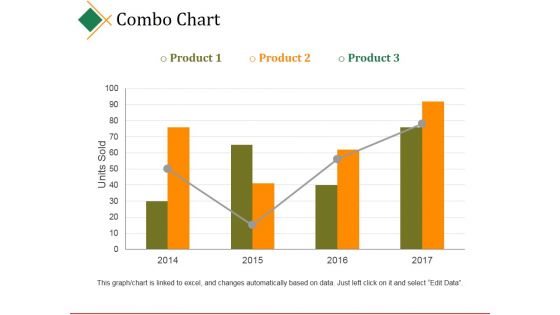
Combo Chart Ppt PowerPoint Presentation Slides Diagrams
This is a combo chart ppt powerpoint presentation slides diagrams. This is a four stage process. The stages in this process are units sold, business, product, marketing, graph.


 Continue with Email

 Home
Home


