Progress Meter
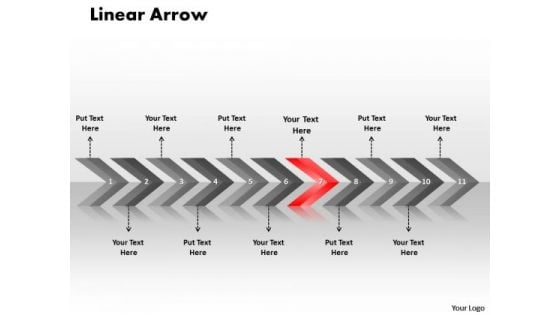
Business Ppt Theme Linear Arrows 11 Power Point Stage Strategy PowerPoint 8 Graphic
Business PPT Theme linear arrows 11 power point stage strategy powerpoint 8 Graphic-Use these Linear Arrows to Illustrate Processes Step by Step in PowerPoint Presentations. This diagram has the unique ability to drive home your ideas and show how they mesh to guarantee success.-Business PPT Theme linear arrows 11 power point stage strategy powerpoint 8 Graphic-Aim, Angle, Arrow, Arrowheads, Badge, Banner, Connection, Curve, Design, Direction, Download, Element, Fuchsia, Icon, Illustration, Indicator, Internet, Label, Link, Magenta, Mark, Marker, Next, Object, Orange, Orientation, Pointer, Shadow, Shape, Signs Symbol Alert your team to possibilities with our Business Ppt Theme Linear Arrows 11 Power Point Stage Strategy PowerPoint 8 Graphic. You will come out on top.

Pastry Shop Market Entry Plan Ppt Powerpoint Presentation GTM V
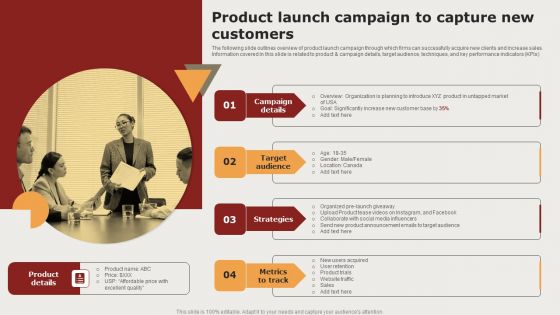
Creating Positioning Techniques For Market Research Product Launch Campaign To Capture New Customers Elements PDF
The following slide outlines overview of product launch campaign through which firms can successfully acquire new clients and increase sales. Information covered in this slide is related to product and campaign details, target audience, techniques, and key performance indicators KPIs From laying roadmaps to briefing everything in detail, our templates are perfect for you. You can set the stage with your presentation slides. All you have to do is download these easy to edit and customizable templates. Creating Positioning Techniques For Market Research Product Launch Campaign To Capture New Customers Elements PDF will help you deliver an outstanding performance that everyone would remember and praise you for. Do download this presentation today.
Steps To Effectively Conduct Market Research Product Launch Campaign To Capture New Customers Icons PDF
The following slide outlines overview of product launch campaign through which firms can successfully acquire new clients and increase sales. Information covered in this slide is related to product and campaign details, target audience, techniques, and key performance indicators KPIs. There are so many reasons you need a Steps To Effectively Conduct Market Research Product Launch Campaign To Capture New Customers Icons PDF. The first reason is you cannot spend time making everything from scratch, Thus, Slidegeeks has made presentation templates for you too. You can easily download these templates from our website easily.

Plan Of Action Business Proposal For Transportation And Logistics Company One Pager Sample Example Document
This slide indicates the action plan for the business proposal illustrating multiple stages and expected time required for the successful execution by the bidding company. Presenting you an exemplary Plan Of Action Business Proposal For Transportation And Logistics Company One Pager Sample Example Document. Our one-pager comprises all the must-have essentials of an inclusive document. You can edit it with ease, as its layout is completely editable. With such freedom, you can tweak its design and other elements to your requirements. Download this Plan Of Action Business Proposal For Transportation And Logistics Company One Pager Sample Example Document brilliant piece now.
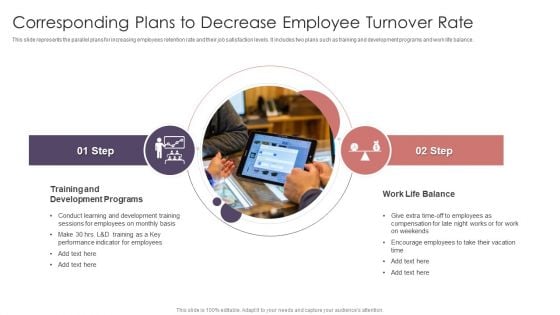
Corresponding Plans To Decrease Employee Turnover Rate Ideas PDF
This slide represents the parallel plans for increasing employees retention rate and their job satisfaction levels. It includes two plans such as training and development programs and work life balance. Persuade your audience using this Corresponding Plans To Decrease Employee Turnover Rate Ideas PDF. This PPT design covers two stages, thus making it a great tool to use. It also caters to a variety of topics including Development Programs, Encourage Employees, Performance Indicator. Download this PPT design now to present a convincing pitch that not only emphasizes the topic but also showcases your presentation skills.
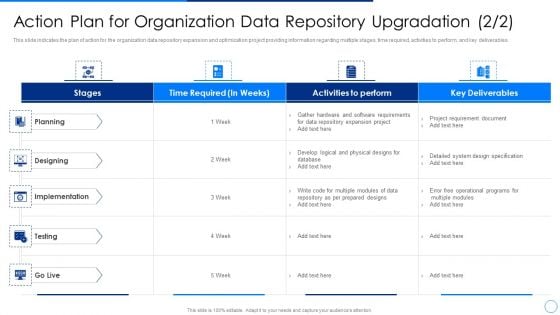
Scale Up Plan For Data Inventory Model Action Plan For Organization Data Repository Upgradation Testing Template PDF
This slide indicates the plan of action for the organization data repository expansion and optimization project providing information regarding multiple stages, time required, activities to perform, and key deliverables. Deliver an awe inspiring pitch with this creative scale up plan for data inventory model action plan for organization data repository upgradation testing template pdf. Topics like planning, designing, implementation, testing, go live can be discussed with this completely editable template. It is available for immediate download depending on the needs and requirements of the user.

Scale Up Plan For Data Inventory Model Action Plan For Organization Data Repository Upgradation Designing Mockup PDF
This slide indicates the plan of action for the organization data repository expansion and optimization project providing information regarding multiple stages such as planning, designing, implementation, testing and go live. This is a scale up plan for data inventory model action plan for organization data repository upgradation designing mockup pdf template with various stages. Focus and dispense information on five stages using this creative set, that comes with editable features. It contains large content boxes to add your information on topics like planning, implementation, go live, designing, testing. You can also showcase facts, figures, and other relevant content using this PPT layout. Grab it now.
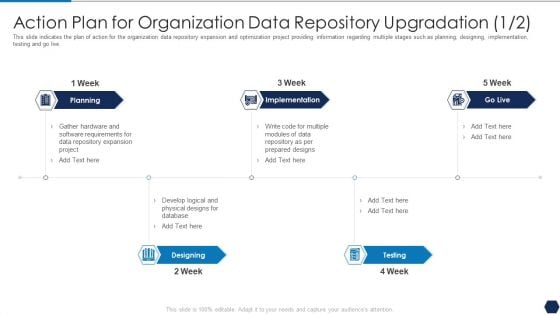
Tactical Plan For Upgrading DBMS Action Plan For Organization Data Repository Upgradation Designing Rules PDF
This slide indicates the plan of action for the organization data repository expansion and optimization project providing information regarding multiple stages such as planning, designing, implementation, testing and go live. This is a tactical plan for upgrading dbms action plan for organization data repository upgradation designing rules pdf template with various stages. Focus and dispense information on five stages using this creative set, that comes with editable features. It contains large content boxes to add your information on topics like planning, implementation, go live, designing, testing. You can also showcase facts, figures, and other relevant content using this PPT layout. Grab it now.
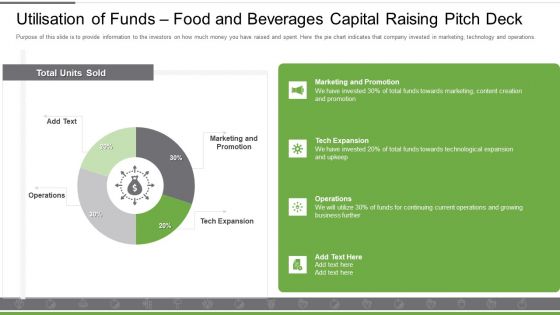
Utilisation Of Funds Food And Beverages Capital Raising Pitch Deck Portrait PDF
Purpose of this slide is to provide information to the investors on how much money you have raised and spent. Here the pie chart indicates that company invested in marketing, technology and operations. Deliver an awe inspiring pitch with this creative utilisation of funds food and beverages capital raising pitch deck portrait pdf bundle. Topics like marketing and promotion, tech expansion, operations can be discussed with this completely editable template. It is available for immediate download depending on the needs and requirements of the user.
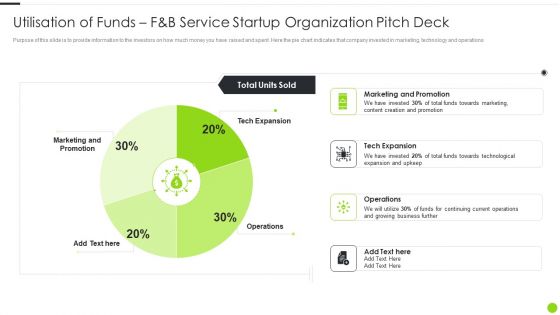
Utilisation Of Funds F And B Service Startup Organization Pitch Deck Structure PDF
Purpose of this slide is to provide information to the investors on how much money you have raised and spent. Here the pie chart indicates that company invested in marketing, technology and operations. Deliver and pitch your topic in the best possible manner with this utilisation of funds f and b service startup organization pitch deck structure pdf. Use them to share invaluable insights on marketing, tech expansion, operations and impress your audience. This template can be altered and modified as per your expectations. So, grab it now.
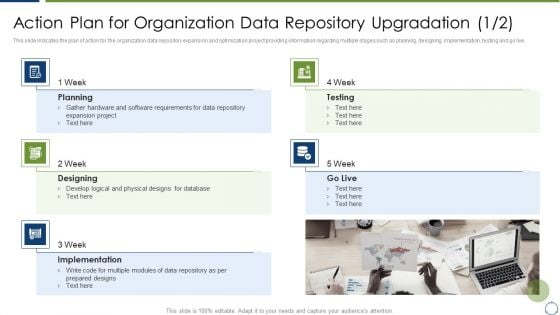
Action Plan For Organization Data Repository Upgradation Ideas PDF
This slide indicates the plan of action for the organization data repository expansion and optimization project providing information regarding multiple stages such as planning, designing, implementation, testing and go live.This is a Action Plan For Organization Data Repository Upgradation Ideas PDF template with various stages. Focus and dispense information on five stages using this creative set, that comes with editable features. It contains large content boxes to add your information on topics like Implementation, Designing, Planning You can also showcase facts, figures, and other relevant content using this PPT layout. Grab it now.
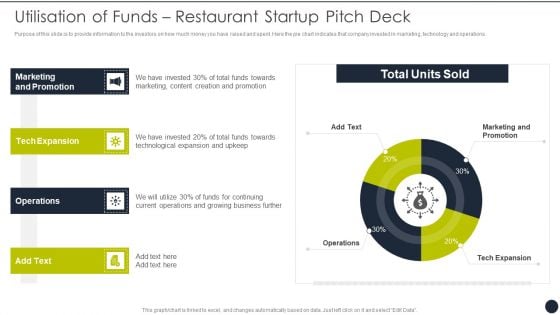
Utilisation Of Funds Restaurant Startup Pitch Deck Ideas PDF
Purpose of this slide is to provide information to the investors on how much money you have raised and spent. Here the pie chart indicates that company invested in marketing, technology and operations. Deliver and pitch your topic in the best possible manner with this Utilisation Of Funds Restaurant Startup Pitch Deck Ideas PDF. Use them to share invaluable insights on Marketing And Promotion, Tech Expansion, Operations and impress your audience. This template can be altered and modified as per your expectations. So, grab it now.
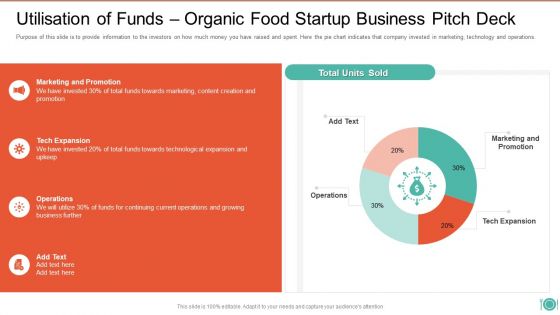
Utilisation Of Funds Organic Food Startup Business Pitch Deck Download PDF
Purpose of this slide is to provide information to the investors on how much money you have raised and spent. Here the pie chart indicates that company invested in marketing, technology and operations. Deliver an awe inspiring pitch with this creative Utilisation Of Funds Organic Food Startup Business Pitch Deck Download PDF bundle. Topics like Marketing And Promotion, Funds Towards Marketing, Towards Technological Expansion can be discussed with this completely editable template. It is available for immediate download depending on the needs and requirements of the user.
Utilisation Of Funds Investor Pitch Deck For Food Startup Ppt Icon Graphics Tutorials PDF
Purpose of this slide is to provide information to the investors on how much money you have raised and spent. Here the pie chart indicates that company invested in marketing, technology. Deliver and pitch your topic in the best possible manner with this Utilisation Of Funds Investor Pitch Deck For Food Startup Ppt Icon Graphics Tutorials PDF. Use them to share invaluable insights on Utilisation Funds, Marketing and Promotion, Tech Expansion and impress your audience. This template can be altered and modified as per your expectations. So, grab it now.
B2b Sales Performance Tracking Dashboard Comprehensive Guide For Developing Topics PDF
This slide represents metric dashboard to track sales performance on e-commerce website. It cover performance indicators such as sales breakdown, order breakdown, recurring sales etc.Do you have to make sure that everyone on your team knows about any specific topic I yes, then you should give B2b Sales Performance Tracking Dashboard Comprehensive Guide For Developing Topics PDF a try. Our experts have put a lot of knowledge and effort into creating this impeccable B2b Sales Performance Tracking Dashboard Comprehensive Guide For Developing Topics PDF. You can use this template for your upcoming presentations, as the slides are perfect to represent even the tiniest detail. You can download these templates from the Slidegeeks website and these are easy to edit. So grab these today.
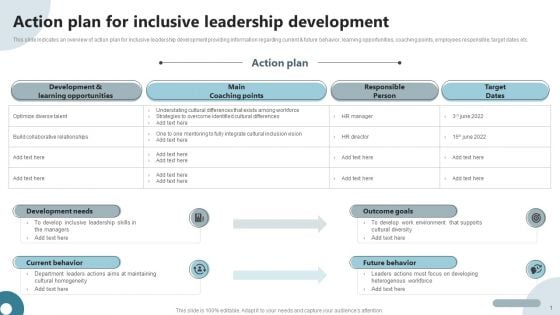
Strategies To Deploy Diversity In Workplace Action Plan For Inclusive Leadership Development Slides PDF
This slide indicates an overview of action plan for inclusive leadership development providing information regarding current and future behavior, learning opportunities, coaching points, employees responsible, target dates etc. Slidegeeks is one of the best resources for PowerPoint templates. You can download easily and regulate Strategies To Deploy Diversity In Workplace Action Plan For Inclusive Leadership Development Slides PDF for your personal presentations from our wonderful collection. A few clicks is all it takes to discover and get the most relevant and appropriate templates. Use our Templates to add a unique zing and appeal to your presentation and meetings. All the slides are easy to edit and you can use them even for advertisement purposes.
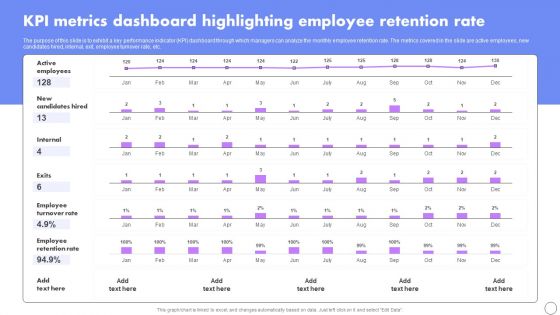
KPI Metrics Dashboard Highlighting Employee Retention Rate Developing Employee Retention Techniques Sample PDF
The purpose of this slide is to exhibit a key performance indicator KPI dashboard through which managers can analyze the monthly employee retention rate. The metrics covered in the slide are active employees, new candidates hired, internal, exit, employee turnover rate, etc.Do you have to make sure that everyone on your team knows about any specific topic I yes, then you should give KPI Metrics Dashboard Highlighting Employee Retention Rate Developing Employee Retention Techniques Sample PDF a try. Our experts have put a lot of knowledge and effort into creating this impeccable KPI Metrics Dashboard Highlighting Employee Retention Rate Developing Employee Retention Techniques Sample PDF. You can use this template for your upcoming presentations, as the slides are perfect to represent even the tiniest detail. You can download these templates from the Slidegeeks website and these are easy to edit. So grab these today.
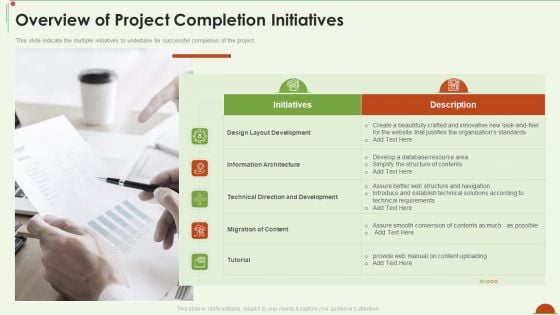
Project Management Under Supervision Overview Of Project Completion Initiatives Download PDF
This slide indicate the multiple initiatives to undertake for successful completion of the project. This is a project management under supervision overview of project completion initiatives download pdf template with various stages. Focus and dispense information on five stages using this creative set, that comes with editable features. It contains large content boxes to add your information on topics like design layout development, information architecture, technical direction and development, migration of content, tutorial. You can also showcase facts, figures, and other relevant content using this PPT layout. Grab it now.
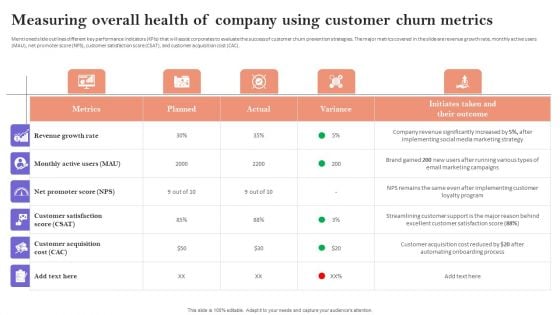
Measuring Overall Health Of Company Using Customer Churn Metrics Formats PDF
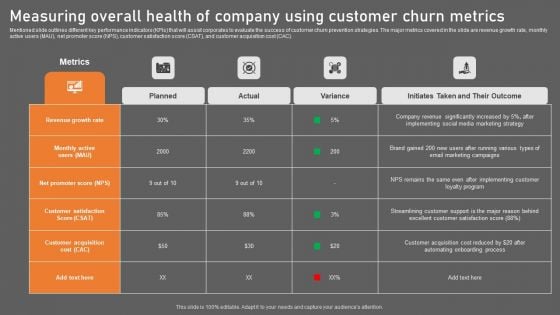
Mentioned slide outlines different key performance indicators KPIs that will assist corporates to evaluate the success of customer churn prevention strategies. The major metrics covered in the slide are revenue growth rate, monthly active users MAU, net promoter score NPS, customer satisfaction score CSAT, and customer acquisition cost CAC. Are you searching for a Measuring Overall Health Of Company Using Customer Churn Metrics Formats PDF that is uncluttered, straightforward, and original Its easy to edit, and you can change the colors to suit your personal or business branding. For a presentation that expresses how much effort you have put in, this template is ideal. With all of its features, including tables, diagrams, statistics, and lists, its perfect for a business plan presentation. Make your ideas more appealing with these professional slides. Download Measuring Overall Health Of Company Using Customer Churn Metrics Formats PDF from Slidegeeks today.
Measuring Overall Health Of Company Using Customer Churn Metrics Ppt PowerPoint Presentation File Icon PDF
Mentioned slide outlines different key performance indicators KPIs that will assist corporates to evaluate the success of customer churn prevention strategies. The major metrics covered in the slide are revenue growth rate, monthly active users MAU, net promoter score NPS, customer satisfaction score CSAT, and customer acquisition cost CAC. Create an editable Measuring Overall Health Of Company Using Customer Churn Metrics Ppt PowerPoint Presentation File Icon PDF that communicates your idea and engages your audience. Whether you are presenting a business or an educational presentation, pre designed presentation templates help save time. Measuring Overall Health Of Company Using Customer Churn Metrics Ppt PowerPoint Presentation File Icon PDF is highly customizable and very easy to edit, covering many different styles from creative to business presentations. Slidegeeks has creative team members who have crafted amazing templates. So, go and get them without any delay.
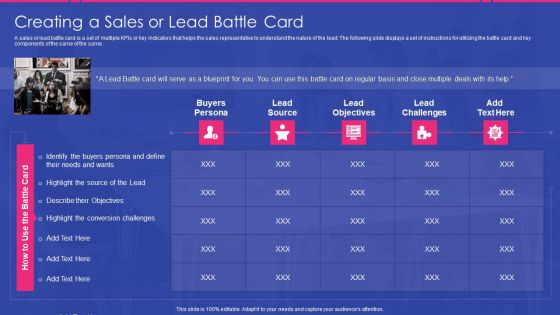
Sales Development Representative Playbook Creating A Sales Or Lead Battle Card Designs PDF
A sales or lead battle card is a set of multiple KPIs or key indicators that helps the sales representative to understand the nature of the lead. The following slide displays a set of instructions for utilizing the battle card and key components of the same of the same. This is a sales development representative playbook creating a sales or lead battle card designs pdf template with various stages. Focus and dispense information on five stages using this creative set, that comes with editable features. It contains large content boxes to add your information on topics like buyers persona, lead source, lead objectives, lead challenges . You can also showcase facts, figures, and other relevant content using this PPT layout. Grab it now.
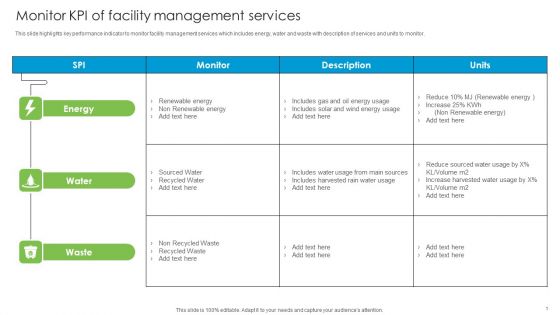
Monitor Kpi Of Facility Management Services Developing Tactical Fm Services Rules PDF
This slide highlights key performance indicator to monitor facility management services which includes energy, water and waste with description of services and units to monitor.This Monitor Kpi Of Facility Management Services Developing Tactical Fm Services Rules PDF from Slidegeeks makes it easy to present information on your topic with precision. It provides customization options, so you can make changes to the colors, design, graphics, or any other component to create a unique layout. It is also available for immediate download, so you can begin using it right away. Slidegeeks has done good research to ensure that you have everything you need to make your presentation stand out. Make a name out there for a brilliant performance.

Global Business Market Development Guide Map Highlighting Company Headquarters And New Locations Added Themes PDF
The slide illustrates a map indicating the number of new locations added in the business to expand the areas of operations worldwide. Various new locations added are Canada, Australia, China, India and Russia with 500 plus new stores The Global Business Market Development Guide Map Highlighting Company Headquarters And New Locations Added Themes PDF is a compilation of the most recent design trends as a series of slides. It is suitable for any subject or industry presentation, containing attractive visuals and photo spots for businesses to clearly express their messages. This template contains a variety of slides for the user to input data, such as structures to contrast two elements, bullet points, and slides for written information. Slidegeeks is prepared to create an impression.
Brand Launch Checklist Marketing Channels With Kpis To Be Tracked Slides PDF
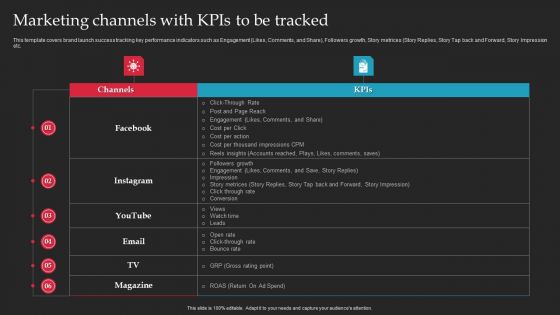
This template covers brand launch success tracking key performance indicators such as Engagement Likes, Comments, and Share, Followers growth, Story metrices Story Replies, Story Tap back and Forward, Story Impression etc. Welcome to our selection of the Brand Launch Checklist Marketing Channels With Kpis To Be Tracked Slides PDF. These are designed to help you showcase your creativity and bring your sphere to life. Planning and Innovation are essential for any business that is just starting out. This collection contains the designs that you need for your everyday presentations. All of our PowerPoints are 100 percent editable, so you can customize them to suit your needs. This multi-purpose template can be used in various situations. Grab these presentation templates today.
Measuring Overall Health Of Company Using Customer Churn Metrics Inspiration PDF
Application Acquisition Campaign Performance Analysis Online Customer Acquisition Microsoft Pdf
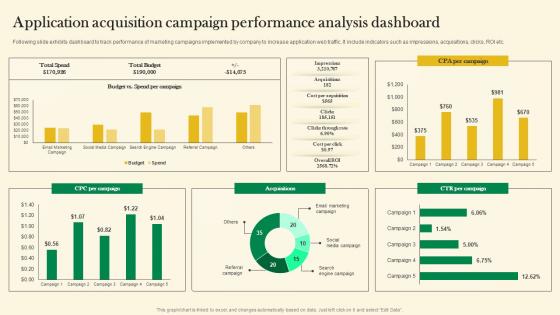
Following slide exhibits dashboard to track performance of marketing campaigns implemented by company to increase application web traffic. It include indicators such as impressions, acquisitions, clicks, ROI etc. Explore a selection of the finest Application Acquisition Campaign Performance Analysis Online Customer Acquisition Microsoft Pdf here. With a plethora of professionally designed and pre-made slide templates, you can quickly and easily find the right one for your upcoming presentation. You can use our Application Acquisition Campaign Performance Analysis Online Customer Acquisition Microsoft Pdf to effectively convey your message to a wider audience. Slidegeeks has done a lot of research before preparing these presentation templates. The content can be personalized and the slides are highly editable. Grab templates today from Slidegeeks. Following slide exhibits dashboard to track performance of marketing campaigns implemented by company to increase application web traffic. It include indicators such as impressions, acquisitions, clicks, ROI etc.
Understanding Cost Management And Optimization Tactical Financial Governance Themes Pdf
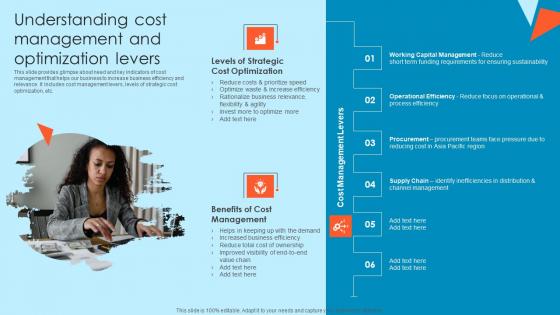
This slide provides glimpse about need and key indicators of cost management that helps our business to increase business efficiency and relevance. It includes cost management levers, levels of strategic cost optimization, etc.If your project calls for a presentation, then Slidegeeks is your go-to partner because we have professionally designed, easy-to-edit templates that are perfect for any presentation. After downloading, you can easily edit Understanding Cost Management And Optimization Tactical Financial Governance Themes Pdf and make the changes accordingly. You can rearrange slides or fill them with different images. Check out all the handy templates This slide provides glimpse about need and key indicators of cost management that helps our business to increase business efficiency and relevance. It includes cost management levers, levels of strategic cost optimization, etc.
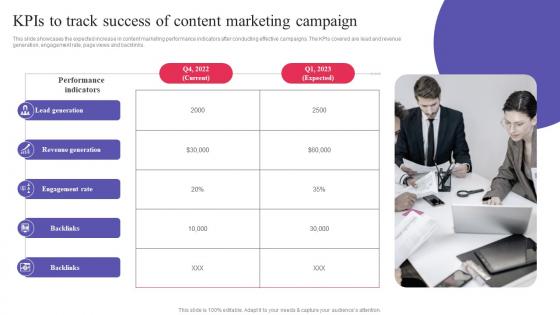
KPIs To Track Success Of Content Marketing Campaign Digital Promotional Campaign Formats Pdf
This slide showcases the expected increase in content marketing performance indicators after conducting effective campaigns. The KPIs covered are lead and revenue generation, engagement rate, page views and backlinks. This modern and well-arranged KPIs To Track Success Of Content Marketing Campaign Digital Promotional Campaign Formats Pdf provides lots of creative possibilities. It is very simple to customize and edit with the Powerpoint Software. Just drag and drop your pictures into the shapes. All facets of this template can be edited with Powerpoint no extra software is necessary. Add your own material, put your images in the places assigned for them, adjust the colors, and then you can show your slides to the world, with an animated slide included. This slide showcases the expected increase in content marketing performance indicators after conducting effective campaigns. The KPIs covered are lead and revenue generation, engagement rate, page views and backlinks.
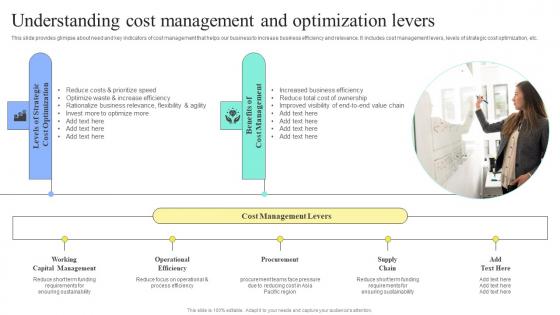
Strategic Financial Planning And Administration Understanding Cost Management Optimization Guidelines PDF
This slide provides glimpse about need and key indicators of cost management that helps our business to increase business efficiency and relevance. It includes cost management levers, levels of strategic cost optimization, etc. There are so many reasons you need a Strategic Financial Planning And Administration Understanding Cost Management Optimization Guidelines PDF. The first reason is you can not spend time making everything from scratch, Thus, Slidegeeks has made presentation templates for you too. You can easily download these templates from our website easily. This slide provides glimpse about need and key indicators of cost management that helps our business to increase business efficiency and relevance. It includes cost management levers, levels of strategic cost optimization, etc.
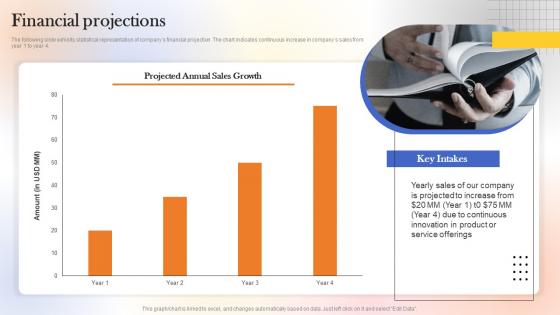
Financial Projections Web Designing Platform Fundraising Pitch Deck Microsoft Pdf
The following slide exhibits statistical representation of companys financial projection. The chart indicates continuous increase in companys sales from year 1 to year 4. Whether you have daily or monthly meetings, a brilliant presentation is necessary. Financial Projections Web Designing Platform Fundraising Pitch Deck Microsoft Pdf can be your best option for delivering a presentation. Represent everything in detail using Financial Projections Web Designing Platform Fundraising Pitch Deck Microsoft Pdf and make yourself stand out in meetings. The template is versatile and follows a structure that will cater to your requirements. All the templates prepared by Slidegeeks are easy to download and edit. Our research experts have taken care of the corporate themes as well. So, give it a try and see the results. The following slide exhibits statistical representation of companys financial projection. The chart indicates continuous increase in companys sales from year 1 to year 4.
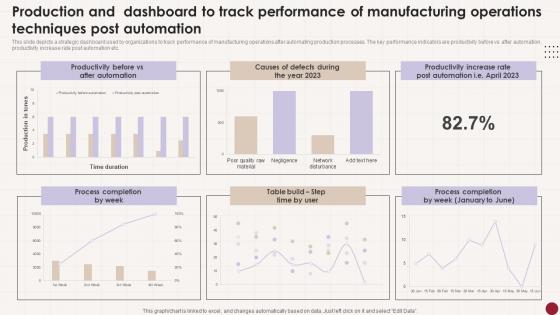
Production And Dashboard To Track Performance Of Manufacturing Operations Techniques Post Automation Tips Pdf
This slide depicts a strategic dashboard used by organizations to track performance of manufacturing operations after automating production processes. The key performance indicators are productivity before vs after automation, productivity increase rate post automation etc. Pitch your topic with ease and precision using this Production And Dashboard To Track Performance Of Manufacturing Operations Techniques Post Automation Tips Pdf This layout presents information on Productivity Before, After Automation, Process Completion It is also available for immediate download and adjustment. So, changes can be made in the color, design, graphics or any other component to create a unique layout. This slide depicts a strategic dashboard used by organizations to track performance of manufacturing operations after automating production processes. The key performance indicators are productivity before vs after automation, productivity increase rate post automation etc.
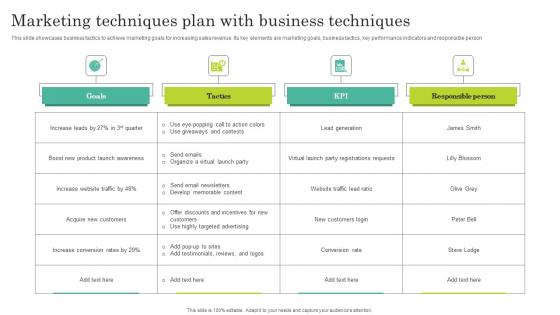
Marketing Techniques Plan With Business Techniques Formats Pdf
This slide showcases business tactics to achieve marketing goals for increasing sales revenue. Its key elements are marketing goals, business tactics, key performance indicators and responsible person Pitch your topic with ease and precision using this Marketing Techniques Plan With Business Techniques Formats Pdf. This layout presents information on Use Eye Popping Call, Action Colors, Use Giveaways Contests, Send Email Newsletters. It is also available for immediate download and adjustment. So, changes can be made in the color, design, graphics or any other component to create a unique layout. This slide showcases business tactics to achieve marketing goals for increasing sales revenue. Its key elements are marketing goals, business tactics, key performance indicators and responsible person

Facebook Marketing Techniques Running Facebook Advertisement Campaign Strategy SS V
The following slide outlines overview of Facebook ad campaign that can assist brands in increasing product service revenue. The slide provides information about campaign goals, ad format, projected expenditure, target audience, content techniques, and key performance indicators KPIs . From laying roadmaps to briefing everything in detail, our templates are perfect for you. You can set the stage with your presentation slides. All you have to do is download these easy-to-edit and customizable templates. Facebook Marketing Techniques Running Facebook Advertisement Campaign Strategy SS V will help you deliver an outstanding performance that everyone would remember and praise you for. Do download this presentation today. The following slide outlines overview of Facebook ad campaign that can assist brands in increasing product service revenue. The slide provides information about campaign goals, ad format, projected expenditure, target audience, content techniques, and key performance indicators KPIs .
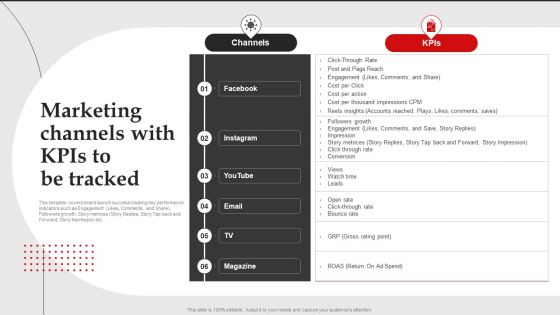
Marketing Channels With Kpis To Be Tracked Brand Introduction Plan Brochure PDF
This template covers brand launch success tracking key performance indicators such as Engagement Likes, Comments, and Share, Followers growth, Story metrices Story Replies, Story Tap back and Forward, Story Impression etc.Slidegeeks is one of the best resources for PowerPoint templates. You can download easily and regulate Marketing Channels With Kpis To Be Tracked Brand Introduction Plan Brochure PDF for your personal presentations from our wonderful collection. A few clicks is all it takes to discover and get the most relevant and appropriate templates. Use our Templates to add a unique zing and appeal to your presentation and meetings. All the slides are easy to edit and you can use them even for advertisement purposes.
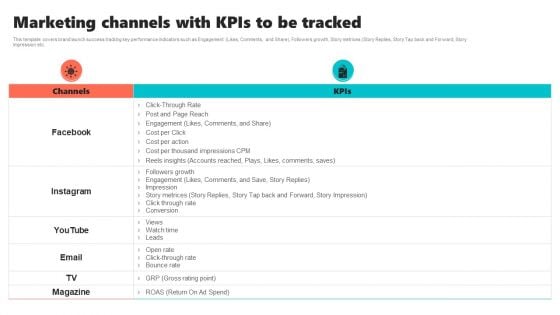
New Brand Introduction Plan Marketing Channels With Kpis To Be Tracked Sample PDF
This template covers brand launch success tracking key performance indicators such as Engagement Likes, Comments, and Share, Followers growth, Story metrices Story Replies, Story Tap back and Forward, Story Impression etc.Are you in need of a template that can accommodate all of your creative concepts This one is crafted professionally and can be altered to fit any style. Use it with Google Slides or PowerPoint. Include striking photographs, symbols, depictions, and other visuals. Fill, move around, or remove text boxes as desired. Test out color palettes and font mixtures. Edit and save your work, or work with colleagues. Download New Brand Introduction Plan Marketing Channels With Kpis To Be Tracked Sample PDF and observe how to make your presentation outstanding. Give an impeccable presentation to your group and make your presentation unforgettable.
Product Repositioning KPI Monitoring And Tracking Ppt PowerPoint Presentation File Infographic Template PDF
This slide highlights the key performance indicator of product repositioning which includes product sales, product demand in the market, position in the market and social media channels growth rate. If you are looking for a format to display your unique thoughts, then the professionally designed Product Repositioning KPI Monitoring And Tracking Ppt PowerPoint Presentation File Infographic Template PDF is the one for you. You can use it as a Google Slides template or a PowerPoint template. Incorporate impressive visuals, symbols, images, and other charts. Modify or reorganize the text boxes as you desire. Experiment with shade schemes and font pairings. Alter, share or cooperate with other people on your work. Download Product Repositioning KPI Monitoring And Tracking Ppt PowerPoint Presentation File Infographic Template PDF and find out how to give a successful presentation. Present a perfect display to your team and make your presentation unforgettable.

Mitigating Sales Risks With Strategic Action Planning Assessing Impact Of Sales Risk Management Diagrams PDF
The following slide highlights some key performance indicators KPIs to measure the influence of executing sales risk management strategies on revenue performance. It includes elements such as target attainment rate, gross profit, annual growth rate etc. If you are looking for a format to display your unique thoughts, then the professionally designed Mitigating Sales Risks With Strategic Action Planning Assessing Impact Of Sales Risk Management Diagrams PDF is the one for you. You can use it as a Google Slides template or a PowerPoint template. Incorporate impressive visuals, symbols, images, and other charts. Modify or reorganize the text boxes as you desire. Experiment with shade schemes and font pairings. Alter, share or cooperate with other people on your work. Download Mitigating Sales Risks With Strategic Action Planning Assessing Impact Of Sales Risk Management Diagrams PDF and find out how to give a successful presentation. Present a perfect display to your team and make your presentation unforgettable.
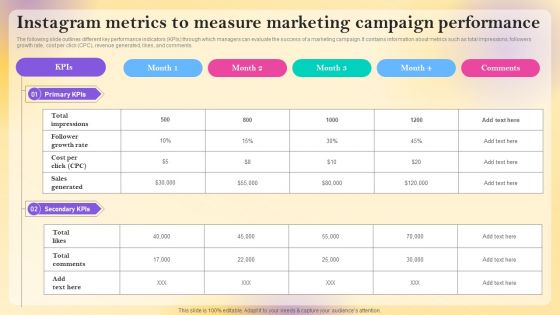
Instagram Metrics To Measure Marketing Campaign Performance Formats PDF
The following slide outlines different key performance indicators KPIs through which managers can evaluate the success of a marketing campaign. It contains information about metrics such as total impressions, followers growth rate, cost per click CPC, revenue generated, likes, and comments. Explore a selection of the finest Instagram Metrics To Measure Marketing Campaign Performance Formats PDF here. With a plethora of professionally designed and pre made slide templates, you can quickly and easily find the right one for your upcoming presentation. You can use our Instagram Metrics To Measure Marketing Campaign Performance Formats PDF to effectively convey your message to a wider audience. Slidegeeks has done a lot of research before preparing these presentation templates. The content can be personalized and the slides are highly editable. Grab templates today from Slidegeeks.
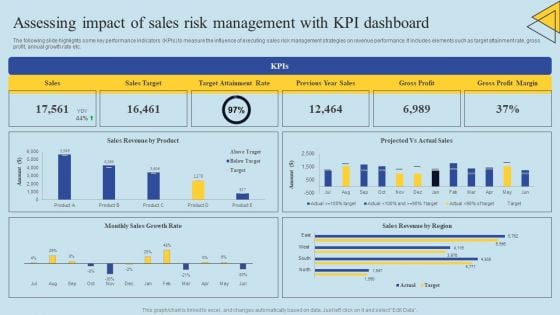
Determining Risks In Sales Administration Procedure Assessing Impact Of Sales Risk Management Sample PDF
The following slide highlights some key performance indicators KPIs to measure the influence of executing sales risk management strategies on revenue performance. It includes elements such as target attainment rate, gross profit, annual growth rate etc. If you are looking for a format to display your unique thoughts, then the professionally designed Determining Risks In Sales Administration Procedure Assessing Impact Of Sales Risk Management Sample PDF is the one for you. You can use it as a Google Slides template or a PowerPoint template. Incorporate impressive visuals, symbols, images, and other charts. Modify or reorganize the text boxes as you desire. Experiment with shade schemes and font pairings. Alter, share or cooperate with other people on your work. Download Determining Risks In Sales Administration Procedure Assessing Impact Of Sales Risk Management Sample PDF and find out how to give a successful presentation. Present a perfect display to your team and make your presentation unforgettable.
Corporate Audit And Review Team Raci Matrix Icons PDF
This slide indicates roles and responsibilities of corporate audit team. It includes roles like writer, editor, content designer, customer success, product marketing etc. Showcasing this set of slides titled Corporate Audit And Review Team Raci Matrix Icons PDF. The topics addressed in these templates are Management System, Data Protection, Interview Manager. All the content presented in this PPT design is completely editable. Download it and make adjustments in color, background, font etc. as per your unique business setting.
Ppt 2 State Diagram Linear Procurement Process PowerPoint Presentation Templates
PPT 2 state diagram linear procurement process powerpoint presentation Templates-Our Template designs are State of the Art. This one depicts the popular linear chart. The structure of our template allows you to effectively highlight the key issues concerning the growth of your business.-PPT 2 state diagram linear procurement process powerpoint presentation Templates-Aim, Arrow, Arrowheads, Badge, Border, Click, Connection, Curve, Design, Direction, Download, Element, Fuchsia, Icon, Illustration, Indicator, Internet, Magenta, Mark, Object, Orientation, Pointer, Shadow, Shape, Sign You know you have the feel for it. Confidently address your audience with our Ppt 2 State Diagram Linear Procurement Process PowerPoint Presentation Templates.
Ppt Linear Illustration Of Writing Process PowerPoint Presentation Templates
PPT linear illustration of writing process powerpoint presentation Templates-The ideas and plans are on your fingertips. Now imprint them on the minds of your audience via this slide. The structure of our template allows you to effectively highlight the key issues concerning the growth of your business.-PPT linear illustration of writing process powerpoint presentation Templates-Aim, Arrow, Arrowheads, Badge, Border, Click, Connection, Curve, Design, Direction, Download, Element, Fuchsia, Icon, Illustration, Indicator, Internet, Magenta, Mark, Object, Orientation, Pointer, Shadow, Shape, Sign Bid adieu to difficulty. Our Ppt Linear Illustration Of Writing Process PowerPoint Presentation Templates ensure you fare well.
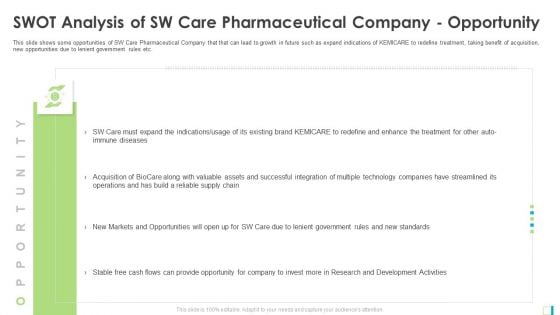
SWOT Analysis Of SW Care Pharmaceutical Company Opportunity Introduction PDF
This slide shows some opportunities of SW Care Pharmaceutical Company that that can lead to growth in future such as expand indications of KEMICARE to redefine treatment, taking benefit of acquisition, new opportunities due to lenient government rules etc. Presenting swot analysis of sw care pharmaceutical company opportunity introduction pdf to provide visual cues and insights. Share and navigate important information on four stages that need your due attention. This template can be used to pitch topics like swot analysis of sw care pharmaceutical company opportunity. In addtion, this PPT design contains high resolution images, graphics, etc, that are easily editable and available for immediate download.

Swot Analysis Of Sw Care Pharmaceutical Company Opportunity Ppt Inspiration Backgrounds PDF
This slide shows some opportunities of SW Care Pharmaceutical Company that that can lead to growth in future such as expand indications of KEMICARE to redefine treatment, taking benefit of acquisition, new opportunities due to lenient government rules etc. Presenting swot analysis of sw care pharmaceutical company opportunity ppt inspiration backgrounds pdf to provide visual cues and insights. Share and navigate important information on four stages that need your due attention. This template can be used to pitch topics like supply, technology, opportunities, markets. In addtion, this PPT design contains high resolution images, graphics, etc, that are easily editable and available for immediate download.
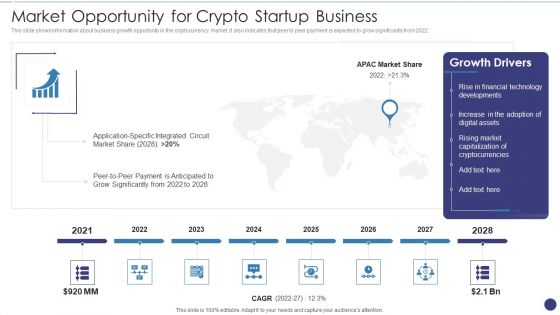
Market Opportunity For Crypto Startup Business Ppt Styles Graphics Tutorials PDF
This slide shows information about business growth opportunity in the cryptocurrency market. It also indicates that peer to peer payment is expected to grow significantly from 2022. Presenting market opportunity for crypto startup business ppt styles graphics tutorials pdf to provide visual cues and insights. Share and navigate important information on two stages that need your due attention. This template can be used to pitch topics like payment, application, market. In addtion, this PPT design contains high resolution images, graphics, etc, that are easily editable and available for immediate download.
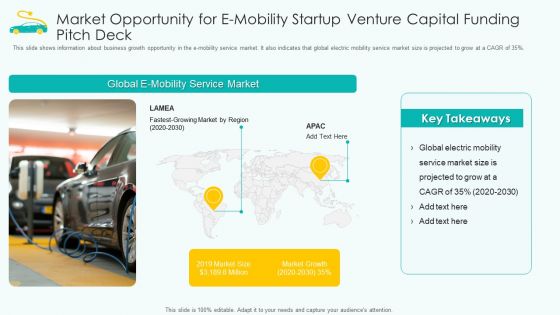
Market Opportunity For E Mobility Startup Venture Capital Funding Pitch Deck Background PDF
This slide shows information about business growth opportunity in the e mobility service market. It also indicates that global electric mobility service market size is projected to grow at a CAGR of 35 percenrtage. Deliver an awe inspiring pitch with this creative market opportunity for e mobility startup venture capital funding pitch deck background pdf bundle. Topics like service, market, global can be discussed with this completely editable template. It is available for immediate download depending on the needs and requirements of the user.
Market Opportunity For Digital Currency Fundraising Ppt Icon Background PDF
This slide shows information about business growth opportunity in the cryptocurrency market. It also indicates that peer to peer payment is expected to grow significantly from 2021. Presenting market opportunity for digital currency fundraising ppt icon background pdf to provide visual cues and insights. Share and navigate important information on six stages that need your due attention. This template can be used to pitch topics like market opportunity for digital currency fundraising. In addtion, this PPT design contains high resolution images, graphics, etc, that are easily editable and available for immediate download.

Market Opportunity For Electric Scooter Startup Pitch Deck Ppt Slides Portrait PDF
This slide shows information about business growth opportunity in the e-mobility service market. It also indicates that global electric mobility service market size is projected to grow at a CAGR of 35 per cent. Presenting market opportunity for electric scooter startup pitch deck ppt slides portrait pdf to provide visual cues and insights. Share and navigate important information on one stages that need your due attention. This template can be used to pitch topics like market opportunity for electric scooter startup pitch deck . In addtion, this PPT design contains high resolution images, graphics, etc, that are easily editable and available for immediate download.
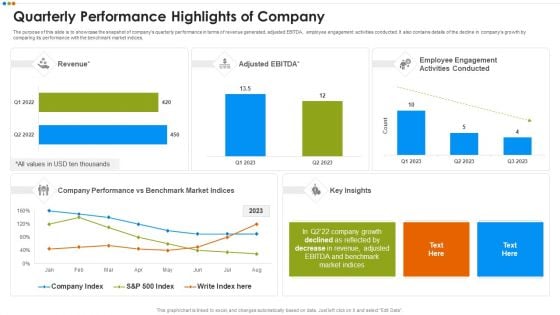
Quarterly Budget Analysis Of Business Organization Quarterly Performance Highlights Of Company Graphics PDF
The purpose of this slide is to showcase the snapshot of companys quarterly performance in terms of revenue generated, adjusted EBITDA, employee engagement activities conducted. It also contains details of the decline in companys growth by comparing its performance with the benchmark market indices.This is a Quarterly Budget Analysis Of Business Organization Quarterly Performance Highlights Of Company Graphics PDF template with various stages. Focus and dispense information on two stages using this creative set, that comes with editable features. It contains large content boxes to add your information on topics like Quarterly Performance Highlights Of Company You can also showcase facts, figures, and other relevant content using this PPT layout. Grab it now.
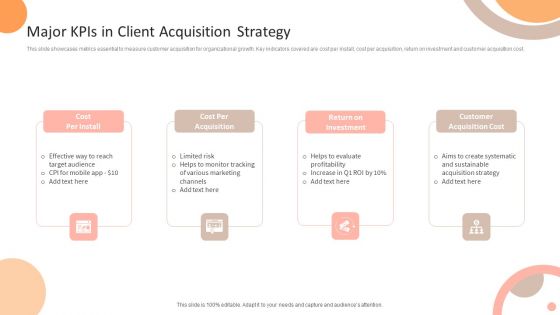
Major Kpis In Client Acquisition Strategy Ppt Layouts Graphics Template PDF
This slide showcases metrics essential to measure customer acquisition for organizational growth. Key indicators covered are cost per install, cost per acquisition, return on investment and customer acquisition cost. Presenting Major Kpis In Client Acquisition Strategy Ppt Layouts Graphics Template PDF to dispense important information. This template comprises four stages. It also presents valuable insights into the topics including Cost Per Install, Cost Per Acquisition, Return on Investment, Customer Acquisition Cost. This is a completely customizable PowerPoint theme that can be put to use immediately. So, download it and address the topic impactfully.
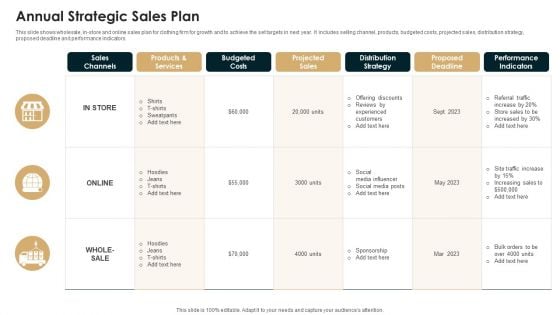
Annual Strategic Sales Plan Template PDF
This slide shows wholesale, in store and online sales plan for clothing firm for growth and to achieve the set targets in next year. It includes selling channel, products, budgeted costs, projected sales, distribution strategy, proposed deadline and performance indicators. Showcasing this set of slides titled Annual Strategic Sales Plan Template PDF. The topics addressed in these templates are Budgeted Costs, Projected Sales, Distribution Strategy. All the content presented in this PPT design is completely editable. Download it and make adjustments in color, background, font etc. as per your unique business setting.
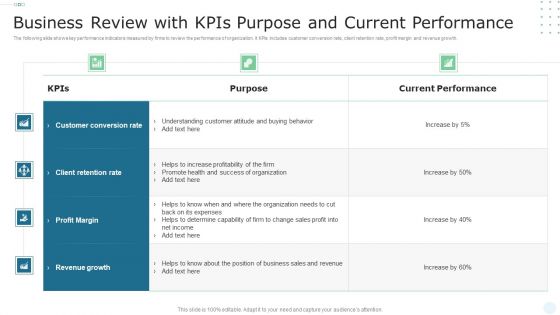
Business Review With Kpis Purpose And Current Performance Inspiration PDF
The following slide shows key performance indicators measured by firms to review the performance of organization. It KPIs includes customer conversion rate, client retention rate, profit margin and revenue growth. Showcasing this set of slides titled Business Review With Kpis Purpose And Current Performance Inspiration PDF. The topics addressed in these templates are Customer Conversion Rate, Client Retention Rate, Profit Margin. All the content presented in this PPT design is completely editable. Download it and make adjustments in color, background, font etc. as per your unique business setting.
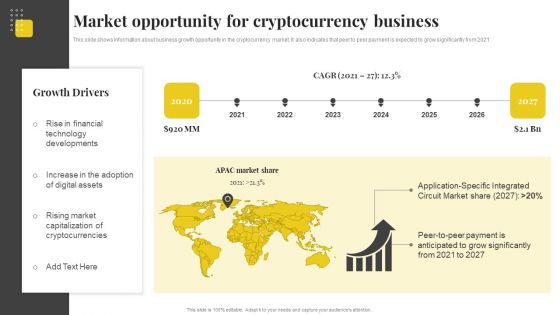
Capital Financing Pitch Deck For Cryptocurrency Business Market Opportunity For Cryptocurrency Business Professional PDF
This slide shows information about business growth opportunity in the cryptocurrency market. It also indicates that peer to peer payment is expected to grow significantly from 2021. Slidegeeks is one of the best resources for PowerPoint templates. You can download easily and regulate Capital Financing Pitch Deck For Cryptocurrency Business Market Opportunity For Cryptocurrency Business Professional PDF for your personal presentations from our wonderful collection. A few clicks is all it takes to discover and get the most relevant and appropriate templates. Use our Templates to add a unique zing and appeal to your presentation and meetings. All the slides are easy to edit and you can use them even for advertisement purposes.
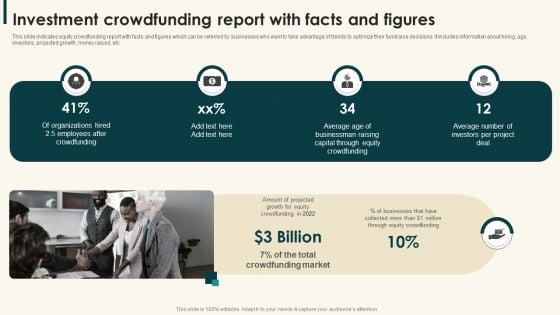
Investment Crowdfunding Report With Facts And Figures Ideas PDF
This slide indicates equity crowdfunding report with facts and figures which can be referred by businesses who want to take advantage of trends to optimize their fundraise decisions. It includes information about hiring, age, investors, projected growth, money raised, etc.Persuade your audience using this Investment Crowdfunding Report With Facts And Figures Ideas PDF. This PPT design covers four stages, thus making it a great tool to use. It also caters to a variety of topics including Businessman Raising, Equity Crowdfunding, Investors Per. Download this PPT design now to present a convincing pitch that not only emphasizes the topic but also showcases your presentation skills.

Retail Apparel Online Track Metrics To Analyze Social Media Engagement Professional PDF
This slide showcases key indicators to track and analyze social media engagement. The metrics covered are reach, impressions, audience growth rate, click-through and average engagement rate, share of voice and conversion rate. Want to ace your presentation in front of a live audience Our Retail Apparel Online Track Metrics To Analyze Social Media Engagement Professional PDF can help you do that by engaging all the users towards you. Slidegeeks experts have put their efforts and expertise into creating these impeccable powerpoint presentations so that you can communicate your ideas clearly. Moreover, all the templates are customizable, and easy-to-edit and downloadable. Use these for both personal and commercial use.
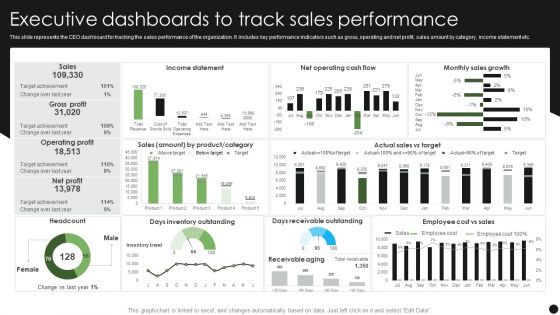
Executive Dashboards To Track Sales Performance Guidelines PDF
This slide represents the CEO dashboard for tracking the sales performance of the organization. It includes key performance indicators such as gross, operating and net profit, sales amount by category, income statement etc. Pitch your topic with ease and precision using this Executive Dashboards To Track Sales Performance Guidelines PDF. This layout presents information on Income Statement, Monthly Sales Growth, Days Receivable Outstanding. It is also available for immediate download and adjustment. So, changes can be made in the color, design, graphics or any other component to create a unique layout.

KPI Dashboard To Track Sales And Operations Process Of Manufacturing Enterprise Brochure PDF
This slide depicts a dashboard to track the key performance metrics in sales and operations process of a manufacturing enterprise to analyze deviations in the actual and planned output. The key performing indicators are percentage deviation, dollar deviation, inventory in hand etc.Pitch your topic with ease and precision using this KPI Dashboard To Track Sales And Operations Process Of Manufacturing Enterprise Brochure PDF. This layout presents information on Planned Output, Yearly Growth, Inventory Hand. It is also available for immediate download and adjustment. So, changes can be made in the color, design, graphics or any other component to create a unique layout.
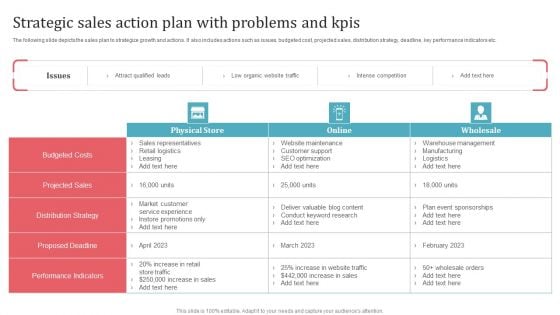
Strategic Sales Action Plan With Problems And Kpis Guidelines PDF
The following slide depicts the sales plan to strategize growth and actions. It also includes actions such as issues, budgeted cost, projected sales, distribution strategy, deadline, key performance indicators etc. Pitch your topic with ease and precision using this Strategic Sales Action Plan With Problems And Kpis Guidelines PDF. This layout presents information on Physical Store, Online, Wholesale. It is also available for immediate download and adjustment. So, changes can be made in the color, design, graphics or any other component to create a unique layout.
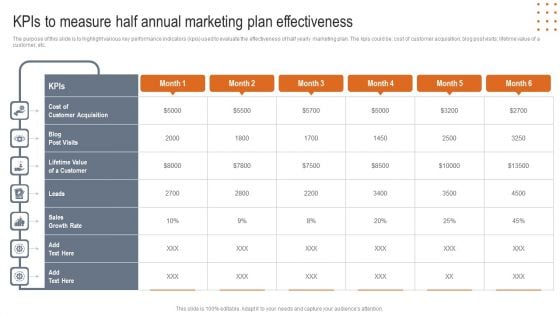
Kpis To Measure Half Annual Marketing Plan Effectiveness Designs PDF
The purpose of this slide is to highlight various key performance indicators kpis used to evaluate the effectiveness of half yearly marketing plan. The kpis could be cost of customer acquisition blog post visits lifetime value of a customer etc. Pitch your topic with ease and precision using this Kpis To Measure Half Annual Marketing Plan Effectiveness Designs PDF. This layout presents information on Customer Acquisition, Lifetime Value Customer, Growth Rate. It is also available for immediate download and adjustment. So, changes can be made in the color, design, graphics or any other component to create a unique layout.


 Continue with Email

 Home
Home


