Revenue Growth
Business Progress Upward Arrow Graph Vector Icon Ppt Powerpoint Presentation Model Images
This is a business progress upward arrow graph vector icon ppt powerpoint presentation model images. This is a four stage process. The stages in this process are market growth, market opportunity, market profitability.

Investment Strategies For Stock Portfolio Management Ppt PowerPoint Presentation Complete Deck With Slides
This is a investment strategies for stock portfolio management ppt powerpoint presentation complete deck with slides. This is a one stage process. The stages in this process are portfolio, management, business, growth, strategy.
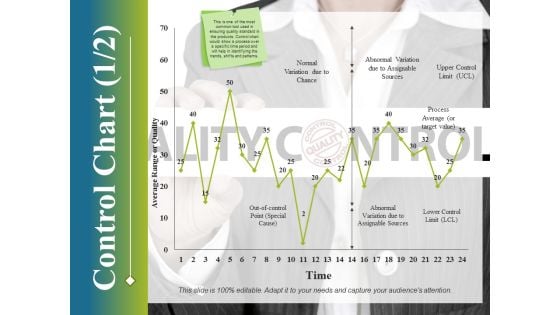
Control Chart Template 1 Ppt PowerPoint Presentation Infographic Template Deck
This is a control chart template 1 ppt powerpoint presentation infographic template deck. This is a one stage process. The stages in this process are control chart, growth, finance, marketing, strategy, business.
Control Chart Template 2 Ppt PowerPoint Presentation Icon Mockup
This is a control chart template 2 ppt powerpoint presentation icon mockup. This is a one stage process. The stages in this process are control chart, growth, finance, marketing, strategy, business.
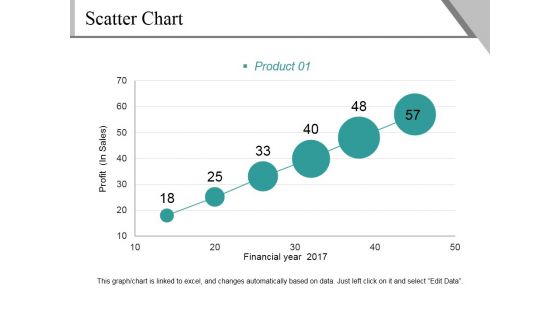
Scatter Chart Ppt PowerPoint Presentation File Background Image
This is a scatter chart ppt powerpoint presentation file background image. This is a six stage process. The stages in this process are profit, financial year, product, growth, success.
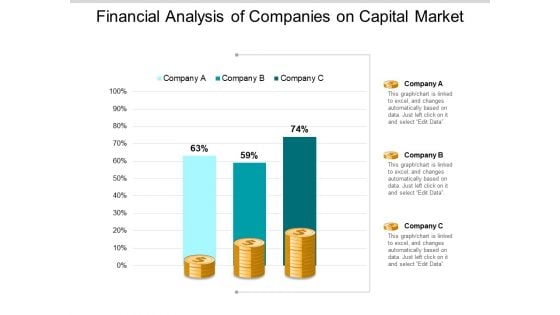
Financial Analysis Of Companies On Capital Market Ppt PowerPoint Presentation Show Background
This is a financial analysis of companies on capital market ppt powerpoint presentation show background. This is a three stage process. The stages in this process are stock market, financial markets, bull market.
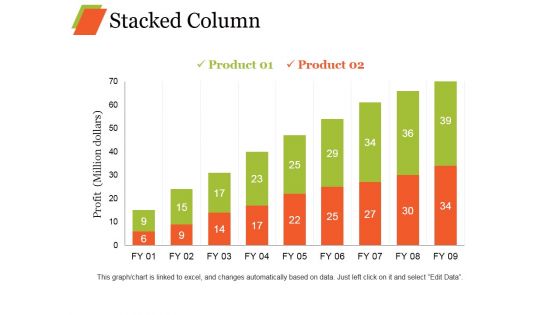
Stacked Column Ppt PowerPoint Presentation Inspiration Templates
This is a stacked column ppt powerpoint presentation inspiration templates. This is a two stage process. The stages in this process are product, profit, success, growth, business.
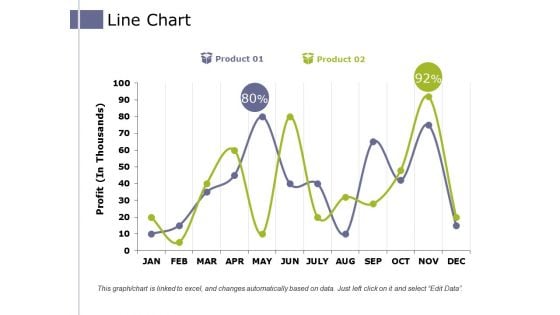
Line Chart Ppt PowerPoint Presentation Pictures Example Introduction
This is a line chart ppt powerpoint presentation pictures example introduction. This is a two stage process. The stages in this process are product, profit, business, growth, success.
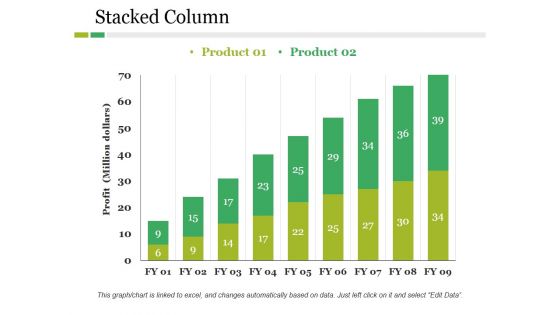
Stacked Column Ppt PowerPoint Presentation Pictures Outfit
This is a stacked column ppt powerpoint presentation pictures outfit. This is a two stage process. The stages in this process are product, profit, growth, bar graph, success.
Net Working Capital Analysis Icons Slide Technology Finance Ppt PowerPoint Presentation Diagram Images
Presenting this set of slides with name net working capital analysis icons slide technology finance ppt powerpoint presentation diagram images. The topics discussed in these slides are growth, measure, technology, business, management. This is a completely editable PowerPoint presentation and is available for immediate download. Download now and impress your audience.

Clustered Bar Ppt PowerPoint Presentation File Inspiration
This is a clustered bar ppt powerpoint presentation file inspiration. This is a two stage process. The stages in this process are product, profit, growth, success, graph.
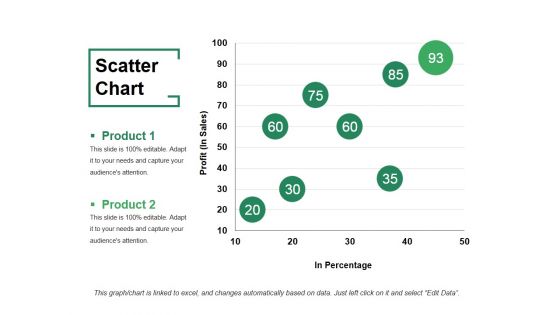
Scatter Chart Ppt PowerPoint Presentation File Visuals
This is a scatter chart ppt powerpoint presentation file visuals. This is a two stage process. The stages in this process are product, profit, in percentage, growth, success.
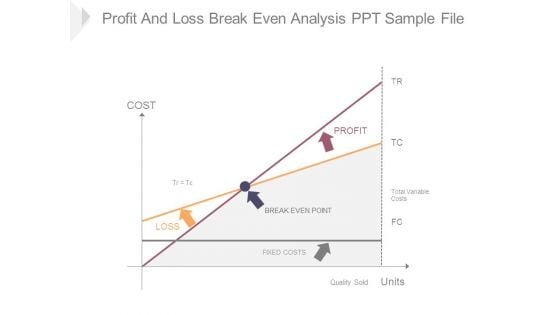
Profit And Loss Break Even Analysis Ppt Sample File
This is a profit and loss break even analysis ppt sample file. This is a two stage process. The stages in this process are cost, loss, profit, fixed costs, break even point, quantity sold, units, total variable costs.

Line Chart Ppt PowerPoint Presentation Pictures Maker
This is a line chart ppt powerpoint presentation pictures maker. This is a two stage process. The stages in this process are financial years, product, growth, success.
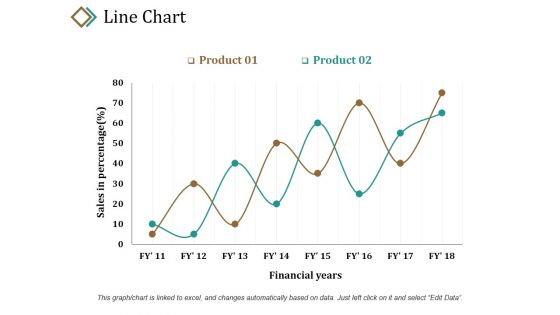
Line Chart Ppt PowerPoint Presentation Layouts Example
This is a line chart ppt powerpoint presentation layouts example. This is a two stage process. The stages in this process are sales in percentage, product, financial years, growth, success.
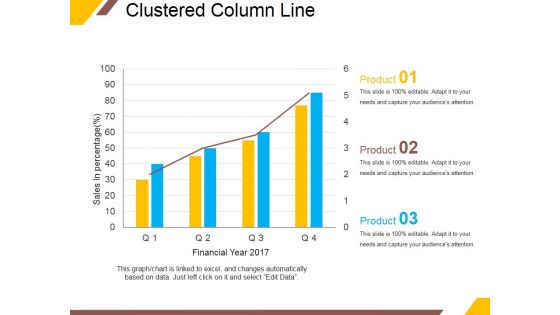
Clustered Column Line Ppt PowerPoint Presentation Portfolio Outline
This is a clustered column line ppt powerpoint presentation portfolio outline. This is a four stage process. The stages in this process are sales in percentage, financial year, product, graph, growth.
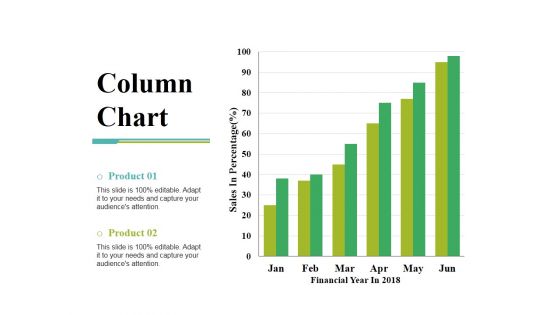
Column Chart Ppt PowerPoint Presentation Gallery Slide Portrait
This is a column chart ppt powerpoint presentation gallery slide portrait. This is a two stage process. The stages in this process are sales in percentage, financial year, product, bar graph, growth.

Line Chart Ppt PowerPoint Presentation Show Guide
This is a line chart ppt powerpoint presentation show guide. This is a two stage process. The stages in this process are product, sales in percentage, financial years, growth, success.
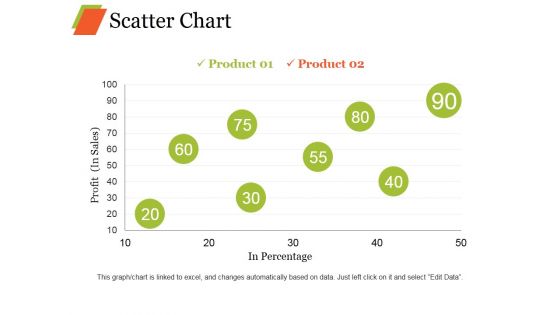
Scatter Chart Ppt PowerPoint Presentation Professional Graphic Images
This is a scatter chart ppt powerpoint presentation professional graphic images. This is a eight stage process. The stages in this process are product, profit, in percentage growth, business.
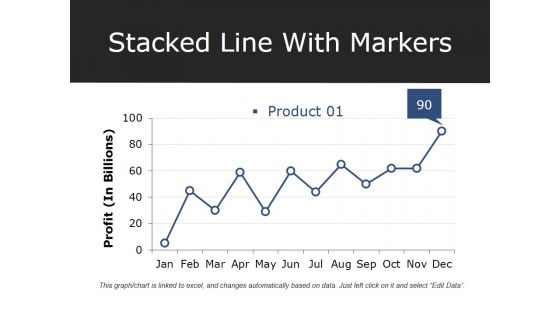
Stacked Line With Markers Ppt PowerPoint Presentation Professional Deck
This is a stacked line with markers ppt powerpoint presentation professional deck. This is a one stage process. The stages in this process are product, profit, growth, success, graph.
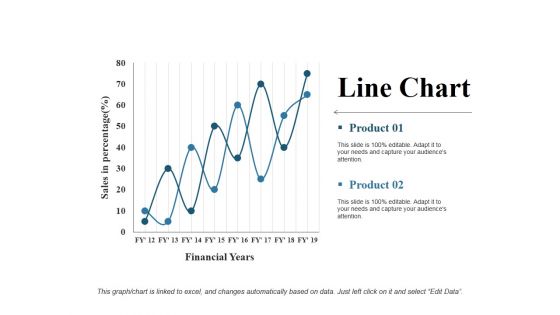
Line Chart Ppt PowerPoint Presentation Gallery Rules
This is a line chart ppt powerpoint presentation gallery rules. This is a two stage process. The stages in this process are financial years, product, sales in percentage, line chart, growth.
Seven Obstacles That Prevent Success Financial Management And Compliance Ppt PowerPoint Presentation Icon Examples
Presenting this set of slides with name seven obstacles that prevent success financial management and compliance ppt powerpoint presentation icon examples. The topics discussed in these slides are 7 challenges, increasing profits, 7 dares. This is a completely editable PowerPoint presentation and is available for immediate download. Download now and impress your audience.
Working Capital Computation Steps Chart Inventory Sales Ppt PowerPoint Presentation Icon Gallery
Presenting this set of slides with name working capital computation steps chart inventory sales ppt powerpoint presentation icon gallery. The topics discussed in these slides are assumptions, business, planning, strategy, marketing. This is a completely editable PowerPoint presentation and is available for immediate download. Download now and impress your audience.
Green Upward Arrow With Gold Bricks Vector Icon Ppt PowerPoint Presentation Professional Files
Presenting this set of slides with name green upward arrow with gold bricks vector icon ppt powerpoint presentation professional files. This is a one stage process. The stages in this process are gold bar, gold investment, financial growth. This is a completely editable PowerPoint presentation and is available for immediate download. Download now and impress your audience.
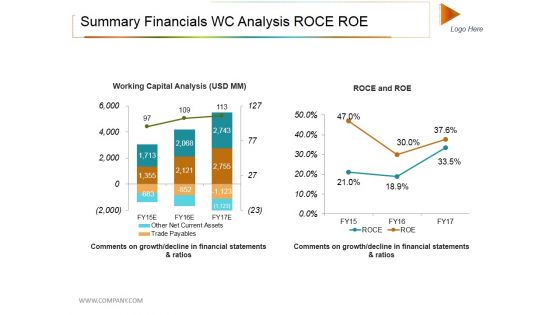
Summary Financials Wc Analysis Roce Roe Ppt PowerPoint Presentation Show Summary
This is a summary financials wc analysis roce roe ppt powerpoint presentation show summary. This is a two stage process. The stages in this process are working capital analysis, roce and roe, trade payable.
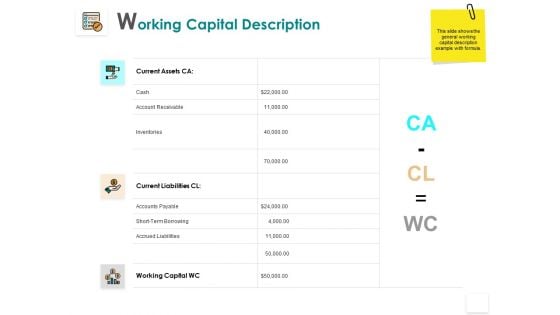
Working Capital Description Liabilities Receivable Ppt PowerPoint Presentation Inspiration Shapes
Presenting this set of slides with name working capital description liabilities receivable ppt powerpoint presentation inspiration shapes. The topics discussed in these slides are liabilities, increase, business, planning, strategy. This is a completely editable PowerPoint presentation and is available for immediate download. Download now and impress your audience.
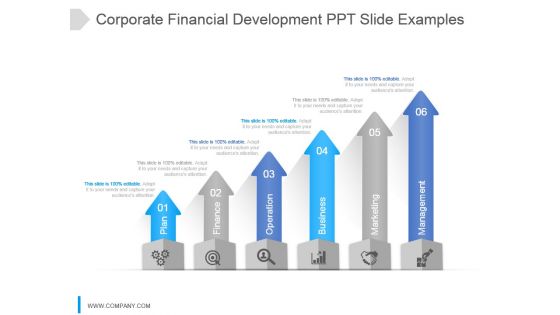
Corporate Financial Development Ppt Slide Examples
This is a corporate financial development ppt slide examples. This is a six stage process. The stages in this process are plan, finance, operation, business, marketing, management.
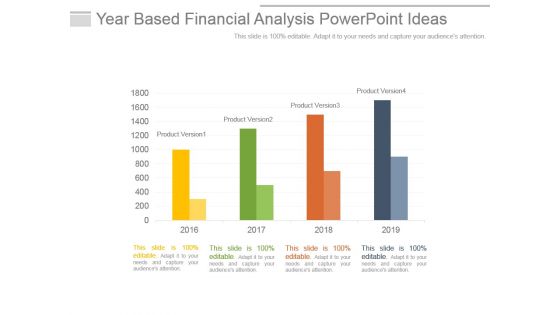
Year Based Financial Analysis Powerpoint Ideas
This is a year based financial analysis powerpoint ideas. This is a four stage process. The stages in this process are success, business, strategy, planning, management.

Objectives Of Financial Management Ppt Ideas
This is a objectives of financial management ppt ideas. This is a six stage process. The stages in this process are salaries, hst filing, account payable, financial management, accounts receivable, cash flow analysis.
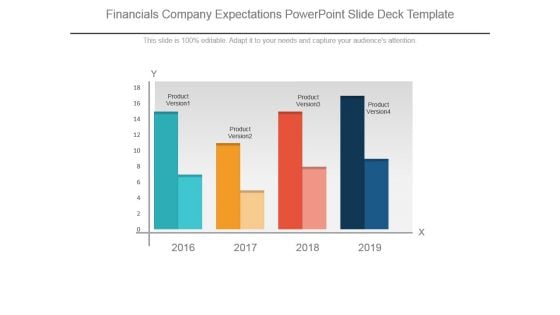
Financials Company Expectations Powerpoint Slide Deck Template
This is a financials company expectations powerpoint slide deck template. This is a four stage process. The stages in this process are product version.
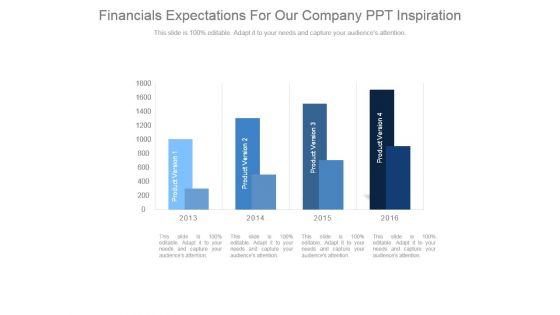
Financials Expectations For Our Company Ppt Inspiration
This is a financials expectations for our company ppt inspiration. This is a four stage process. The stages in this process are product version.
Scatter Bubble Chart Ppt PowerPoint Presentation Icon Elements
This is a scatter bubble chart ppt powerpoint presentation icon elements. This is a six stage process. The stages in this process are highest profit, profit, financial year, product.

Working Capital Optimization Strategy Visibility Ppt PowerPoint Presentation Visual Aids Layouts
Presenting this set of slides with name working capital optimization strategy visibility ppt powerpoint presentation visual aids layouts. The topics discussed in these slides are operational, capital, strategy, visibility, control. This is a completely editable PowerPoint presentation and is available for immediate download. Download now and impress your audience.
Monthly Working Capital Calculation Table Inventory Strategy Ppt PowerPoint Presentation Icon Picture
Presenting this set of slides with name monthly working capital calculation table inventory strategy ppt powerpoint presentation icon picture. The topics discussed in these slides are inventory, receivable, marketing, management, strategy. This is a completely editable PowerPoint presentation and is available for immediate download. Download now and impress your audience.
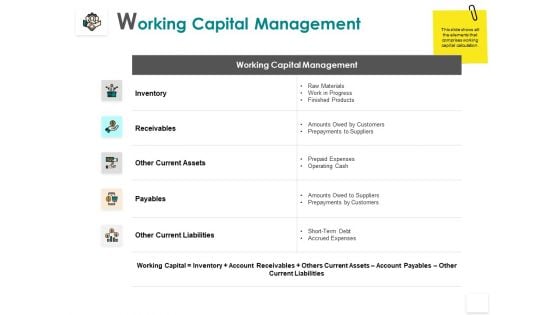
Working Capital Management Inventory Receivables Ppt PowerPoint Presentation Infographic Template Slides
Presenting this set of slides with name working capital management inventory receivables ppt powerpoint presentation infographic template slides. The topics discussed in these slides are inventory, receivable, marketing, management, strategy. This is a completely editable PowerPoint presentation and is available for immediate download. Download now and impress your audience.
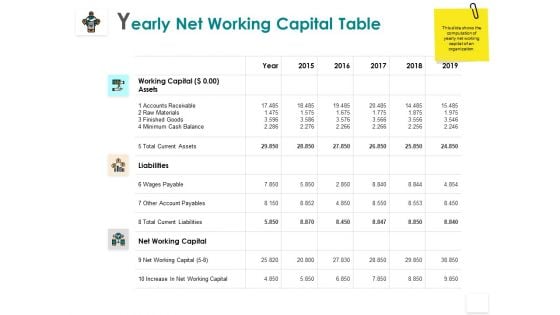
Yearly Net Working Capital Table Liabilities Minimum Ppt PowerPoint Presentation Infographic Template Diagrams
Presenting this set of slides with name yearly net working capital table liabilities minimum ppt powerpoint presentation infographic template diagrams. The topics discussed in these slides are liabilities, increase, business, planning, strategy. This is a completely editable PowerPoint presentation and is available for immediate download. Download now and impress your audience.
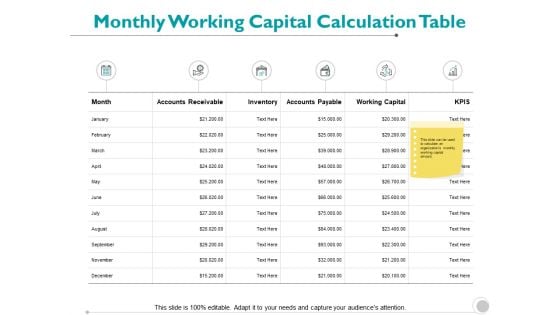
Monthly Working Capital Calculation Table Inventory Strategy Ppt PowerPoint Presentation Slides Summary
Presenting this set of slides with name monthly working capital calculation table inventory strategy ppt powerpoint presentation slides summary. The topics discussed in these slides are inventory, receivable, marketing, management, strategy. This is a completely editable PowerPoint presentation and is available for immediate download. Download now and impress your audience.
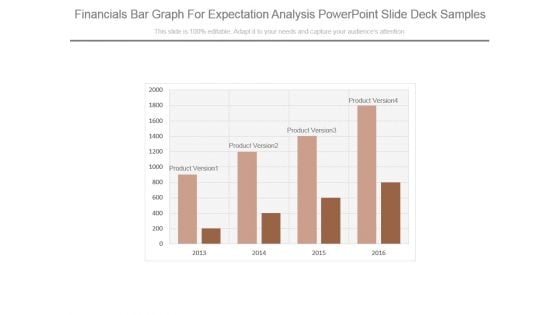
Financials Bar Graph For Expectation Analysis Powerpoint Slide Deck Samples
This is a financials bar graph for expectation analysis powerpoint slide deck samples. This is a four stage process. The stages in this process are product version.
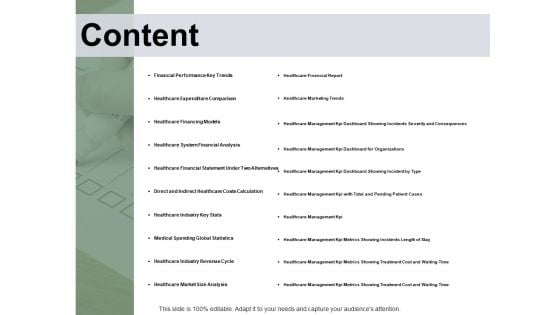
Content Financial Analysis Ppt PowerPoint Presentation Portfolio Portrait
Presenting this set of slides with name content financial analysis ppt powerpoint presentation portfolio portrait. The topics discussed in these slides are financial, analysis, costs, calculation, comparison. This is a completely editable PowerPoint presentation and is available for immediate download. Download now and impress your audience.
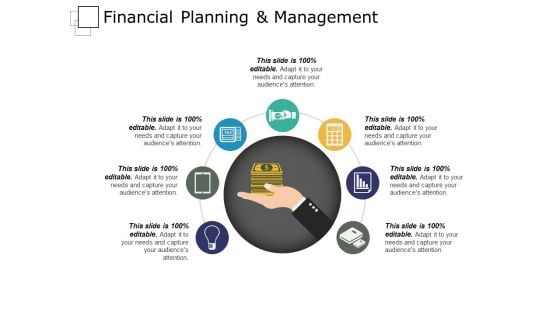
Financial Planning And Management Ppt PowerPoint Presentation Infographic Template Slideshow
This is a financial planning and management ppt powerpoint presentation infographic template slideshow. This is a seven stage process. The stages in this process are support, assistance, hand holding.
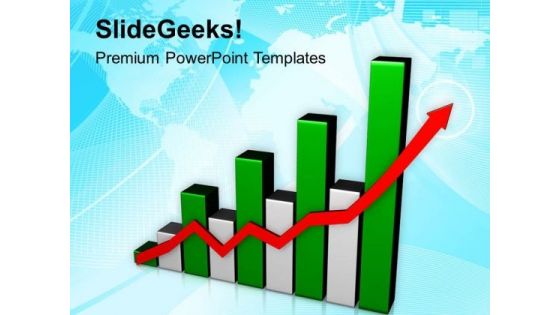
Business Development And Strategy PowerPoint Templates Ppt Backgrounds For Slides 0513
Give your audience their due. Meet their aspirations with our Business Development And Strategy PowerPoint Templates PPT Backgrounds For Slides. Blend your views with our business PowerPoint Templates. They are made for each other. Our marketing PowerPoint Templates are duly appointed. They have all the facets you require. Endure setbacks with our Business Development And Strategy PowerPoint Templates Ppt Backgrounds For Slides 0513. Download without worries with our money back guaranteee.
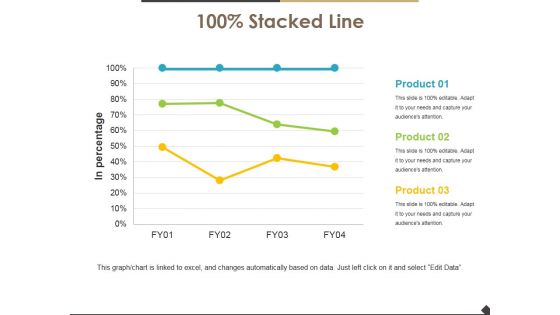
Stacked Line Ppt PowerPoint Presentation Show Templates
This is a stacked line ppt powerpoint presentation show templates. This is a three stage process. The stages in this process are stacked line, in percentage, finance, marketing, business.
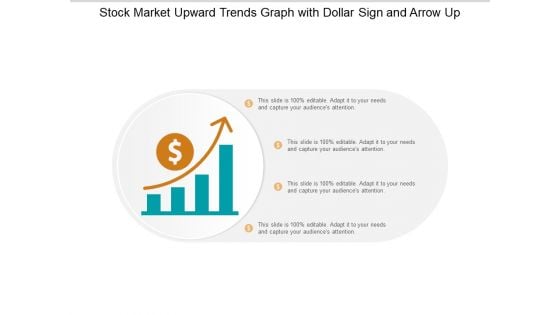
Stock Market Upward Trends Graph With Dollar Sign And Arrow Up Ppt PowerPoint Presentation Professional Graphics Download
This is a stock market upward trends graph with dollar sign and arrow up ppt powerpoint presentation professional graphics download. This is a four stage process. The stages in this process are stock market, financial markets, bull market.

Development Ring For Business Strategy PowerPoint Templates Ppt Backgrounds For Slides 0513
Be your own editor with our Development Ring For Business Strategy PowerPoint Templates PPT Backgrounds For Slides. Align your thoughts as per your wishes. Land the idea with our Leadership PowerPoint Templates. Help it grow with your thoughts. Cover the compass with our Spheres PowerPoint Templates. Your ideas will be acceptable to all. Form plans with our Development Ring For Business Strategy PowerPoint Templates Ppt Backgrounds For Slides 0513. Download without worries with our money back guaranteee.

Stakeholders Fund And Market Analysis Bar Graph Powerpoint Slide Information
This is a stakeholders fund and market analysis bar graph powerpoint slide information. This is a five stage process. The stages in this process are shareholders funds, market capitalization, market capitalization as a percentage of cse market capitalization.
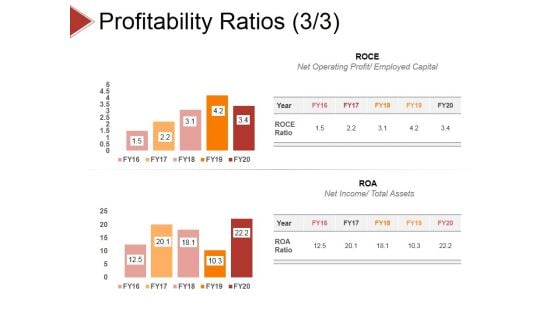
Profitability Ratios Template 2 Ppt PowerPoint Presentation Infographics Layouts
This is a profitability ratios template 2 ppt powerpoint presentation infographics layouts. This is a two stage process. The stages in this process are price to earning ratio, earning per share, market value price per share.
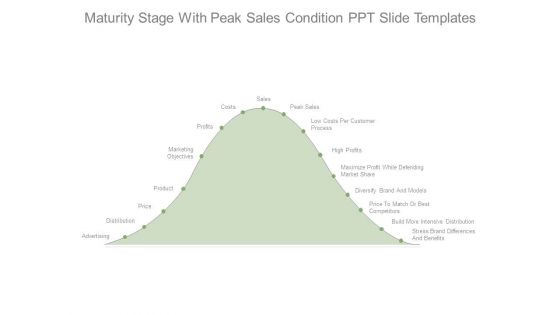
Maturity Stage With Peak Sales Condition Ppt Slide Templates
This is a maturity stage with peak sales condition ppt slide templates. This is a one stage process. The stages in this process are advertising, distribution, price, product, marketing objectives, profits, costs, sales, peak sales, low costs per customer process, high profits, maximize profit while defending market share, diversify brand and models, price to match or best competitors, build more intensive distribution, stress brand differences and benefits.
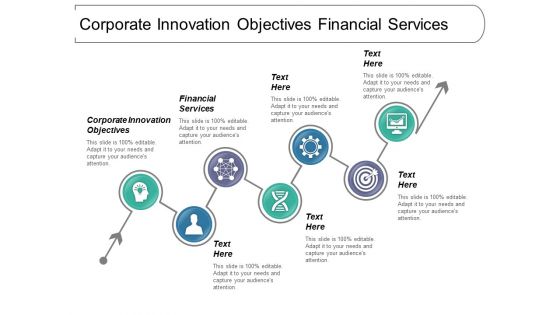
Corporate Innovation Objectives Financial Services Ppt PowerPoint Presentation Styles Design Inspiration
This is a corporate innovation objectives financial services ppt powerpoint presentation styles design inspiration. This is a seven stage process. The stages in this process are corporate innovation objectives, financial services.
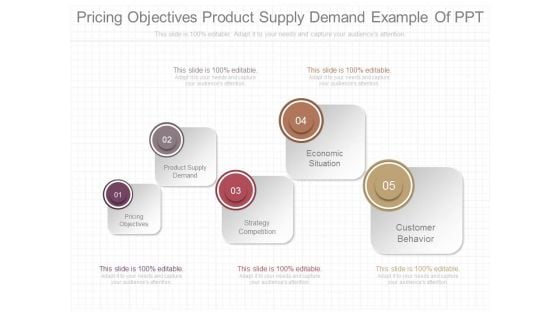
Pricing Objectives Product Supply Demand Example Of Ppt
This is a pricing objectives product supply demand example of ppt. This is a five stage process. The stages in this process are pricing objectives, product supply demand, strategy competition, economic situation, customer behavior.
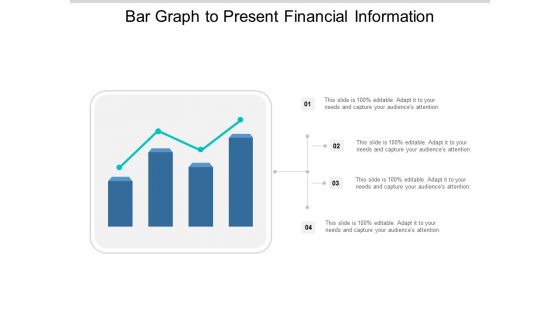
Bar Graph To Present Financial Information Ppt PowerPoint Presentation Show Tips
This is a bar graph to present financial information ppt powerpoint presentation show tips. This is a four stage process. The stages in this process are stock market, financial markets, bull market.
Histogram Financial Analysis Vector Icon Ppt PowerPoint Presentation Layouts File Formats Cpb
This is a histogram financial analysis vector icon ppt powerpoint presentation layouts file formats cpb. This is a three stage process. The stages in this process are bar chart icon, bar graph icon, data chart icon.
Histogram With Dollar For Financial Success Vector Icon Ppt PowerPoint Presentation Portfolio Example File Cpb
This is a histogram with dollar for financial success vector icon ppt powerpoint presentation portfolio example file cpb. This is a three stage process. The stages in this process are bar chart icon, bar graph icon, data chart icon.
Three Bars For Financial Analysis Vector Icon Ppt PowerPoint Presentation Pictures Background Cpb
This is a three bars for financial analysis vector icon ppt powerpoint presentation pictures background cpb. This is a three stage process. The stages in this process are bar chart icon, bar graph icon, data chart icon.
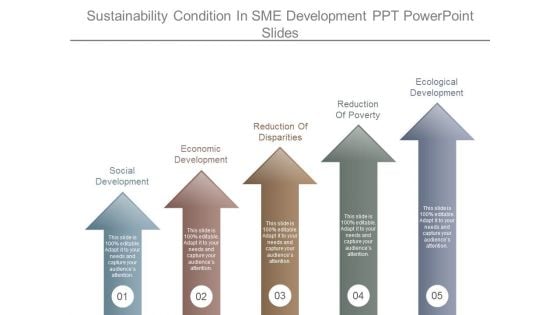
Sustainability Condition In Sme Development Ppt Powerpoint Slides
This is a sustainability condition in sme development ppt powerpoint slides. This is a five stage process. The stages in this process are social development, economic development, reduction of disparities, reduction of poverty, ecological development.
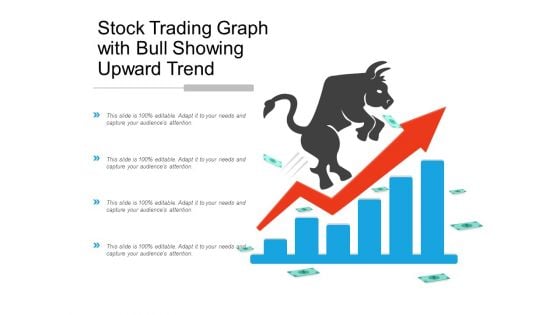
Stock Trading Graph With Bull Showing Upward Trend Ppt Powerpoint Presentation Pictures Outfit
This is a stock trading graph with bull showing upward trend ppt powerpoint presentation pictures outfit. This is a four stage process. The stages in this process are stock market, financial market, bull market.
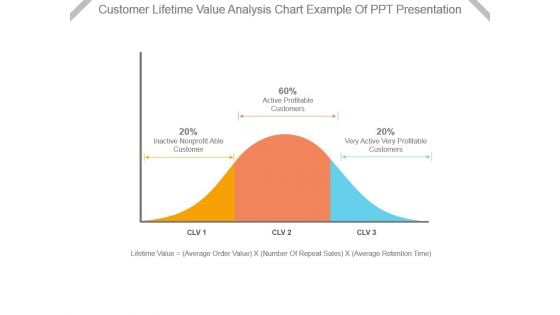
Customer Lifetime Value Analysis Chart Example Of Ppt Presentation
This is a customer lifetime value analysis chart example of ppt presentation. This is a three stage process. The stages in this process are inactive nonprofit able customer, active profitable customers, very active very profitable customers, lifetime value, average order value, number of repeat sales, average retention time.
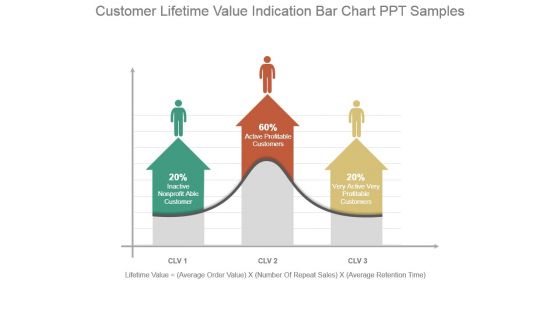
Customer Lifetime Value Indication Bar Chart Ppt Samples
This is a customer lifetime value indication bar chart ppt samples. This is a three stage process. The stages in this process are inactive nonprofit able customer, active profitable customers, very active very profitable customers, lifetime value, average order value, number of repeat sales, average retention time.
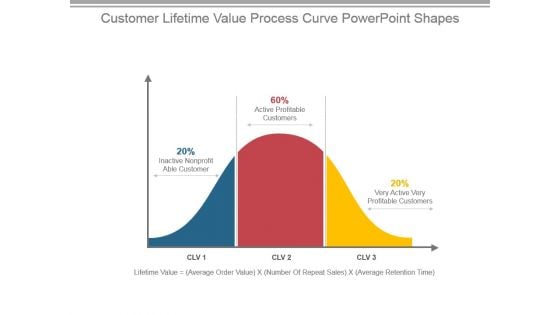
Customer Lifetime Value Process Curve Powerpoint Shapes
This is a customer lifetime value process curve powerpoint shapes. This is a three stage process. The stages in this process are inactive nonprofit able customer, active profitable customers, very active very profitable customers, lifetime value, average order value, number of repeat sales, average retention time.
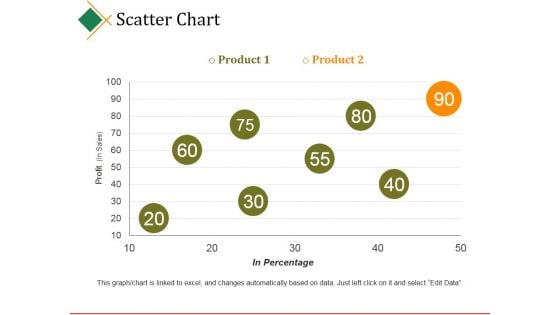
Scatter Chart Ppt PowerPoint Presentation Model
This is a scatter chart ppt powerpoint presentation model. This is a two stage process. The stages in this process are business, product, profit, in percentage, business.
Line Chart Ppt PowerPoint Presentation Icon Example
This is a line chart ppt powerpoint presentation icon example. This is a two stage process. The stages in this process are products, profit, line chart, business, marketing.


 Continue with Email

 Home
Home


