Revenue Growth
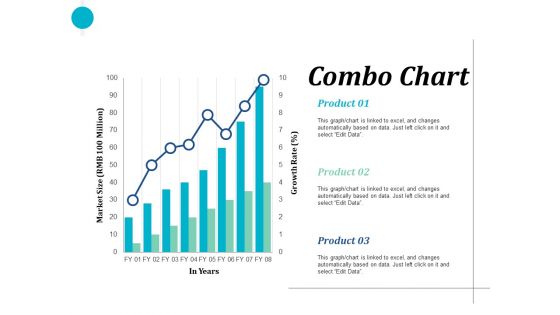
Combo Chart Finance Ppt PowerPoint Presentation Clipart
This is a combo chart finance ppt powerpoint presentation pictures show. This is a two stage process. The stages in this process are finance, marketing, management, investment, analysis.
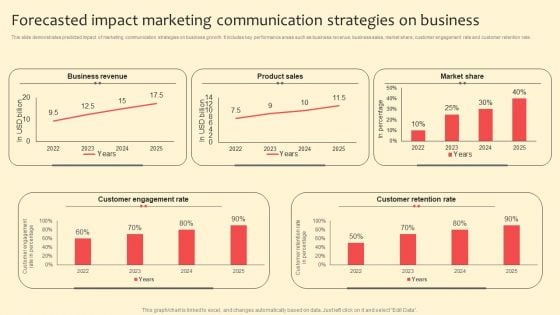
Forecasted Impact Marketing Communication Strategies On Business Structure PDF
This slide demonstrates predicted impact of marketing communication strategies on business growth. It includes key performance areas such as business revenue, business sales, market share, customer engagement rate and customer retention rate. Boost your pitch with our creative Forecasted Impact Marketing Communication Strategies On Business Structure PDF. Deliver an awe inspiring pitch that will mesmerize everyone. Using these presentation templates you will surely catch everyones attention. You can browse the ppts collection on our website. We have researchers who are experts at creating the right content for the templates. So you do not have to invest time in any additional work. Just grab the template now and use them.
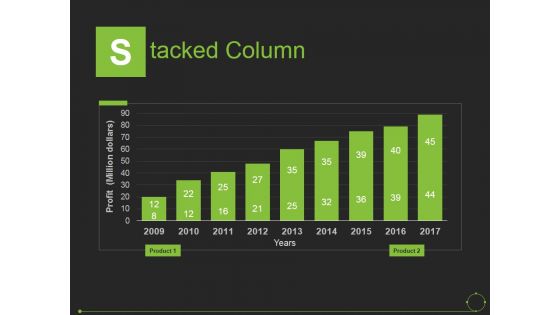
Stacked Column Ppt PowerPoint Presentation Slides Introduction
This is a stacked column ppt powerpoint presentation slides introduction. This is a nine stage process. The stages in this process are years, profit, product, business, marketing.
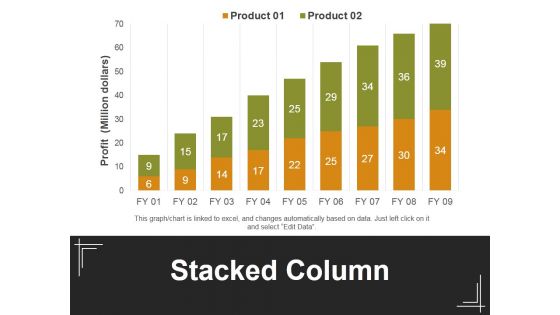
Stacked Column Ppt PowerPoint Presentation Outline Maker
This is a stacked column ppt powerpoint presentation outline maker. This is a two stage process. The stages in this process are profit, stacked bar, product, business, marketing.
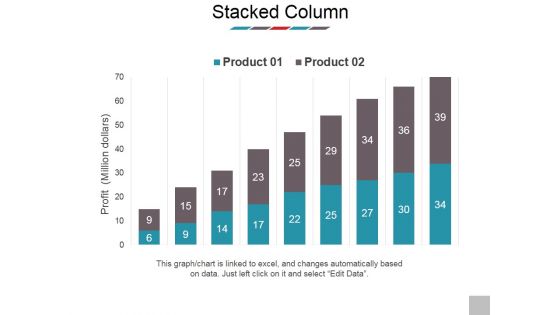
Stacked Column Ppt PowerPoint Presentation Professional Deck
This is a stacked column ppt powerpoint presentation professional deck. This is a two stage process. The stages in this process are profit, business, marketing, presentation, product.
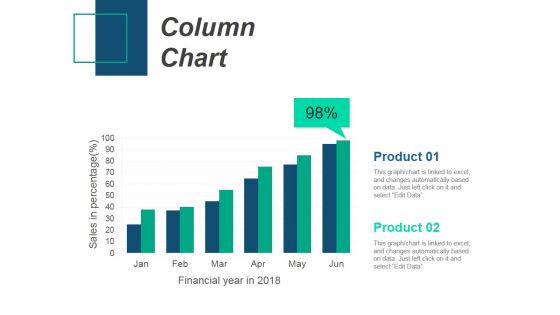
Column Chart Ppt PowerPoint Presentation Gallery Design Inspiration
This is a column chart ppt powerpoint presentation gallery design inspiration. This is a two stage process. The stages in this process are column chart, product, sales in percentage, financial years.
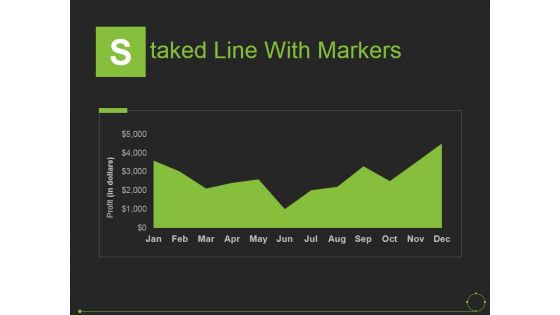
Staked Line With Markers Ppt PowerPoint Presentation Pictures Examples
This is a staked line with markers ppt powerpoint presentation pictures examples. This is a one stage process. The stages in this process are years, profit, product, business, marketing.
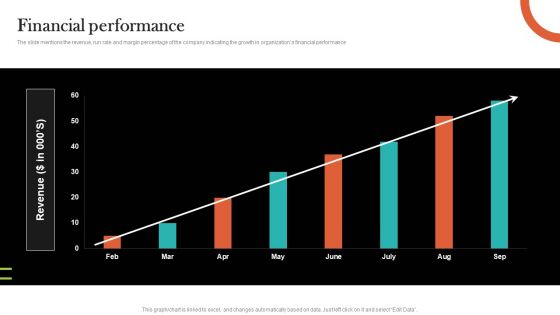
Video Promotion Service Investor Funding Elevator Pitch Deck Financial Performance Professional PDF
The slide mentions the revenue, run rate and margin percentage of the company indicating the growth in organizations financial performance Slidegeeks is here to make your presentations a breeze with Video Promotion Service Investor Funding Elevator Pitch Deck Financial Performance Professional PDF With our easy to use and customizable templates, you can focus on delivering your ideas rather than worrying about formatting. With a variety of designs to choose from, you are sure to find one that suits your needs. And with animations and unique photos, illustrations, and fonts, you can make your presentation pop. So whether you are giving a sales pitch or presenting to the board, make sure to check out Slidegeeks first.
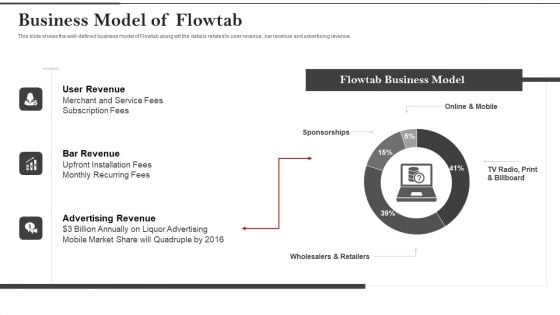
Flowtab Venture Capital Investment Business Model Of Flowtab Elements PDF
This slide shows the well defined business model of Flowtab along wit the details related to user revenue, bar revenue and advertising revenue. This is a flowtab venture capital investment business model of flowtab elements pdf template with various stages. Focus and dispense information on three stages using this creative set, that comes with editable features. It contains large content boxes to add your information on topics like user revenue, bar revenue, advertising revenue. You can also showcase facts, figures, and other relevant content using this PPT layout. Grab it now.
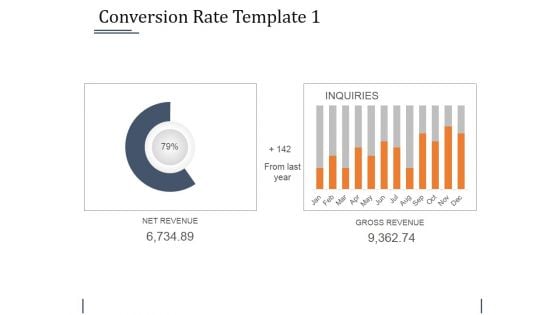
Conversion Rate Template 1 Ppt PowerPoint Presentation Styles
This is a conversion rate template 1 ppt powerpoint presentation styles. This is a two stage process. The stages in this process are net revenue, gross revenue.
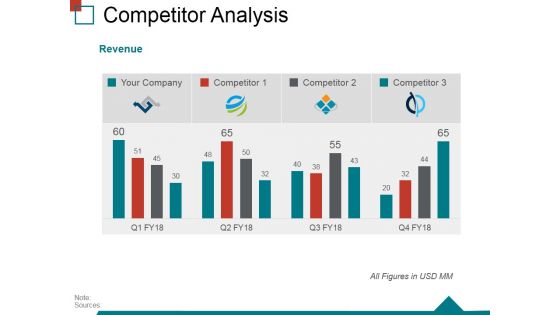
Competitor Analysis Template 4 Ppt PowerPoint Presentation Ideas Graphics Example
This is a competitor analysis template 4 ppt powerpoint presentation ideas graphics example. This is a four stage process. The stages in this process are revenue, your company, market share, competitor, analysis.
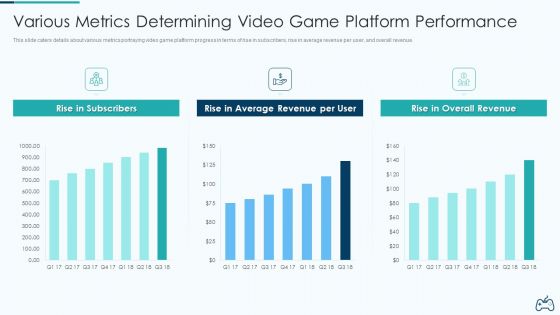
Electronic Game Pitch Deck Various Metrics Determining Video Game Platform Performance Designs PDF
This slide caters details about various metrics portraying video game platform progress in terms of rise in subscribers, rise in average revenue per user, and overall revenue. Deliver an awe inspiring pitch with this creative electronic game pitch deck various metrics determining video game platform performance designs pdf bundle. Topics like rise in subscribers, average revenue, overall revenue can be discussed with this completely editable template. It is available for immediate download depending on the needs and requirements of the user.
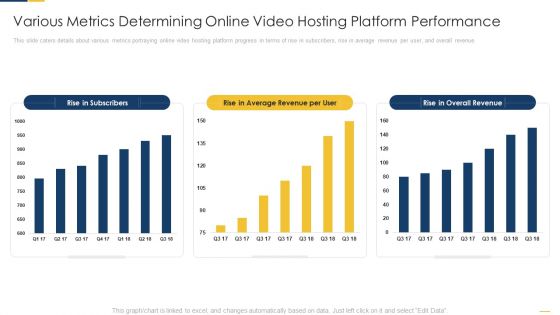
Various Metrics Determining Online Video Hosting Platform Performance Slides PDF
This slide caters details about various metrics portraying online video hosting platform progress in terms of rise in subscribers, rise in average revenue per user, and overall revenue. Deliver an awe inspiring pitch with this creative various metrics determining online video hosting platform performance slides pdf bundle. Topics like rise in subscribers, average revenue, overall revenue can be discussed with this completely editable template. It is available for immediate download depending on the needs and requirements of the user.
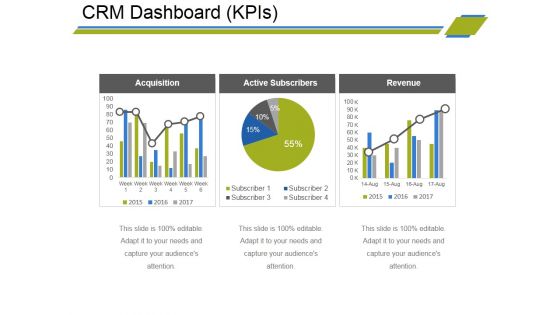
Crm Dashboard Kpis Ppt PowerPoint Presentation Inspiration Brochure
This is a crm dashboard kpis ppt powerpoint presentation inspiration brochure. This is a three stage process. The stages in this process are acquisition, active subscribers, revenue.
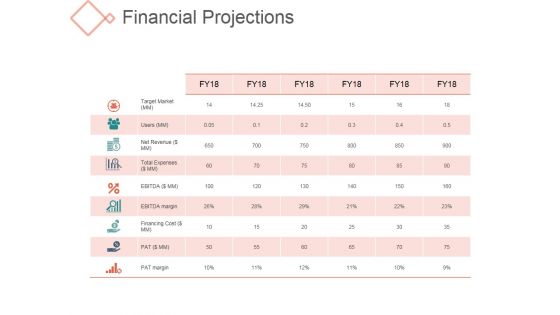
Financial Projections Ppt PowerPoint Presentation Images
This is a financial projections ppt powerpoint presentation images. This is a three stage process. The stages in this process are pat margin, target market, users, net revenue.
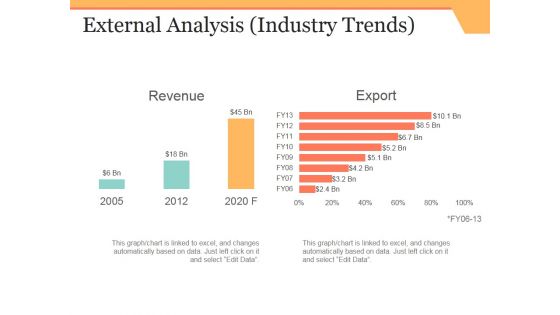
External Analysis Template 2 Ppt PowerPoint Presentation Pictures Grid
This is a external analysis template 2 ppt powerpoint presentation pictures grid. This is a two stage process. The stages in this process are revenue, export.
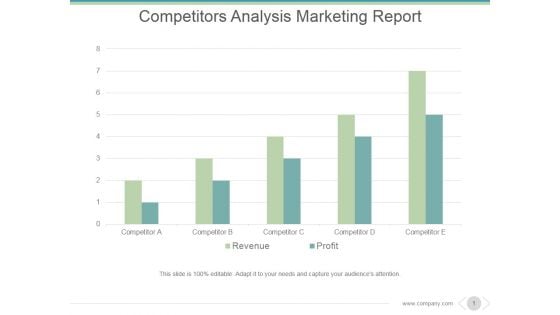
Competitors Analysis Marketing Report Ppt PowerPoint Presentation Tips
This is a competitors analysis marketing report ppt powerpoint presentation tips. This is a five stage process. The stages in this process are competitor, revenue, profit.
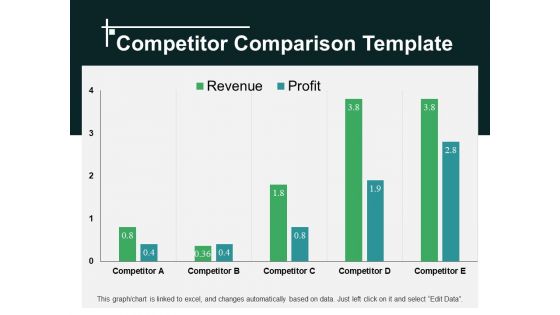
Competitor Comparison Template 2 Ppt PowerPoint Presentation Show Design Ideas
This is a competitor comparison template 2 ppt powerpoint presentation show design ideas. This is a four stage process. The stages in this process are competitor, profit, revenue.
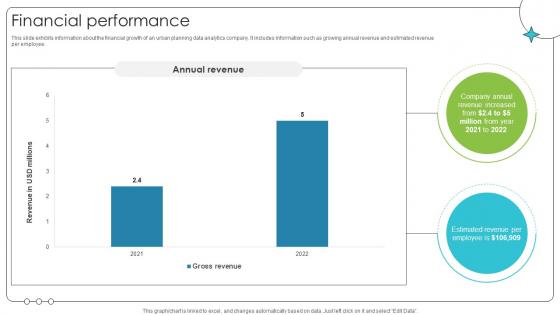
Financial Performance Investor Oriented Urbanlogiq Fundraising Deck
This slide exhibits information about the financial growth of an urban planning data analytics company. It includes information such as growing annual revenue and estimated revenue per employee. Present like a pro with Financial Performance Investor Oriented Urbanlogiq Fundraising Deck. Create beautiful presentations together with your team, using our easy-to-use presentation slides. Share your ideas in real-time and make changes on the fly by downloading our templates. So whether you are in the office, on the go, or in a remote location, you can stay in sync with your team and present your ideas with confidence. With Slidegeeks presentation got a whole lot easier. Grab these presentations today. This slide exhibits information about the financial growth of an urban planning data analytics company. It includes information such as growing annual revenue and estimated revenue per employee.
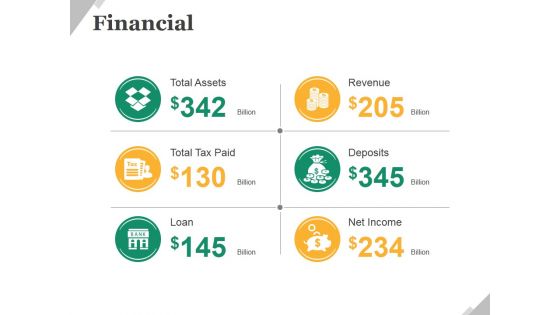
Financial Ppt PowerPoint Presentation File Format Ideas
This is a financial ppt powerpoint presentation file format ideas. This is a six stage process. The stages in this process are total assets, total tax paid, loan, revenue, deposits, net income.
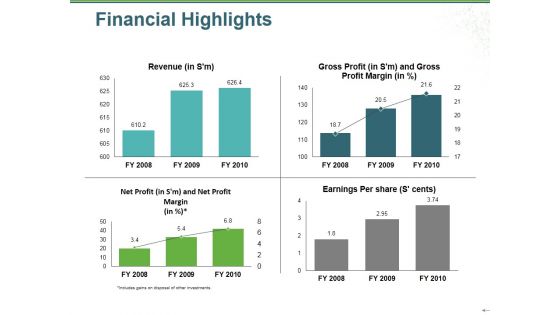
Financial Highlights Ppt PowerPoint Presentation Gallery Graphics Example
This is a financial highlights ppt powerpoint presentation gallery graphics example. This is a four stage process. The stages in this process are revenue, gross profit, net profit, earnings per share, bar graph.
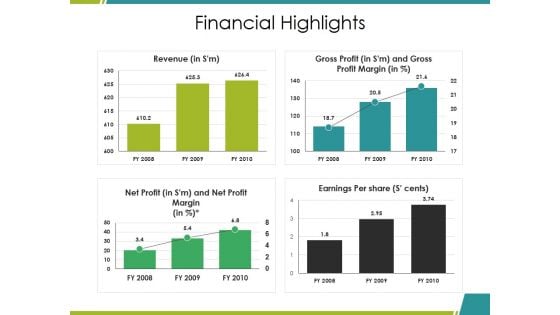
Financial Highlights Ppt PowerPoint Presentation Ideas Graphics Download
This is a financial highlights ppt powerpoint presentation ideas graphics download. This is a four stage process. The stages in this process are revenue, gross profit, net profit, earnings per share, bar graph.
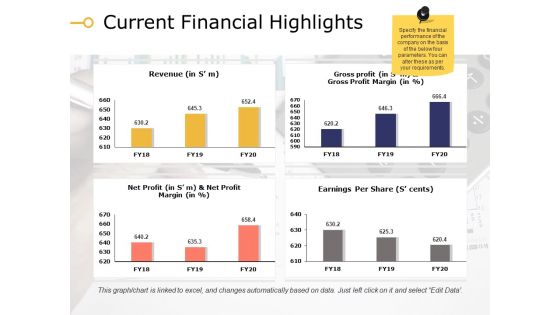
Current Financial Highlights Ppt PowerPoint Presentation File Demonstration
This is a current financial highlights ppt powerpoint presentation show example. This is a four stage process. The stages in this process are revenue, net profit, earnings per share, gross profit.
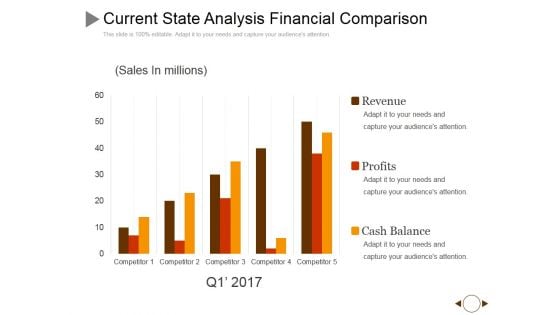
Current State Analysis Financial Comparison Ppt PowerPoint Presentation Inspiration Good
This is a current state analysis financial comparison ppt powerpoint presentation inspiration good. This is a five stage process. The stages in this process are revenue, profits, cash balance, competitor.
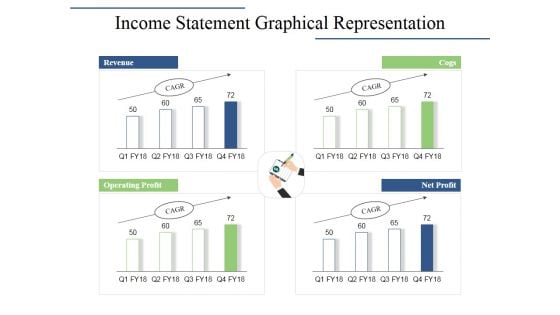
Income Statement Graphical Representation Ppt PowerPoint Presentation Infographics Layouts
This is a income statement graphical representation ppt powerpoint presentation infographics layouts. This is a four stage process. The stages in this process are revenue, cogs, operating profit, net profit.
Income Statement Overview Ppt PowerPoint Presentation Infographic Template Icon
This is a income statement overview ppt powerpoint presentation infographic template icon. This is a five stage process. The stages in this process are revenue, profit margin, operating profit margin.
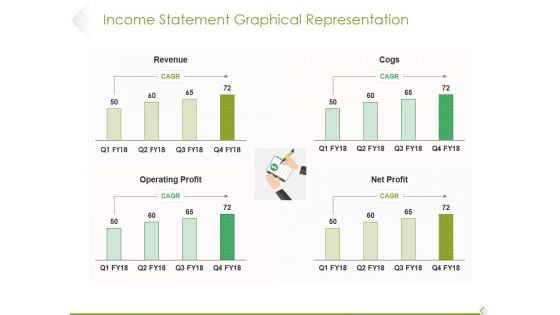
Income Statement Graphical Representation Ppt PowerPoint Presentation Infographic Template Influencers
This is a income statement graphical representation ppt powerpoint presentation infographic template influencers. This is a four stage process. The stages in this process are revenue, cogs, operating profit, profit.
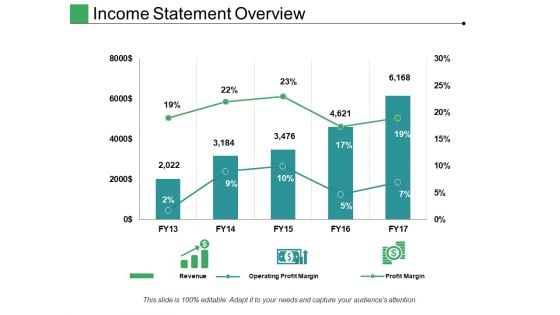
Income Statement Overview Ppt PowerPoint Presentation File Structure
This is a income statement overview ppt powerpoint presentation file structure. This is a five stage process. The stages in this process are revenue, operating profit margin, profit margin.
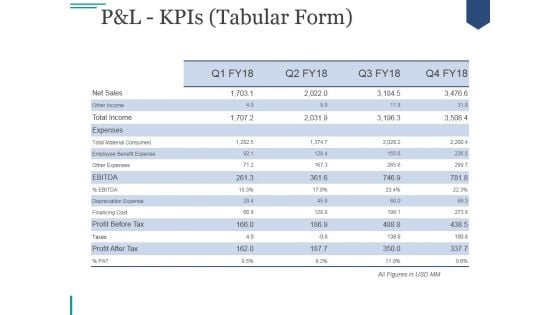
Pandl Kpis Tabular Form Ppt PowerPoint Presentation Visual Aids
This is a pandl kpis tabular form ppt powerpoint presentation visual aids. This is a four stage process. The stages in this process are revenue, cogs, operating profit, net profit.

Current State Analysis Financial Comparison Ppt Powerpoint Presentation File Graphic Tips
This is a current state analysis financial comparison ppt powerpoint presentation file graphic tips. This is a five stage process. The stages in this process are revenue, profits, cash balance.
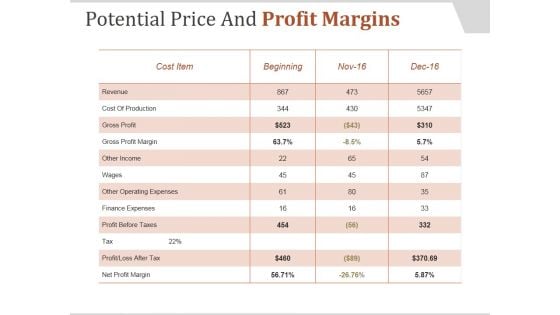
Potential Price And Profit Margins Ppt PowerPoint Presentation Design Templates
This is a potential price and profit margins ppt powerpoint presentation design templates. This is a three stage process. The stages in this process are cost item, beginning, revenue, cost of production, gross profit, gross profit margin, other income, wages.
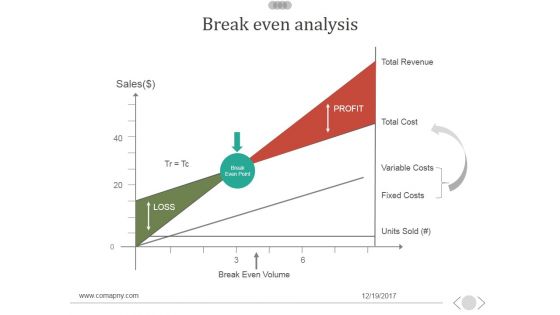
Break Even Analysis Ppt PowerPoint Presentation Design Templates
This is a break even analysis ppt powerpoint presentation design templates. This is a two stage process. The stages in this process are sales, break even volume, total revenue, loss, profit.
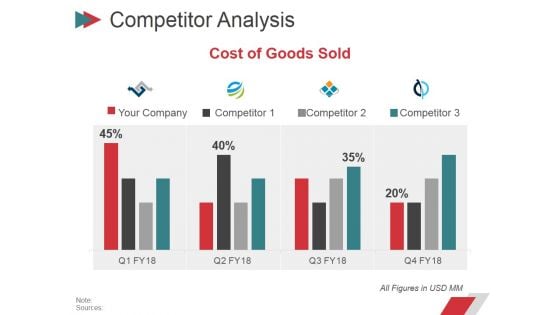
Competitor Analysis Template 1 Ppt PowerPoint Presentation Gallery Demonstration
This is a competitor analysis template 1 ppt powerpoint presentation gallery demonstration. This is a four stage process. The stages in this process are business, strategy, marketing, planning, your company, revenue.
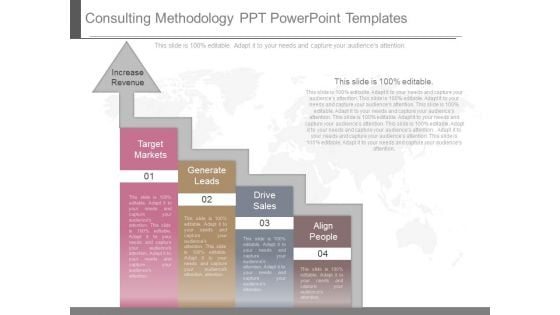
Consulting Methodology Ppt Powerpoint Templates
This is a consulting methodology ppt powerpoint templates. This is a four stage process. The stages in this process are target markets, increase revenue, generate leads, drive sales, align people.
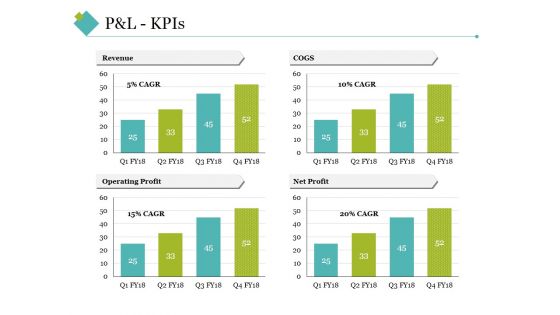
P And L Kpis Template 2 Ppt PowerPoint Presentation Inspiration Grid
This is a p and l kpis template 2 ppt powerpoint presentation inspiration grid. This is a four stage process. The stages in this process are revenue, cogs, operating profit, net profit.
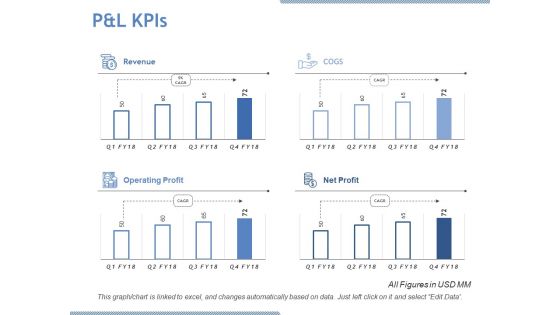
P And L Kpis Ppt PowerPoint Presentation Designs Download
This is a p and l kpis ppt powerpoint presentation designs download. This is a four stage process. The stages in this process are revenue, cogs, operating profit, net profit.
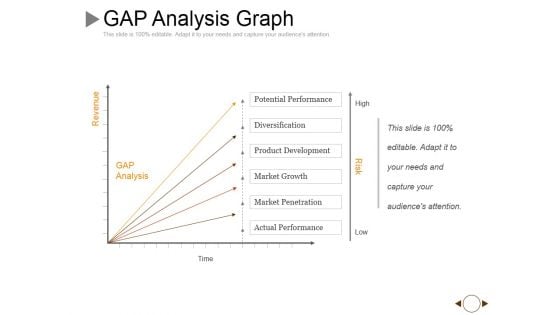
Gap Analysis Graph Ppt PowerPoint Presentation Slides Graphics Pictures
This is a gap analysis graph ppt powerpoint presentation slides graphics pictures. This is a five stage process. The stages in this process are revenue, time, high, low, risk.
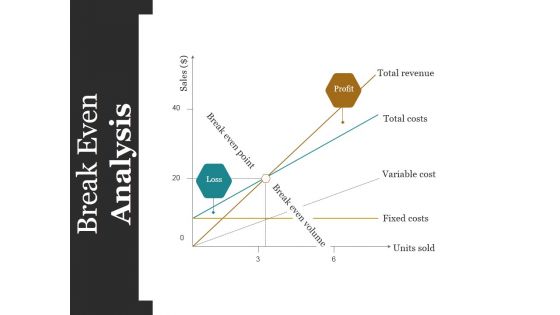
Break Even Analysis Ppt PowerPoint Presentation Inspiration Layouts
This is a break even analysis ppt powerpoint presentation inspiration layouts. This is a three stage process. The stages in this process are total revenue, total costs, variable cost, fixed costs, units sold.
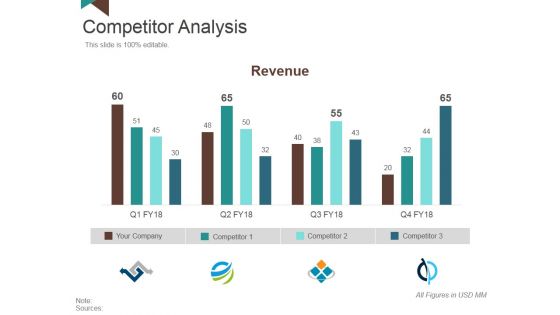
Competitor Analysis Template 4 Ppt PowerPoint Presentation Styles Visual Aids
This is a competitor analysis template 4 ppt powerpoint presentation styles visual aids. This is a four stage process. The stages in this process are revenue, your company, competitor.
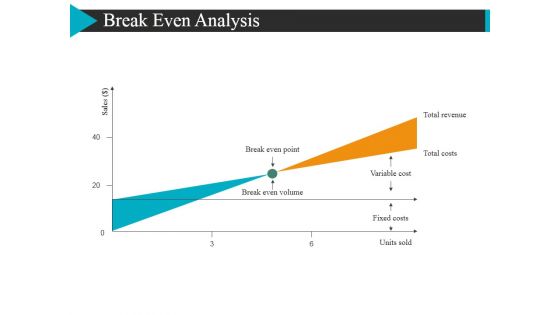
Break Even Analysis Ppt Powerpoint Presentation Show Maker
This is a break even analysis ppt powerpoint presentation show maker. This is a two stage process. The stages in this process are total revenue, total costs, break even volume.
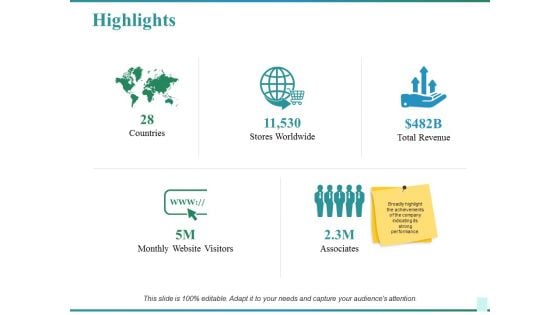
Highlights Ppt PowerPoint Presentation Slides Styles
This is a highlights ppt powerpoint presentation slides styles. This is a five stage process. The stages in this process are countries, stores worldwide, total revenue, associates, monthly website visitors.
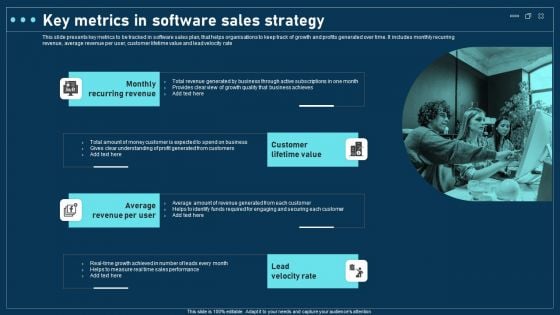
Key Metrics In Software Sales Strategy Pictures PDF
This slide presents key metrics to be tracked in software sales plan, that helps organisations to keep track of growth and profits generated over time. It includes monthly recurring revenue, average revenue per user, customer lifetime value and lead velocity rate Presenting Key Metrics In Software Sales Strategy Pictures PDF to dispense important information. This template comprises four stages. It also presents valuable insights into the topics including Monthly Recurring Revenue, Customer Lifetime Value, Lead Velocity Rate. This is a completely customizable PowerPoint theme that can be put to use immediately. So, download it and address the topic impactfully.
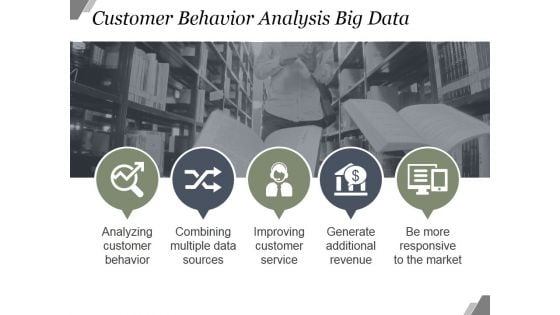
Customer Behavior Analysis Big Data Ppt PowerPoint Presentation Images
This is a customer behavior analysis big data ppt powerpoint presentation images. This is a five stage process. The stages in this process are analyzing customer behavior, combining multiple data sources, improving customer service, generate additional revenue, be more responsive to the market.
Objective Of Big Data Ppt PowerPoint Presentation Professional Sample
This is a objective of big data ppt powerpoint presentation professional sample. This is a five stage process. The stages in this process are analyzing customer behavior, combining multiple data sources, improving customer service, generate additional revenue, be more responsive to the market.
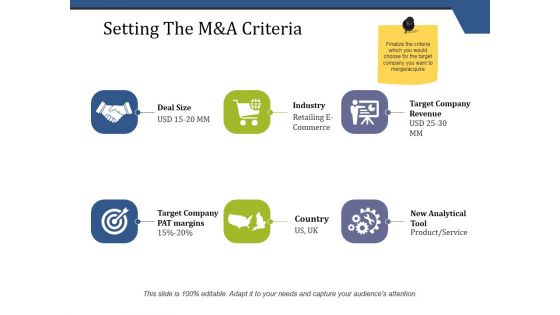
Setting The M And A Criteria Ppt PowerPoint Presentation Infographic Template Backgrounds
This is a setting the m and a criteria ppt powerpoint presentation infographic template backgrounds. This is a six stage process. The stages in this process are deal size, industry, target company revenue, target company pat margins, country, new analytical tool.
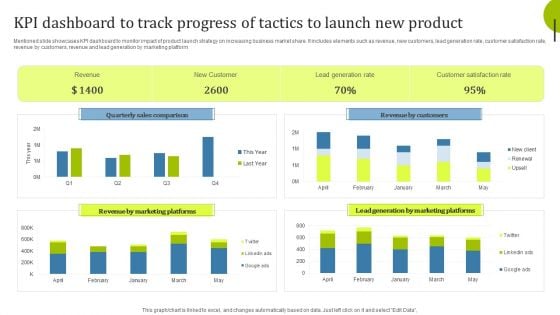
Kpi Dashboard To Track Progress Of Tactics To Launch New Product Infographics PDF
Mentioned slide showcases KPI dashboard to monitor impact of product launch strategy on increasing business market share. It includes elements such as revenue, new customers, lead generation rate, customer satisfaction rate, revenue by customers, revenue and lead generation by marketing platform. Showcasing this set of slides titled Kpi Dashboard To Track Progress Of Tactics To Launch New Product Infographics PDF. The topics addressed in these templates are Quarterly Sales Comparison, Revenue Marketing, Revenue Customers. All the content presented in this PPT design is completely editable. Download it and make adjustments in color, background, font etc. as per your unique business setting.
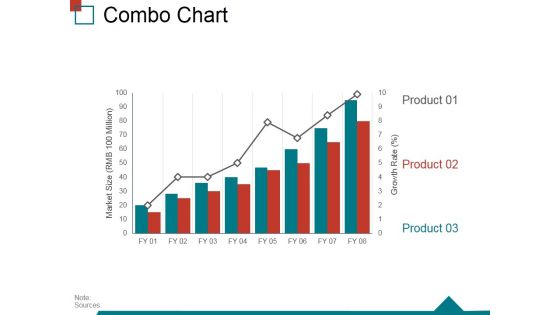
Combo Chart Ppt PowerPoint Presentation Layouts Visual Aids
This is a combo chart ppt powerpoint presentation layouts visual aids. This is a three stage process. The stages in this process are combo chart, process, growth, success, strategy.
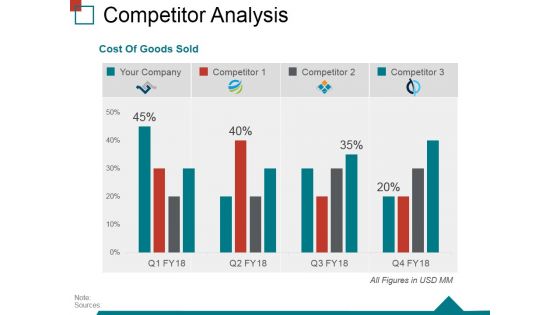
Competitor Analysis Template 2 Ppt PowerPoint Presentation File Picture
This is a competitor analysis template 2 ppt powerpoint presentation file picture. This is a four stage process. The stages in this process are your company, market share, competitor, analysis.
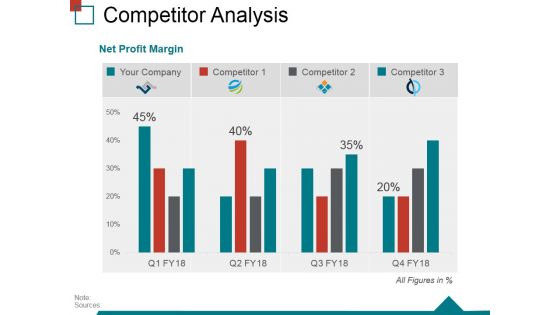
Competitor Analysis Template 3 Ppt PowerPoint Presentation Infographic Template Shapes
This is a competitor analysis template 3 ppt powerpoint presentation infographic template shapes. This is a four stage process. The stages in this process are your company, market share, competitor, analysis.
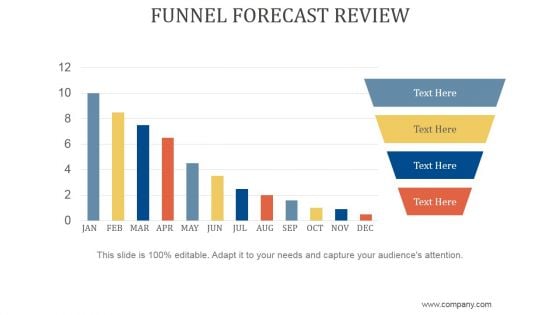
Funnel Forecast Review Ppt PowerPoint Presentation Templates
This is a funnel forecast review ppt powerpoint presentation templates. This is a two stage process. The stages in this process are business, strategy, marketing, growth strategy, funnel.
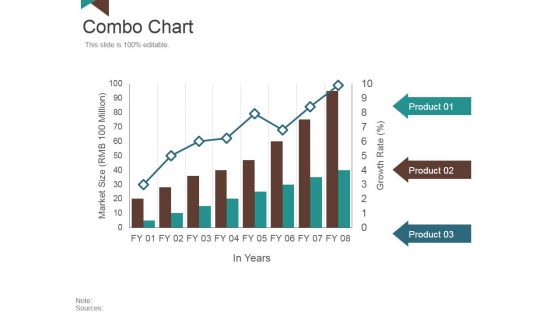
Combo Chart Ppt PowerPoint Presentation Inspiration Images
This is a combo chart ppt powerpoint presentation inspiration images. This is a three stage process. The stages in this process are market size, in years, growth rate, product.
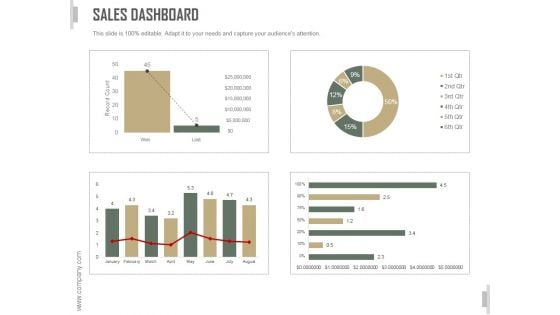
Sales Dashboard Slide Ppt PowerPoint Presentation Template
This is a sales dashboard slide ppt powerpoint presentation template. This is a three stage process. The stages in this process are business, strategy, marketing, analysis, bar graph, growth strategy.
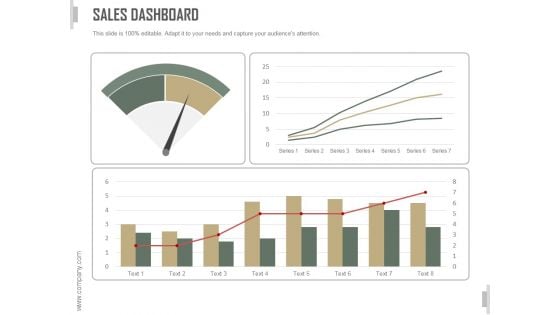
Sales Dashboard Ppt PowerPoint Presentation Design Templates
This is a sales dashboard ppt powerpoint presentation design templates. This is a four stage process. The stages in this process are business, strategy, marketing, analysis, bar graph, growth strategy.
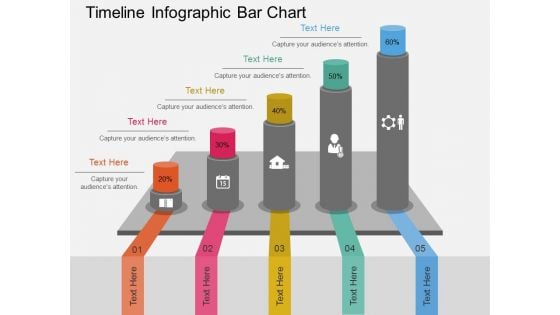
Timeline Infographic Bar Chart Powerpoint Template
This business diagram has been designed with timeline infographic bar chart. You may use this slide to display success and growth concepts. Make your mark with this unique slide and create an impression that will endure.
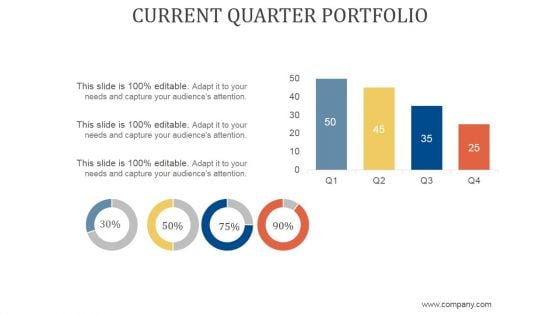
Current Quarter Portfolio Ppt PowerPoint Presentation Visual Aids
This is a current quarter portfolio ppt powerpoint presentation visual aids. This is a two stage process. The stages in this process are business, strategy, marketing, finance, growth strategy, bar graph.
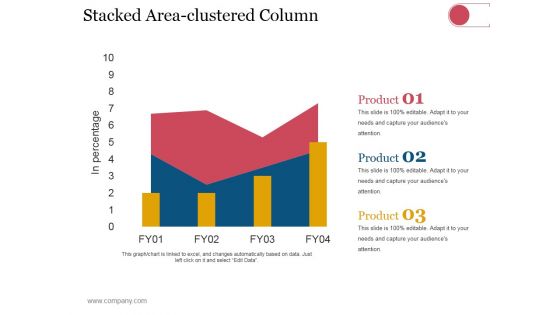
Stacked Area Clustered Column Ppt PowerPoint Presentation Styles Gridlines
This is a stacked area clustered column ppt powerpoint presentation styles gridlines. This is a three stage process. The stages in this process are dollars, in percentage, finance, growth strategy, business, strategy.
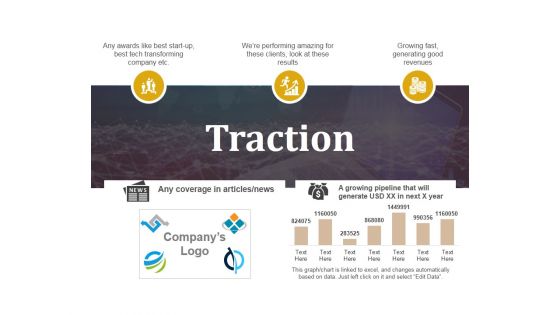
Traction Ppt PowerPoint Presentation Show Information
This is a traction ppt powerpoint presentation show information. This is a three stage process. The stages in this process are any awards like best start up best tech transforming company etc, were performing amazing for these clients look at these results, growing fast generating good revenues, .
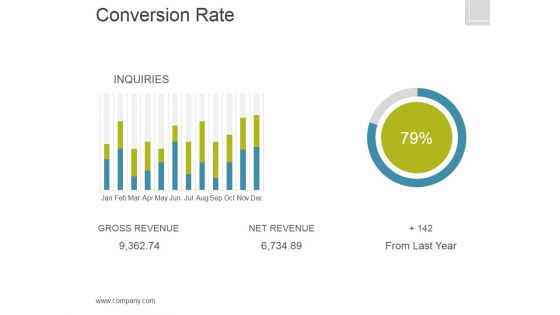
Conversion Rate Template 1 Ppt PowerPoint Presentation Portfolio
This is a conversion rate template 1 ppt powerpoint presentation portfolio. This is a three stage process. The stages in this process are gross revenue, net revenue, from last year.
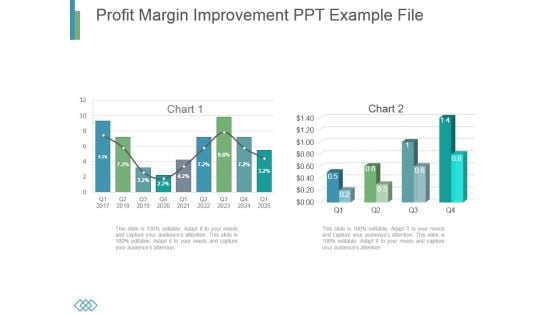
Profit Margin Improvement Ppt Example File
This is a profit margin improvement ppt example file. This is a two stage process. The stages in this process are business, marketing, growth, timeline, analysis.
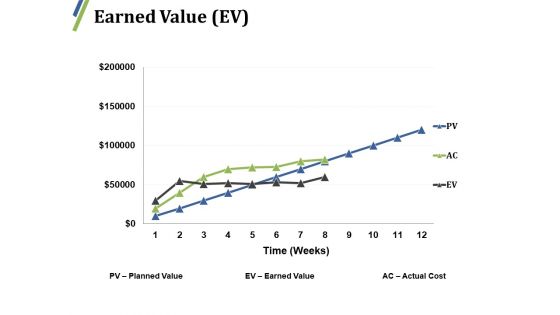
Earned Value Ppt PowerPoint Presentation Gallery Design Templates
This is a earned value ppt powerpoint presentation gallery design templates. This is a three stage process. The stages in this process are planned value, earned value, actual cost, growth, finance.


 Continue with Email

 Home
Home


