Revenue Growth
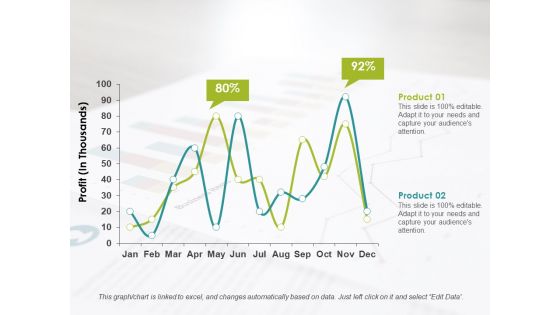
Line Chart Ppt PowerPoint Presentation Infographics Format Ideas
This is a line chart ppt powerpoint presentation infographics format ideas. This is a two stage process. The stages in this process are product, profit, business.
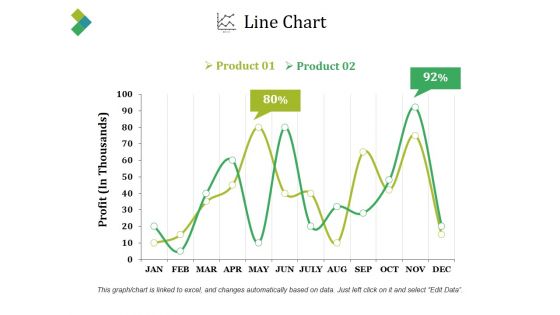
Line Chart Ppt PowerPoint Presentation Slides
This is a line chart ppt powerpoint presentation slides. This is a two stage process. The stages in this process are product, profit, percentage, finance, line chart.
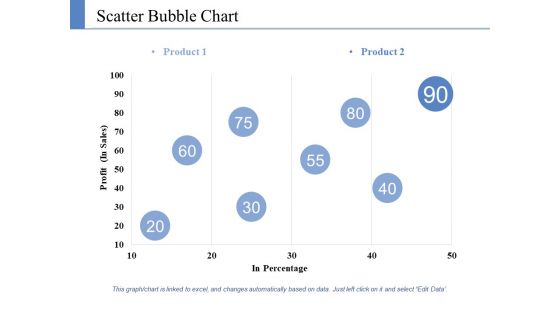
Scatter Bubble Chart Ppt PowerPoint Presentation Styles Information
This is a scatter bubble chart ppt powerpoint presentation styles information. This is a two stage process. The stages in this process are product, profit, in percentage.

Stacked Column Ppt PowerPoint Presentation Styles Example
This is a stacked column ppt powerpoint presentation styles example. This is a two stage process. The stages in this process are product, profit, business, marketing, success.
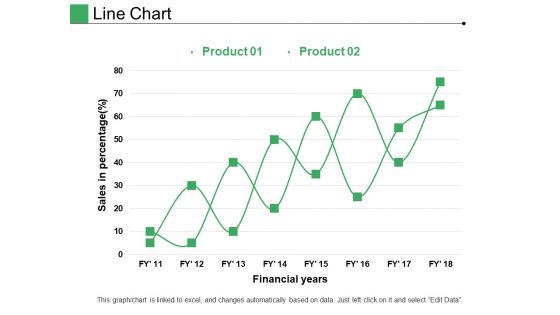
Line Chart Ppt PowerPoint Presentation Pictures Layout
This is a line chart ppt powerpoint presentation pictures layout. This is a two stage process. The stages in this process are product, financial years, sales in percentage.
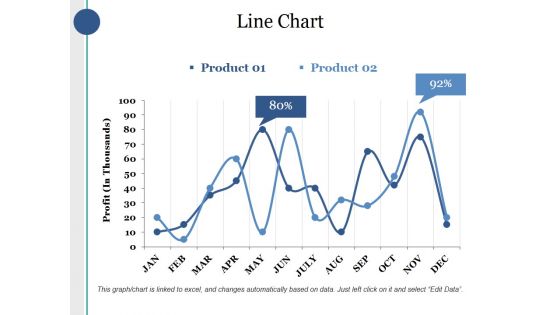
Line Chart Ppt PowerPoint Presentation Layouts Sample
This is a line chart ppt powerpoint presentation layouts sample. This is a two stage process. The stages in this process are product, profit, percentage, finance, business.
Bubble Chart Ppt PowerPoint Presentation Pictures Icons
This is a bubble chart ppt powerpoint presentation pictures icons. This is a two stage process. The stages in this process are product, profit, bubble chart.
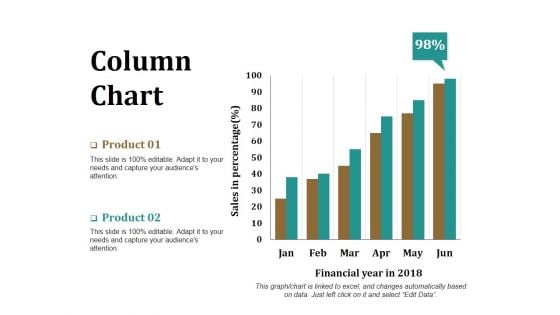
Column Chart Ppt PowerPoint Presentation Model Graphics Download
This is a column chart ppt powerpoint presentation model graphics download. This is a two stage process. The stages in this process are product, financial year, sales in percentage, bar graph, success.
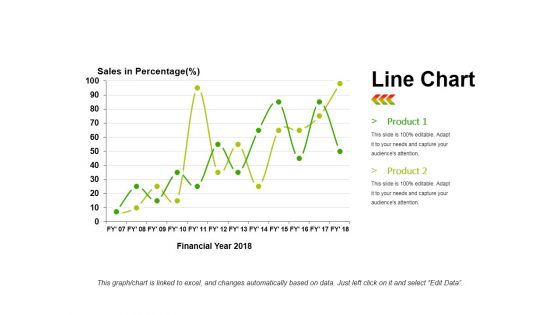
Line Chart Ppt PowerPoint Presentation Infographics Infographics
This is a line chart ppt powerpoint presentation infographics infographics. This is a two stage process. The stages in this process are product, sales in percentage, financial year, line chart, finance.
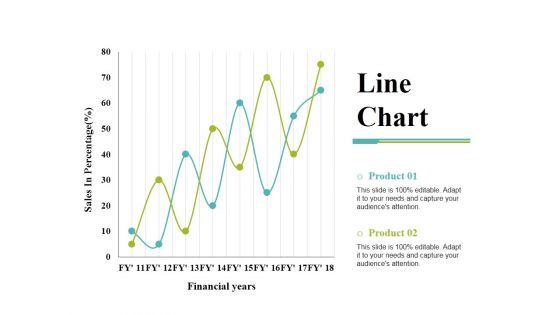
Line Chart Ppt PowerPoint Presentation Gallery Templates
This is a line chart ppt powerpoint presentation gallery templates. This is a two stage process. The stages in this process are product, financial years, sales in percentage, line chart.
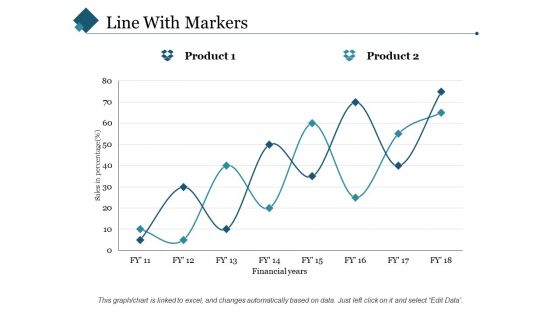
Line With Markers Ppt PowerPoint Presentation Styles Slide Portrait
This is a line with markers ppt powerpoint presentation styles slide portrait. This is a two stage process. The stages in this process are sales in percentage, financial years, product.
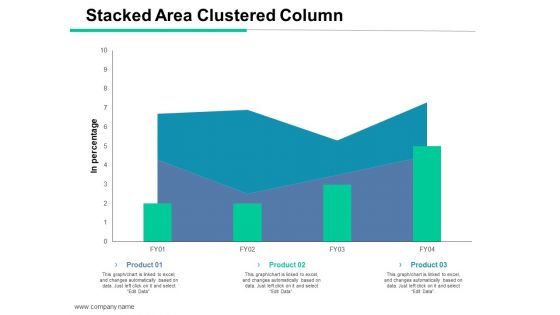
Stacked Area Clustered Column Ppt PowerPoint Presentation File Templates
This is a stacked area clustered column ppt powerpoint presentation file templates. This is a three stage process. The stages in this process are stacked area clustered column, product, financial, sales in percentage, management.
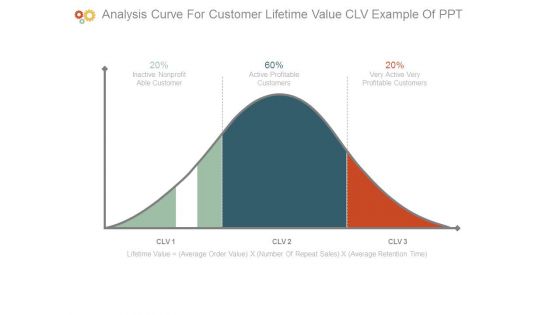
Analysis Curve For Customer Lifetime Value Clv Example Of Ppt
This is a analysis curve for customer lifetime value clv example of ppt. This is a three stage process. The stages in this process are inactive nonprofit able customer, active profitable customers, clv, lifetime value average order value x number of repeat sales x average retention time.
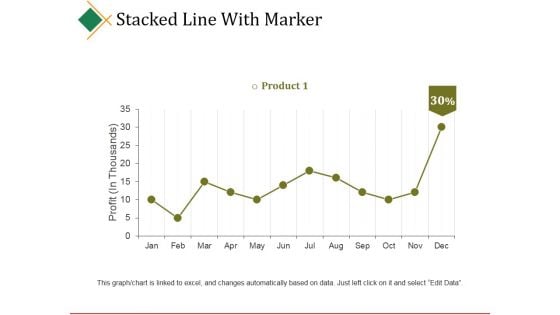
Stacked Line With Marker Ppt PowerPoint Presentation Model Graphics Download
This is a stacked line with marker ppt powerpoint presentation model graphics download. This is a twelve stage process. The stages in this process are product, profit, business, marketing, success.
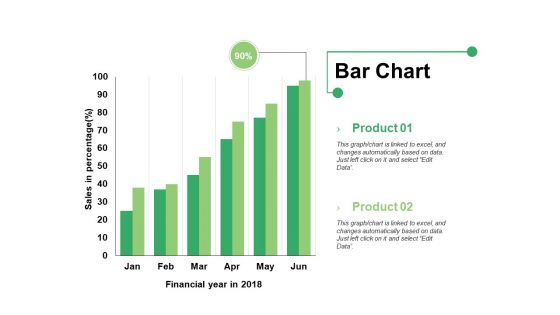
Bar Chart Ppt PowerPoint Presentation Infographics Format Ideas
This is a bar chart ppt powerpoint presentation infographics format ideas. This is a two stage process. The stages in this process are bar graph, product, financial year, sales in percentage.

Profitability Ratios Template 3 Ppt PowerPoint Presentation Styles Slide Download
This is a profitability ratios template 3 ppt powerpoint presentation styles slide download. This is a two stage process. The stages in this process are roce, roa, net operating profit, net income.
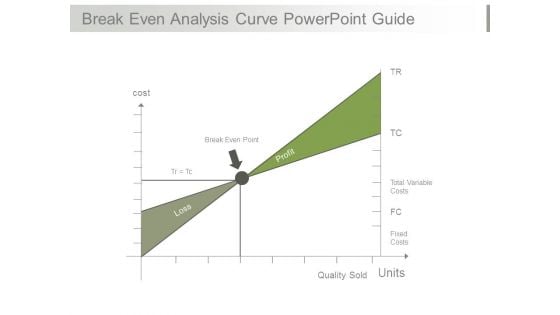
Break Even Analysis Curve Powerpoint Guide
This is a break even analysis curve powerpoint guide. This is a one stage process. The stages in this process are cost, break even point, loss, profit, total variable costs, fixed costs, quality sold, units.

Stock Market Trend Dollar Sign On Bar Graph Ppt Powerpoint Presentation Show Deck
This is a stock market trend dollar sign on bar graph ppt powerpoint presentation show deck. This is a four stage process. The stages in this process are stock market, financial market, bull market.
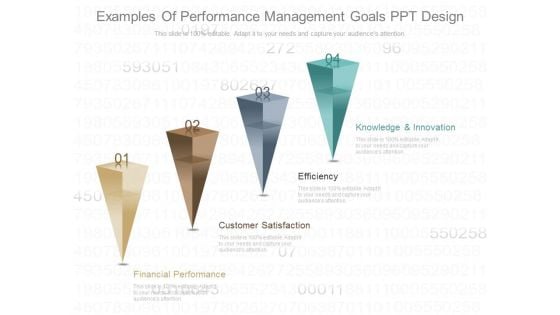
Examples Of Performance Management Goals Ppt Design
This is an examples of performance management goals ppt design. This is a four stage process. The stages in this process are financial performance, customer satisfaction, efficiency, knowledge and innovation.
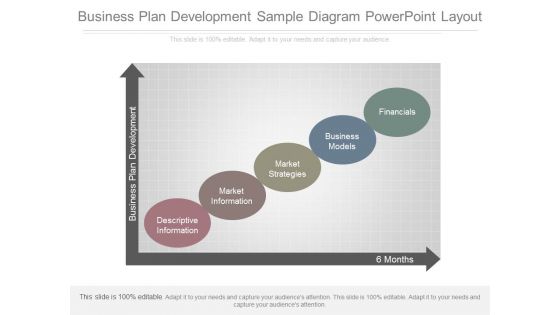
Business Plan Development Sample Diagram Powerpoint Layout
This is a business plan development sample diagram powerpoint layout. This is a five stage process. The stages in this process are business plan development, descriptive information, market information, market strategies, business models, financials.
Area Chart Ppt PowerPoint Presentation Icon Show
This is a area chart ppt powerpoint presentation icon show. This is a two stage process. The stages in this process are product, financial year, in percentage, area chart.
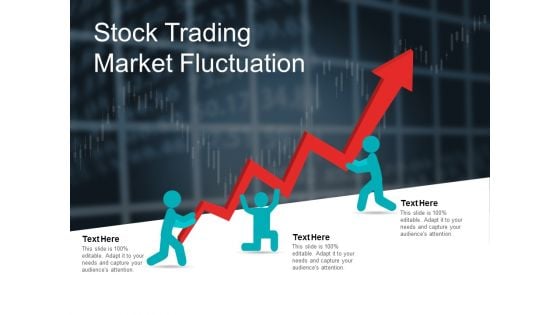
Stock Trading Market Fluctuation Ppt Powerpoint Presentation Professional Visuals
This is a stock trading market fluctuation ppt powerpoint presentation professional visuals. This is a three stage process. The stages in this process are stock market, financial market, bull market.
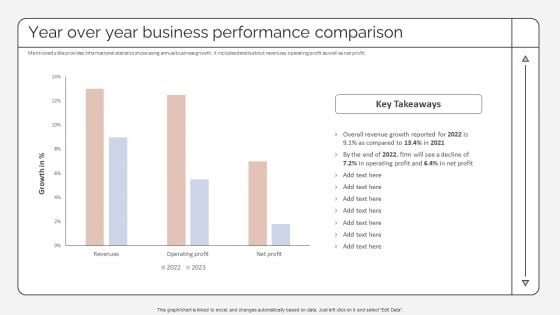
Year Over Year Business Performance Comparison Strategic Promotion Plan Pictures PDF
Mentioned slide provides informational statistics showcasing annual business growth. It includes details about revenues, operating profit as well as net profit. Are you in need of a template that can accommodate all of your creative concepts This one is crafted professionally and can be altered to fit any style. Use it with Google Slides or PowerPoint. Include striking photographs, symbols, depictions, and other visuals. Fill, move around, or remove text boxes as desired. Test out color palettes and font mixtures. Edit and save your work, or work with colleagues. Download Year Over Year Business Performance Comparison Strategic Promotion Plan Pictures PDF and observe how to make your presentation outstanding. Give an impeccable presentation to your group and make your presentation unforgettable.
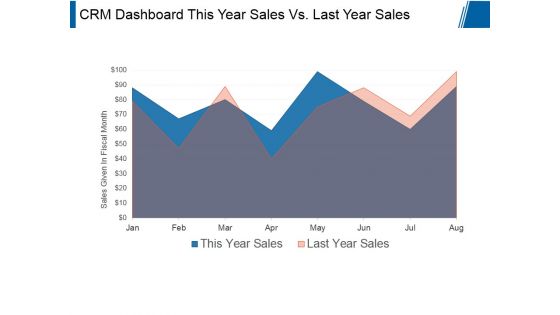
Crm Dashboard This Year Sales Vs Last Year Sales Ppt PowerPoint Presentation Styles
This is a crm dashboard this year sales vs last year sales ppt powerpoint presentation styles. This is a two stage process. The stages in this process are sales given in fiscal month, business, marketing, presentation, growth.
Profitability Ratios Template 1 Ppt PowerPoint Presentation Icon Example File
This is a profitability ratios template 1 ppt powerpoint presentation icon example file. This is a two stage process. The stages in this process are gross profit ratio, net profit ratio.
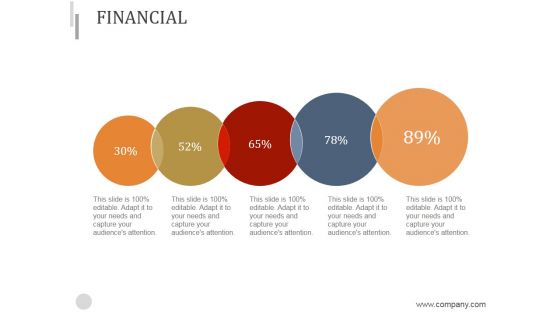
Financial Ppt PowerPoint Presentation Good
This is a financial ppt powerpoint presentation good. This is a five stage process. The stages in this process are finance, growth, process, strategy, business, marketing.
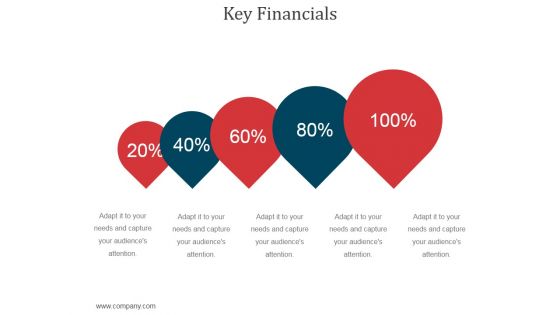
Key Financials Ppt PowerPoint Presentation Information
This is a key financials ppt powerpoint presentation information. This is a five stage process. The stages in this process are growth, finance, management, success, marketing, business.
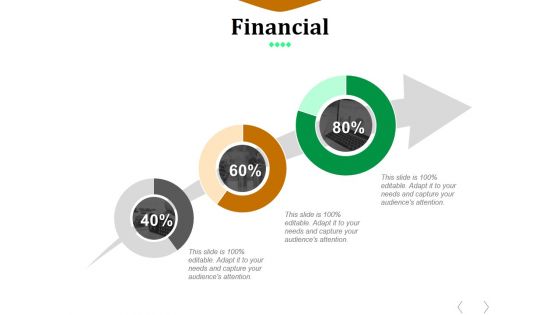
Financial Ppt PowerPoint Presentation Inspiration Ideas
This is a financial ppt powerpoint presentation inspiration ideas. This is a three stage process. The stages in this process are business, marketing, growth, finance, management.
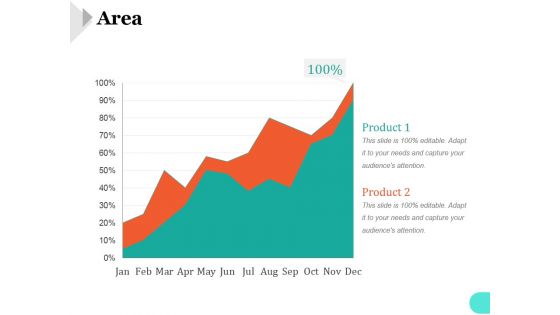
Area Ppt PowerPoint Presentation Themes
This is a area ppt powerpoint presentation themes. This is a two stage process. The stages in this process are area chart, management, growth, strategy, business.
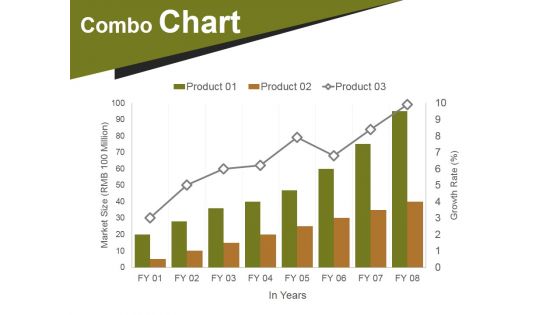
Combo Chart Ppt PowerPoint Presentation Portfolio Infographics
This is a combo chart ppt powerpoint presentation portfolio infographics. This is a eight stage process. The stages in this process are market size, growth, years, finance, business.
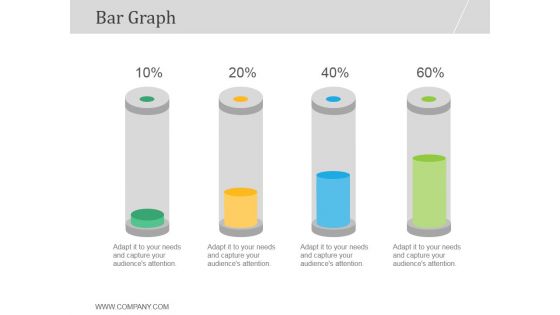
Bar Graph Ppt PowerPoint Presentation Good
This is a bar graph ppt powerpoint presentation good. This is a four stage process. The stages in this process are bar graph, growth, business, marketing, management, percentage.
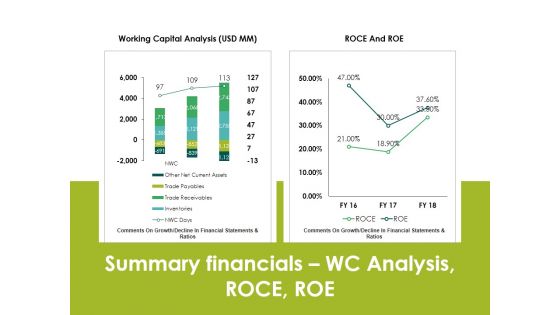
Summary Financials Wc Analysis Roce Roe Ppt PowerPoint Presentation Pictures Outfit
This is a summary financials wc analysis roce roe ppt powerpoint presentation pictures outfit. This is a two stage process. The stages in this process are business, finance, analysis, marketing, strategy, growth.
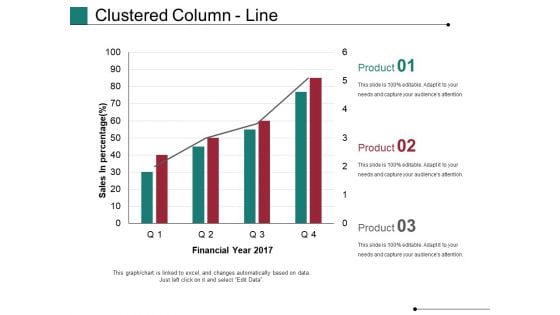
Clustered Column Line Ppt PowerPoint Presentation Model Rules
This is a clustered column line ppt powerpoint presentation model rules. This is a four stage process. The stages in this process are financial year, sales in percentage, business, marketing, growth, graph.
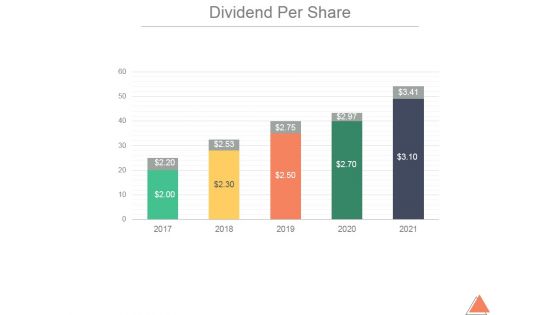
Dividend Per Share Ppt PowerPoint Presentation Pictures
This is a dividend per share ppt powerpoint presentation pictures. This is a five stage process. The stages in this process are business, marketing, management, growth, finance.
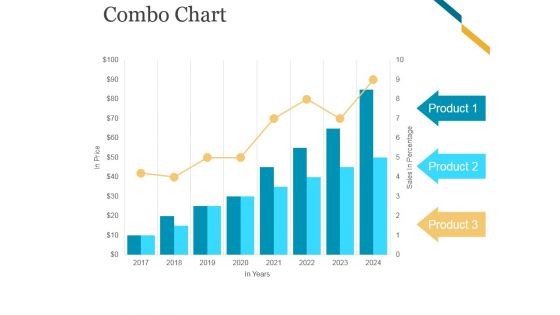
Combo Chart Ppt PowerPoint Presentation Files
This is a combo chart ppt powerpoint presentation files. This is a eight stage process. The stages in this process are business, marketing, growth, timeline, graph.
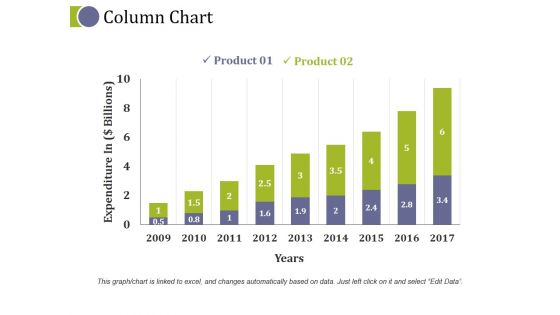
Column Chart Ppt PowerPoint Presentation Ideas Visual Aids
This is a column chart ppt powerpoint presentation ideas visual aids. This is a two stage process. The stages in this process are growth, business, finance, marketing, analysis.

Combo Chart Ppt PowerPoint Presentation Styles Example File
This is a combo chart ppt powerpoint presentation styles example file. This is a three stage process. The stages in this process are finance, growth, business, analysis, marketing.
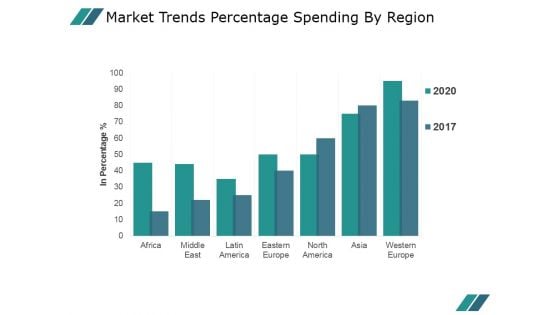
Market Trends Percentage Spending By Region Ppt PowerPoint Presentation Picture
This is a market trends percentage spending by region ppt powerpoint presentation picture. This is a seven stage process. The stages in this process are business, marketing, growth, planning, management.
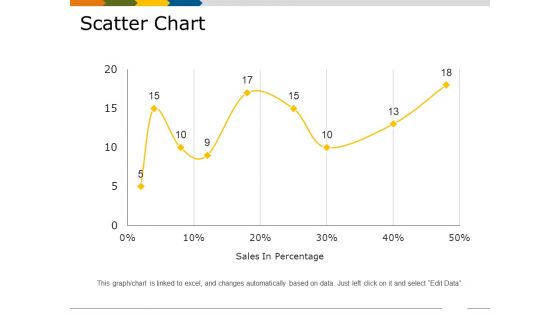
Scatter Chart Template 3 Ppt PowerPoint Presentation Styles Demonstration
This is a scatter chart template 3 ppt powerpoint presentation styles demonstration. This is a one stage process. The stages in this process are sales in percentage, finance, business, marketing, growth.

Area Chart Ppt PowerPoint Presentation Visual Aids Show
This is a area chart ppt powerpoint presentation visual aids show. This is a two stage process. The stages in this process are area chart, growth, strategy, finance, business.
Financial Projection Graph Template 1 Ppt PowerPoint Presentation Icon Summary
This is a financial projection graph template 1 ppt powerpoint presentation icon summary. This is a three stage process. The stages in this process are annual sales forecast, years, business, marketing, management.
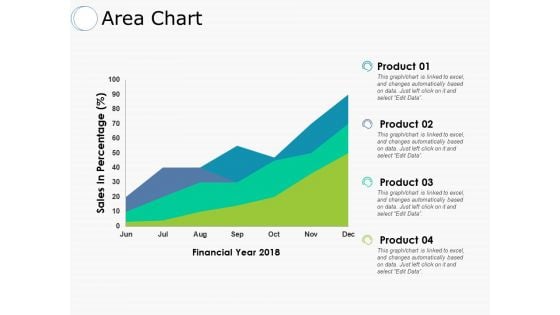
Area Chart Financial Ppt PowerPoint Presentation Outline Professional
This is a area chart financial ppt powerpoint presentation outline professional. This is a four stage process. The stages in this process are product, sales in percentage, financial year.
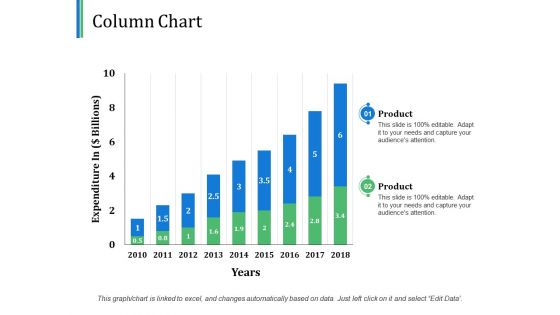
Column Chart Financial Ppt PowerPoint Presentation Outline Design Templates
This is a column chart financial ppt powerpoint presentation outline design templates. This is a two stage process. The stages in this process are financial, business, marketing, planning, strategy.
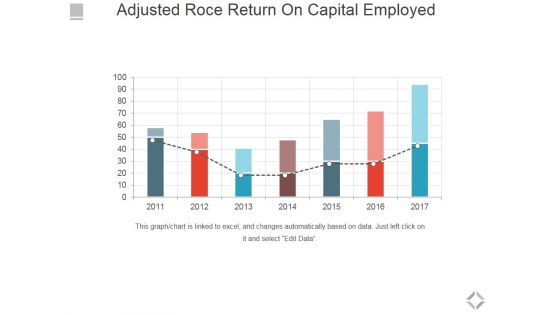
Adjusted Roce Return On Capital Employed Template 1 Ppt PowerPoint Presentation Layouts Themes
This is a adjusted roce return on capital employed template 1 ppt powerpoint presentation layouts themes. This is a seven stage process. The stages in this process are business, marketing, success, planning, management.
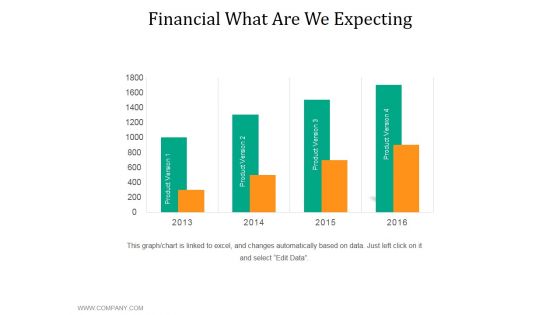
Financial What Are We Expecting Ppt PowerPoint Presentation Inspiration Infographics
This is a financial what are we expecting ppt powerpoint presentation inspiration infographics. This is a four stage process. The stages in this process are business, marketing, timeline, planning, strategy.
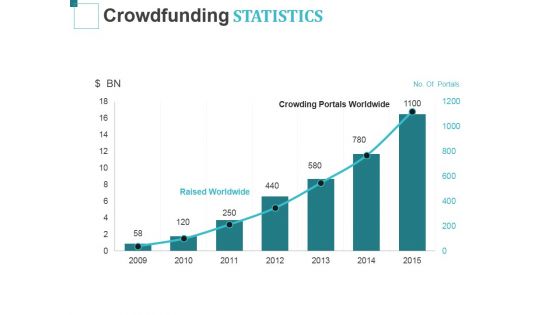
Crowdfunding Statistics Template 1 Ppt PowerPoint Presentation Outline Shapes
This is a crowdfunding statistics template 1 ppt powerpoint presentation outline shapes. This is a seven stage process. The stages in this process are business, strategy, analysis, marketing, crowding portals worldwide.
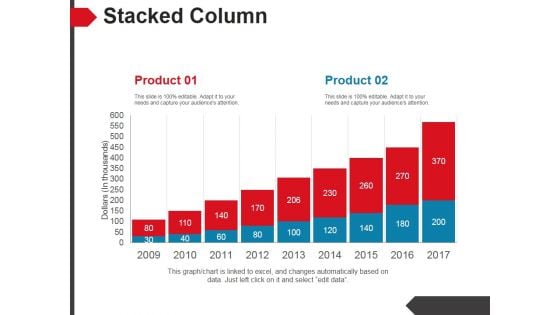
Stacked Column Ppt PowerPoint Presentation Example
This is a stacked column ppt powerpoint presentation example. This is a two stage process. The stages in this process are product, stacked column, business, marketing, strategy, success.
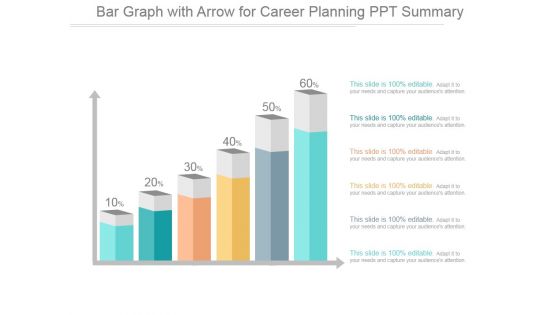
Bar Graph With Arrow For Career Planning Ppt PowerPoint Presentation Gallery
This is a bar graph with arrow for career planning ppt powerpoint presentation gallery. This is a six stage process. The stages in this process are business, finance, marketing, strategy, planning, success, arrow.
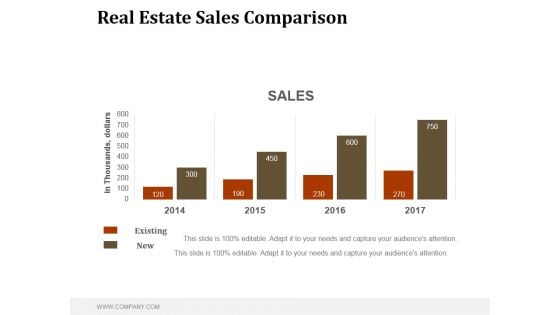
Real Estate Sales Comparison Ppt PowerPoint Presentation Good
This is a real estate sales comparison ppt powerpoint presentation good. This is a four stage process. The stages in this process are business, marketing, management, sales, comparison.
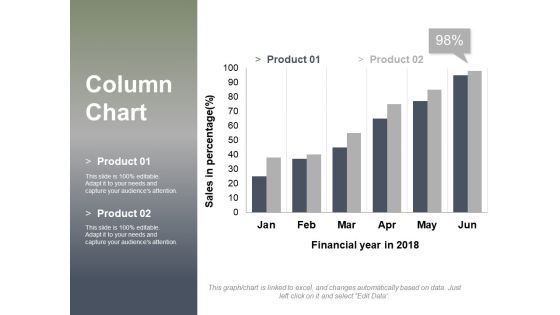
Column Chart Ppt PowerPoint Presentation Layouts Design Inspiration
This is a column chart ppt powerpoint presentation layouts design inspiration. This is a two stage process. The stages in this process are sales in percentage, financial year in, graph, business, finance, marketing.
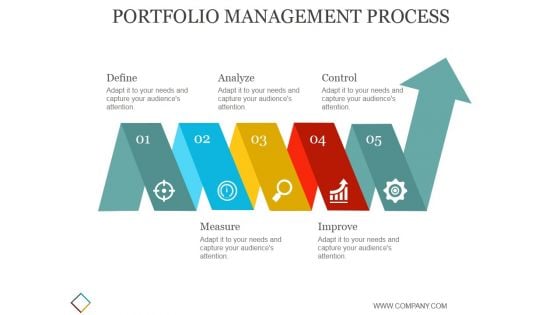
Portfolio Management Process Ppt PowerPoint Presentation Layout
This is a portfolio management process ppt powerpoint presentation layout. This is a five stage process. The stages in this process are define, analyze, control, measure, improve.
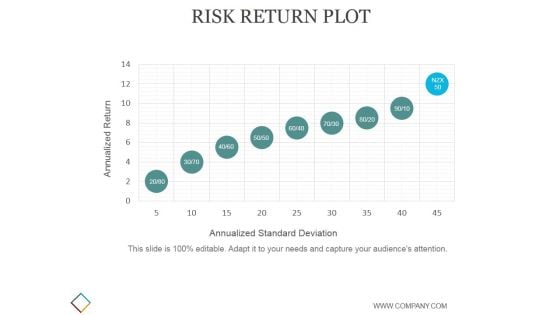
Risk Return Plot Ppt PowerPoint Presentation Background Images
This is a risk return plot ppt powerpoint presentation background images. This is a nine stage process. The stages in this process are annualized return, annualized standard deviation.
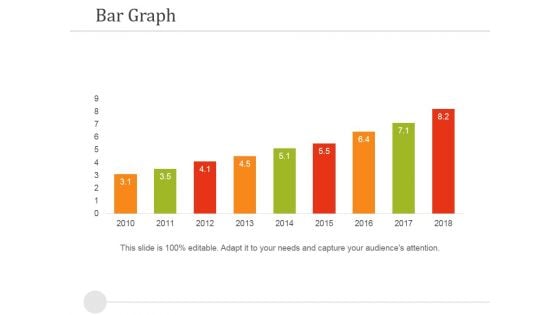
Bar Graph Ppt PowerPoint Presentation Outline File Formats
This is a bar graph ppt powerpoint presentation outline file formats. This is a nine stage process. The stages in this process are bar graph, business, management, success, strategy.
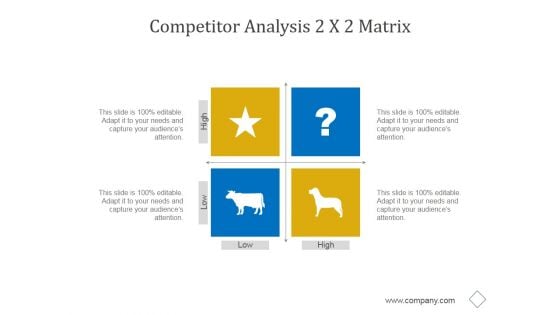
Competitor Analysis 2 X 2 Matrix Ppt PowerPoint Presentation Deck
This is a competitor analysis 2 x 2 matrix ppt powerpoint presentation deck. This is a four stage process. The stages in this process are business, marketing, management, matrix, analysis.
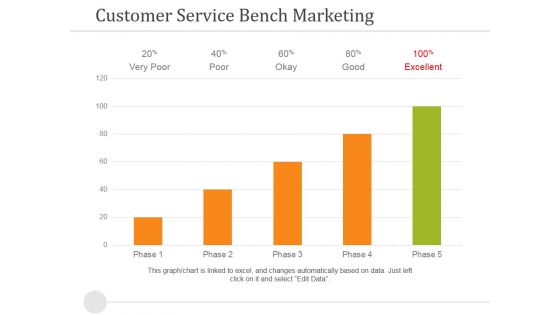
Customer Service Bench Marketing Ppt PowerPoint Presentation Professional Summary
This is a customer service bench marketing ppt powerpoint presentation professional summary. This is a five stage process. The stages in this process are very poor, poor, good, excellent.
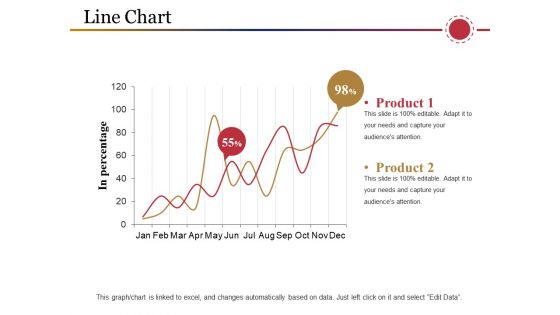
Line Chart Ppt PowerPoint Presentation Inspiration Samples
This is a line chart ppt powerpoint presentation inspiration samples. This is a two stage process. The stages in this process are product, in percentage, business, marketing, graph.
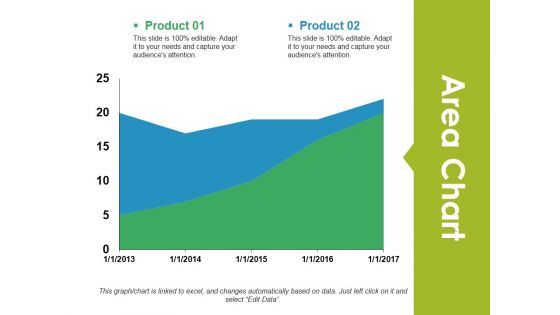
Area Chart Ppt PowerPoint Presentation Outline Deck
This is a area chart ppt powerpoint presentation outline deck. This is a two stage process. The stages in this process are area chart, finance, marketing, analysis, business.
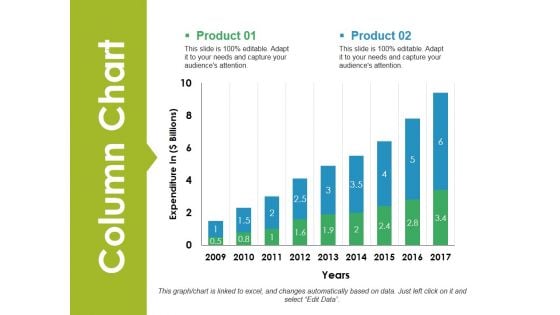
Column Chart Ppt PowerPoint Presentation File Graphics
This is a column chart ppt powerpoint presentation file graphics. This is a two stage process. The stages in this process are column chart, finance, analysis, marketing, business.
Combo Chart Ppt PowerPoint Presentation Icon Portrait
This is a combo chart ppt powerpoint presentation icon portrait. This is a three stage process. The stages in this process are combo chart, finance, marketing, strategy, analysis.
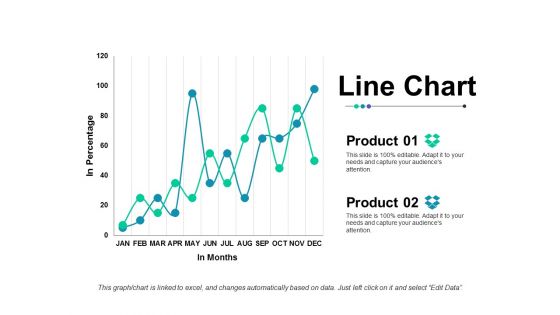
Line Chart Ppt Powerpoint Presentation Outline Slide Portrait
This is a line chart ppt powerpoint presentation outline slide portrait. This is a two stage process. The stages in this process are line chart, finance, strategy, business, analysis.


 Continue with Email

 Home
Home


