Score Meter
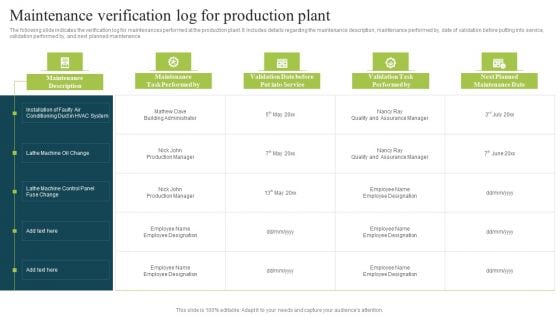
Plan To Enhance Manufacturing Maintenance Verification Log For Production Plant Brochure PDF
The following slide indicates the verification log for maintenances performed at the production plant. It includes details regarding the maintenance description, maintenance performed by, date of validation before putting into service, validation performed by, and next planned maintenance. Boost your pitch with our creative Plan To Enhance Manufacturing Maintenance Verification Log For Production Plant Brochure PDF. Deliver an awe-inspiring pitch that will mesmerize everyone. Using these presentation templates you will surely catch everyones attention. You can browse the ppts collection on our website. We have researchers who are experts at creating the right content for the templates. So you dont have to invest time in any additional work. Just grab the template now and use them.
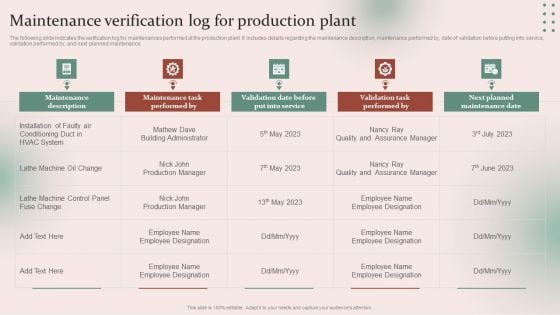
Strategies For Effective Manufacturing Maintenance Verification Log For Production Plant Brochure PDF
The following slide indicates the verification log for maintenances performed at the production plant. It includes details regarding the maintenance description, maintenance performed by, date of validation before putting into service, validation performed by, and next planned maintenance. Boost your pitch with our creative Strategies For Effective Manufacturing Maintenance Verification Log For Production Plant Brochure PDF. Deliver an awe-inspiring pitch that will mesmerize everyone. Using these presentation templates you will surely catch everyones attention. You can browse the ppts collection on our website. We have researchers who are experts at creating the right content for the templates. So you dont have to invest time in any additional work. Just grab the template now and use them.
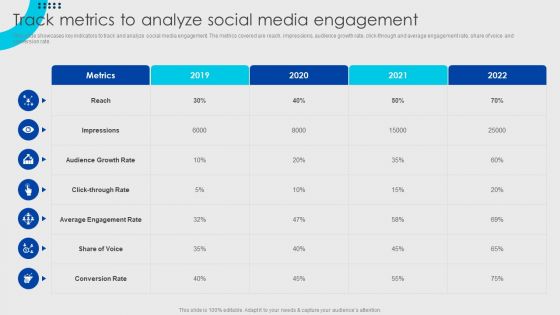
Online Fashion Firm Summary Track Metrics To Analyze Social Media Engagement Topics PDF
This slide showcases key indicators to track and analyze social media engagement. The metrics covered are reach, impressions, audience growth rate, click-through and average engagement rate, share of voice and conversion rate. Find highly impressive Online Fashion Firm Summary Track Metrics To Analyze Social Media Engagement Topics PDF on Slidegeeks to deliver a meaningful presentation. You can save an ample amount of time using these presentation templates. No need to worry to prepare everything from scratch because Slidegeeks experts have already done a huge research and work for you. You need to download Online Fashion Firm Summary Track Metrics To Analyze Social Media Engagement Topics PDF for your upcoming presentation. All the presentation templates are 100 percent editable and you can change the color and personalize the content accordingly. Download now.

Viral Marketing Campaign Plan With Kpi Assessment Deploying Viral Marketing Strategies Brochure PDF
The following slide shows viral marketing campaign plan with KPI analysis. It provides details about buzz, online, offline, word of mouth, team, goals, budget, call to action, key performance indicators, fear of missing out FOMO, etc. Find highly impressive Viral Marketing Campaign Plan With Kpi Assessment Deploying Viral Marketing Strategies Brochure PDF on Slidegeeks to deliver a meaningful presentation. You can save an ample amount of time using these presentation templates. No need to worry to prepare everything from scratch because Slidegeeks experts have already done a huge research and work for you. You need to download Viral Marketing Campaign Plan With Kpi Assessment Deploying Viral Marketing Strategies Brochure PDF for your upcoming presentation. All the presentation templates are 100 precent editable and you can change the color and personalize the content accordingly. Download now.
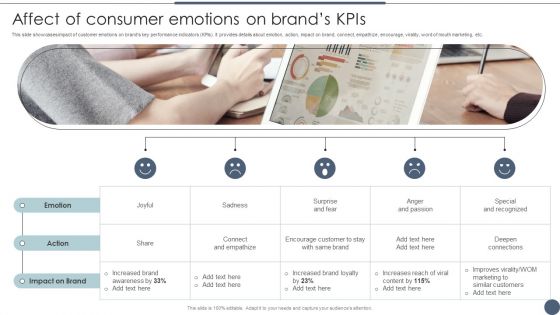
Affect Of Consumer Emotions On Brands Kpis Utilizing Emotional And Rational Branding For Improved Themes PDF
This slide showcases impact of customer emotions on brands key performance indicators KPIs. It provides details about emotion, action, impact on brand, connect, empathize, encourage, virality, word of mouth marketing, etc. Boost your pitch with our creative Affect Of Consumer Emotions On Brands Kpis Utilizing Emotional And Rational Branding For Improved Themes PDF. Deliver an awe-inspiring pitch that will mesmerize everyone. Using these presentation templates you will surely catch everyones attention. You can browse the ppts collection on our website. We have researchers who are experts at creating the right content for the templates. So you do not have to invest time in any additional work. Just grab the template now and use them.
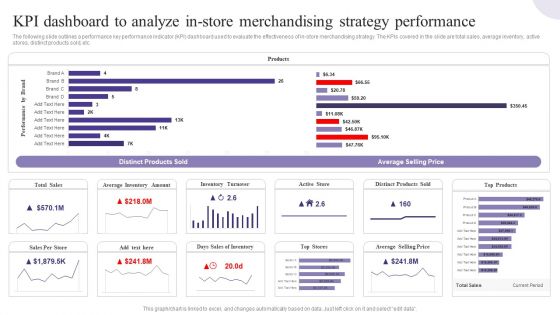
KPI Dashboard To Analyze In Store Merchandising Strategy Performance Introduction PDF
The following slide outlines a performance key performance indicator KPI dashboard used to evaluate the effectiveness of in-store merchandising strategy. The KPIs covered in the slide are total sales, average inventory, active stores, distinct products sold, etc. Formulating a presentation can take up a lot of effort and time, so the content and message should always be the primary focus. The visuals of the PowerPoint can enhance the presenters message, so our KPI Dashboard To Analyze In Store Merchandising Strategy Performance Introduction PDF was created to help save time. Instead of worrying about the design, the presenter can concentrate on the message while our designers work on creating the ideal templates for whatever situation is needed. Slidegeeks has experts for everything from amazing designs to valuable content, we have put everything into KPI Dashboard To Analyze In Store Merchandising Strategy Performance Introduction PDF.
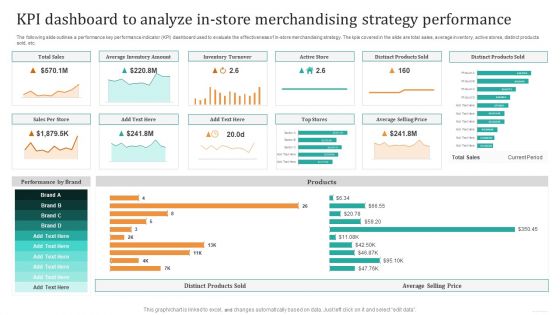
KPI Dashboard To Analyze In Store Merchandising Strategy Performance Pictures PDF
The following slide outlines a performance key performance indicator KPI dashboard used to evaluate the effectiveness of in-store merchandising strategy. The KPIs covered in the slide are total sales, average inventory, active stores, distinct products sold, etc. Formulating a presentation can take up a lot of effort and time, so the content and message should always be the primary focus. The visuals of the PowerPoint can enhance the presenters message, so our KPI Dashboard To Analyze In Store Merchandising Strategy Performance Pictures PDF was created to help save time. Instead of worrying about the design, the presenter can concentrate on the message while our designers work on creating the ideal templates for whatever situation is needed. Slidegeeks has experts for everything from amazing designs to valuable content, we have put everything into KPI Dashboard To Analyze In Store Merchandising Strategy Performance Pictures PDF.
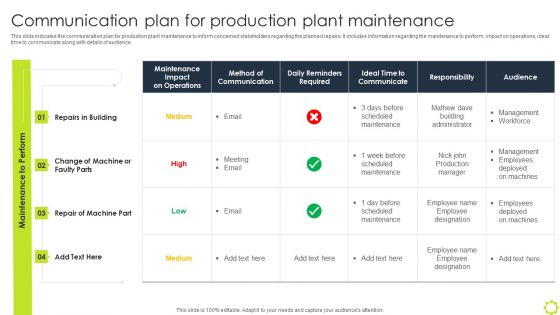
Machine Repairing And Servicing Communication Plan For Production Plant Background PDF
This slide indicates the communication plan for production plant maintenance to inform concerned stakeholders regarding the planned repairs. It includes information regarding the maintenance to perform, impact on operations, ideal time to communicate along with details of audience. Boost your pitch with our creative Machine Repairing And Servicing Communication Plan For Production Plant Background PDF. Deliver an awe-inspiring pitch that will mesmerize everyone. Using these presentation templates you will surely catch everyones attention. You can browse the ppts collection on our website. We have researchers who are experts at creating the right content for the templates. So you dont have to invest time in any additional work. Just grab the template now and use them.
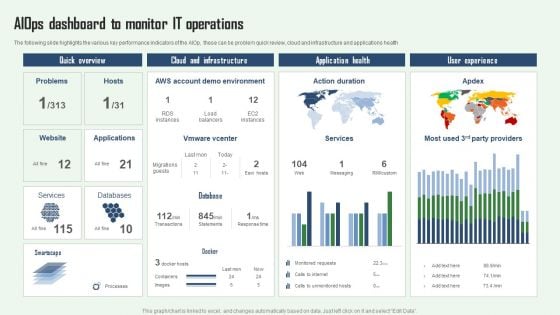
Aiops Dashboard To Monitor IT Operations Aiops Integration Summary Report Clipart PDF
The following slide highlights the various key performance indicators of the AIOp, these can be problem quick review, cloud and infrastructure and applications health. If you are looking for a format to display your unique thoughts, then the professionally designed Aiops Dashboard To Monitor IT Operations Aiops Integration Summary Report Clipart PDF is the one for you. You can use it as a Google Slides template or a PowerPoint template. Incorporate impressive visuals, symbols, images, and other charts. Modify or reorganize the text boxes as you desire. Experiment with shade schemes and font pairings. Alter, share or cooperate with other people on your work. Download Aiops Dashboard To Monitor IT Operations Aiops Integration Summary Report Clipart PDF and find out how to give a successful presentation. Present a perfect display to your team and make your presentation unforgettable.
Analysis Plan For E Commerce Promotion Tactics Content Performance Tracking Dashboard For Social Media Channels Icons PDF
This slide indicates the content performance tracking dashboard for social media channels providing information regarding the total number of posts, engagement rate, audience sentiments and multiple hashtags performance. Formulating a presentation can take up a lot of effort and time, so the content and message should always be the primary focus. The visuals of the PowerPoint can enhance the presenters message, so our Analysis Plan For E Commerce Promotion Tactics Content Performance Tracking Dashboard For Social Media Channels Icons PDF was created to help save time. Instead of worrying about the design, the presenter can concentrate on the message while our designers work on creating the ideal templates for whatever situation is needed. Slidegeeks has experts for everything from amazing designs to valuable content, we have put everything into Analysis Plan For E Commerce Promotion Tactics Content Performance Tracking Dashboard For Social Media Channels Icons PDF
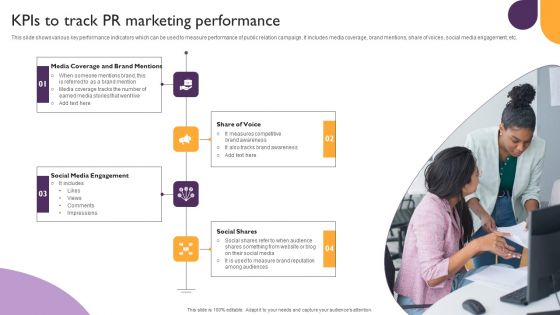
Public Relations Guide To Enhance Brand Credibility Kpis To Track PR Marketing Performance Infographics PDF
This slide shows various key performance indicators which can be used to measure performance of public relation campaign. It includes media coverage, brand mentions, share of voices, social media engagement, etc. Formulating a presentation can take up a lot of effort and time, so the content and message should always be the primary focus. The visuals of the PowerPoint can enhance the presenters message, so our Public Relations Guide To Enhance Brand Credibility Kpis To Track PR Marketing Performance Infographics PDF was created to help save time. Instead of worrying about the design, the presenter can concentrate on the message while our designers work on creating the ideal templates for whatever situation is needed. Slidegeeks has experts for everything from amazing designs to valuable content, we have put everything into Public Relations Guide To Enhance Brand Credibility Kpis To Track PR Marketing Performance Infographics PDF
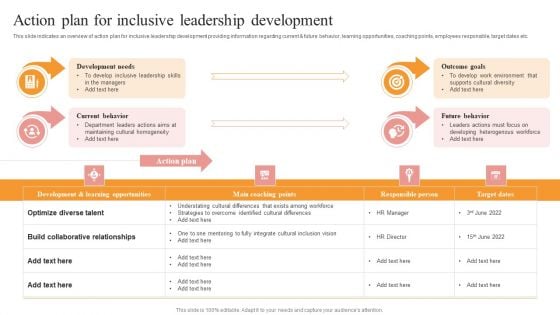
Action Plan For Inclusive Leadership Development Themes PDF
This slide indicates an overview of action plan for inclusive leadership development providing information regarding current and future behavior, learning opportunities, coaching points, employees responsible, target dates etc. If you are looking for a format to display your unique thoughts, then the professionally designed Action Plan For Inclusive Leadership Development Themes PDF is the one for you. You can use it as a Google Slides template or a PowerPoint template. Incorporate impressive visuals, symbols, images, and other charts. Modify or reorganize the text boxes as you desire. Experiment with shade schemes and font pairings. Alter, share or cooperate with other people on your work. Download Action Plan For Inclusive Leadership Development Themes PDF and find out how to give a successful presentation. Present a perfect display to your team and make your presentation unforgettable.
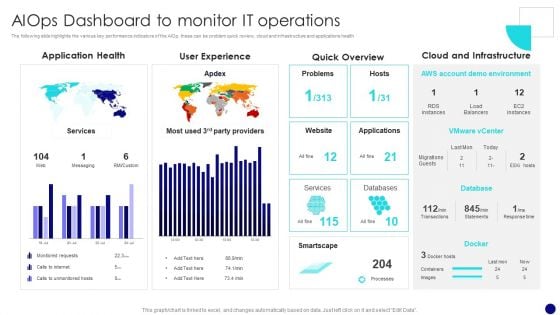
Information Technology Operations Administration With ML Aiops Dashboard To Monitor Diagrams PDF
The following slide highlights the various key performance indicators of the AIOp, these can be problem quick review, cloud and infrastructure and applications health. If you are looking for a format to display your unique thoughts, then the professionally designed Information Technology Operations Administration With ML Aiops Dashboard To Monitor Diagrams PDF is the one for you. You can use it as a Google Slides template or a PowerPoint template. Incorporate impressive visuals, symbols, images, and other charts. Modify or reorganize the text boxes as you desire. Experiment with shade schemes and font pairings. Alter, share or cooperate with other people on your work. Download Information Technology Operations Administration With ML Aiops Dashboard To Monitor Diagrams PDF and find out how to give a successful presentation. Present a perfect display to your team and make your presentation unforgettable.
Impact Of Customer Churn On Organization Performance Icons PDF
Mentioned slide outlines the impact of a higher attrition rate on the companys financial performance. It contains information about major financial key performance indicators KPIs such as monthly recurring revenue MRR, customer lifetime value CLV, and customer acquisition cost CAC. If you are looking for a format to display your unique thoughts, then the professionally designed Impact Of Customer Churn On Organization Performance Icons PDF is the one for you. You can use it as a Google Slides template or a PowerPoint template. Incorporate impressive visuals, symbols, images, and other charts. Modify or reorganize the text boxes as you desire. Experiment with shade schemes and font pairings. Alter, share or cooperate with other people on your work. Download Impact Of Customer Churn On Organization Performance Icons PDF and find out how to give a successful presentation. Present a perfect display to your team and make your presentation unforgettable.

Operational Strategy For ML In IT Sector Aiops Dashboard To Monitor IT Operations Diagrams PDF
The following slide highlights the various key performance indicators of the AIOps, these can be problem quick review, cloud and infrastructure and applications health If you are looking for a format to display your unique thoughts, then the professionally designed Operational Strategy For ML In IT Sector Aiops Dashboard To Monitor IT Operations Diagrams PDF is the one for you. You can use it as a Google Slides template or a PowerPoint template. Incorporate impressive visuals, symbols, images, and other charts. Modify or reorganize the text boxes as you desire. Experiment with shade schemes and font pairings. Alter, share or cooperate with other people on your work. Download Operational Strategy For ML In IT Sector Aiops Dashboard To Monitor IT Operations Diagrams PDF and find out how to give a successful presentation. Present a perfect display to your team and make your presentation unforgettable.
Key Metrics To Measure Success Of Video Marketing Campaign Icons PDF
The following slide outlines key performance indicators KPIs that can assist marketers in measuring real estate video marketing campaign performance. The metrics outlined in slide are watch time, click-through rate CTR, conversion rate, customer engagement rate, etc. Formulating a presentation can take up a lot of effort and time, so the content and message should always be the primary focus. The visuals of the PowerPoint can enhance the presenters message, so our Key Metrics To Measure Success Of Video Marketing Campaign Icons PDF was created to help save time. Instead of worrying about the design, the presenter can concentrate on the message while our designers work on creating the ideal templates for whatever situation is needed. Slidegeeks has experts for everything from amazing designs to valuable content, we have put everything into Key Metrics To Measure Success Of Video Marketing Campaign Icons PDF
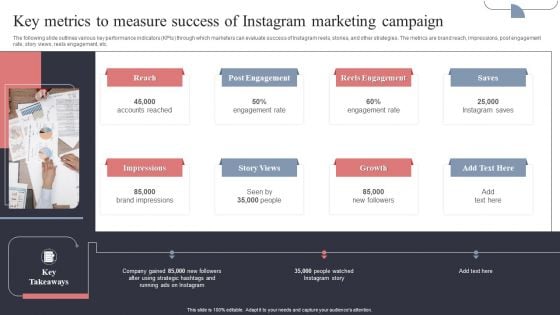
Key Metrics To Measure Success Of Instagram Marketing Campaign Designs PDF
The following slide outlines various key performance indicators KPIs through which marketers can evaluate success of Instagram reels, stories, and other strategies. The metrics are brand reach, impressions, post engagement rate, story views, reels engagement, etc. Find highly impressive Key Metrics To Measure Success Of Instagram Marketing Campaign Designs PDF on Slidegeeks to deliver a meaningful presentation. You can save an ample amount of time using these presentation templates. No need to worry to prepare everything from scratch because Slidegeeks experts have already done a huge research and work for you. You need to download Key Metrics To Measure Success Of Instagram Marketing Campaign Designs PDF for your upcoming presentation. All the presentation templates are 100 percent editable and you can change the color and personalize the content accordingly. Download now
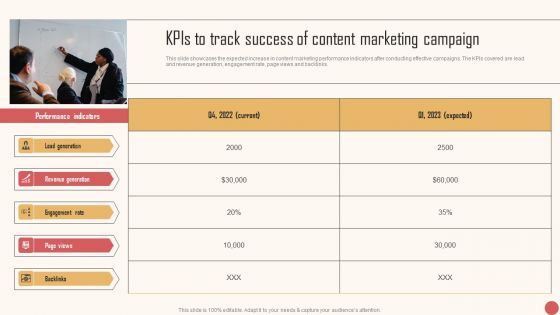
Kpis To Track Success Of Content Marketing Campaign Diagrams PDF
This slide showcases the expected increase in content marketing performance indicators after conducting effective campaigns. The KPIs covered are lead and revenue generation, engagement rate, page views and backlinks. Formulating a presentation can take up a lot of effort and time, so the content and message should always be the primary focus. The visuals of the PowerPoint can enhance the presenters message, so our Kpis To Track Success Of Content Marketing Campaign Diagrams PDF was created to help save time. Instead of worrying about the design, the presenter can concentrate on the message while our designers work on creating the ideal templates for whatever situation is needed. Slidegeeks has experts for everything from amazing designs to valuable content, we have put everything into Kpis To Track Success Of Content Marketing Campaign Diagrams PDF.

Percent Change In Workplace Productivity Ppt Summary Slide Portrait
Following slide illustrates informational stats about percent change in workplace productivity. Here the graph indicates that workplace productivity gets decreased by 1.6 percent in 2022 as compared to 2023 stats. Formulating a presentation can take up a lot of effort and time, so the content and message should always be the primary focus. The visuals of the PowerPoint can enhance the presenters message, so our Percent Change In Workplace Productivity Ppt Summary Slide Portrait was created to help save time. Instead of worrying about the design, the presenter can concentrate on the message while our designers work on creating the ideal templates for whatever situation is needed. Slidegeeks has experts for everything from amazing designs to valuable content, we have put everything into Percent Change In Workplace Productivity Ppt Summary Slide Portrait.

Market Research Assessment Of Target Market Requirements Declining Performance Email Marketing Demonstration PDF
The following slide outlines tabular representation of email marketing campaign results. Total emails sent, open rate, click through rate CTR, conversion rate, and bounce rate are the major key performance indicators KPIs which are mentioned in the slide. Find highly impressive Market Research Assessment Of Target Market Requirements Declining Performance Email Marketing Demonstration PDF on Slidegeeks to deliver a meaningful presentation. You can save an ample amount of time using these presentation templates. No need to worry to prepare everything from scratch because Slidegeeks experts have already done a huge research and work for you. You need to download Market Research Assessment Of Target Market Requirements Declining Performance Email Marketing Demonstration PDF for your upcoming presentation. All the presentation templates are 100 percent editable and you can change the color and personalize the content accordingly. Download now.

Extending Brand To Introduce New Commodities And Offerings Affect Extension Strategies Brands Microsoft PDF
This slide showcases affect of key extension strategies on major key performance indicators KPI and market insights. It provides details about lifetime value, audience share, customer retention rate, customer engagement, online promotion, etc. Boost your pitch with our creative Extending Brand To Introduce New Commodities And Offerings Affect Extension Strategies Brands Microsoft PDF. Deliver an awe inspiring pitch that will mesmerize everyone. Using these presentation templates you will surely catch everyones attention. You can browse the ppts collection on our website. We have researchers who are experts at creating the right content for the templates. So you do not have to invest time in any additional work. Just grab the template now and use them.
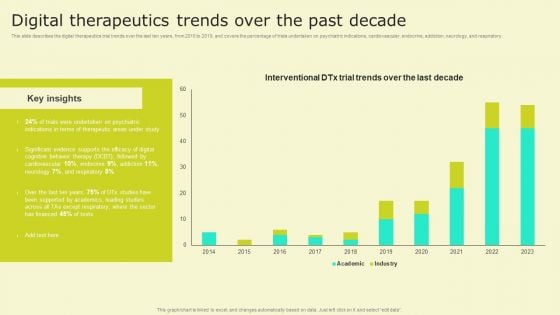
Digital Health Interventions Digital Therapeutics Trends Over The Past Decade Rules PDF
This slide describes the digital therapeutics trial trends over the last ten years, from 2010 to 2019, and covers the percentage of trials undertaken on psychiatric indications, cardiovascular, endocrine, addiction, neurology, and respiratory. Formulating a presentation can take up a lot of effort and time, so the content and message should always be the primary focus. The visuals of the PowerPoint can enhance the presenters message, so our Digital Health Interventions Digital Therapeutics Trends Over The Past Decade Rules PDF was created to help save time. Instead of worrying about the design, the presenter can concentrate on the message while our designers work on creating the ideal templates for whatever situation is needed. Slidegeeks has experts for everything from amazing designs to valuable content, we have put everything into Digital Health Interventions Digital Therapeutics Trends Over The Past Decade Rules PDF
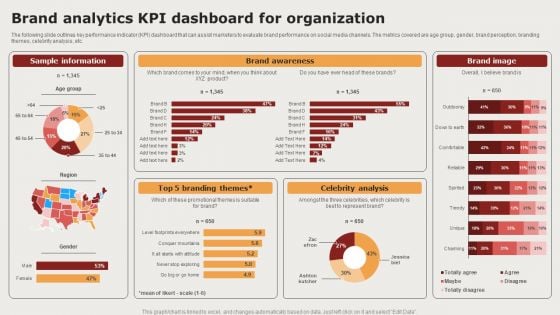
Creating Positioning Techniques For Market Research Brand Analytics Kpi Dashboard For Organization Slides PDF
The following slide outlines key performance indicator KPI dashboard that can assist marketers to evaluate brand performance on social media channels. The metrics covered are age group, gender, brand perception, branding themes, celebrity analysis, etc. Boost your pitch with our creative Creating Positioning Techniques For Market Research Brand Analytics Kpi Dashboard For Organization Slides PDF. Deliver an awe-inspiring pitch that will mesmerize everyone. Using these presentation templates you will surely catch everyones attention. You can browse the ppts collection on our website. We have researchers who are experts at creating the right content for the templates. So you do not have to invest time in any additional work. Just grab the template now and use them.
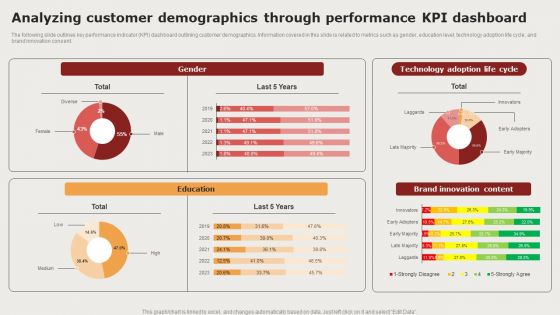
Creating Positioning Techniques For Market Research Analyzing Customer Demographics Through Performance Background PDF
The following slide outlines key performance indicator KPI dashboard outlining customer demographics. Information covered in this slide is related to metrics such as gender, education level, technology adoption life cycle, and brand innovation consent. If you are looking for a format to display your unique thoughts, then the professionally designed Creating Positioning Techniques For Market Research Analyzing Customer Demographics Through Performance Background PDF is the one for you. You can use it as a Google Slides template or a PowerPoint template. Incorporate impressive visuals, symbols, images, and other charts. Modify or reorganize the text boxes as you desire. Experiment with shade schemes and font pairings. Alter, share or cooperate with other people on your work. Download Creating Positioning Techniques For Market Research Analyzing Customer Demographics Through Performance Background PDF and find out how to give a successful presentation. Present a perfect display to your team and make your presentation unforgettable.
Digital Marketing Campaign Performance Tracking Kpis Ppt Infographic Template Information PDF
This slide shows the key performance indicators to measure the success or failure of the marketing campaign held by the organization. It includes metrics such as click through rate, conversion rate, return on marketing investment, revenue generated, total customer acquisition etc. Boost your pitch with our creative Digital Marketing Campaign Performance Tracking Kpis Ppt Infographic Template Information PDF. Deliver an awe-inspiring pitch that will mesmerize everyone. Using these presentation templates you will surely catch everyones attention. You can browse the ppts collection on our website. We have researchers who are experts at creating the right content for the templates. So you do not have to invest time in any additional work. Just grab the template now and use them.
Product Repositioning KPI Monitoring And Tracking Ppt PowerPoint Presentation File Infographic Template PDF
This slide highlights the key performance indicator of product repositioning which includes product sales, product demand in the market, position in the market and social media channels growth rate. If you are looking for a format to display your unique thoughts, then the professionally designed Product Repositioning KPI Monitoring And Tracking Ppt PowerPoint Presentation File Infographic Template PDF is the one for you. You can use it as a Google Slides template or a PowerPoint template. Incorporate impressive visuals, symbols, images, and other charts. Modify or reorganize the text boxes as you desire. Experiment with shade schemes and font pairings. Alter, share or cooperate with other people on your work. Download Product Repositioning KPI Monitoring And Tracking Ppt PowerPoint Presentation File Infographic Template PDF and find out how to give a successful presentation. Present a perfect display to your team and make your presentation unforgettable.
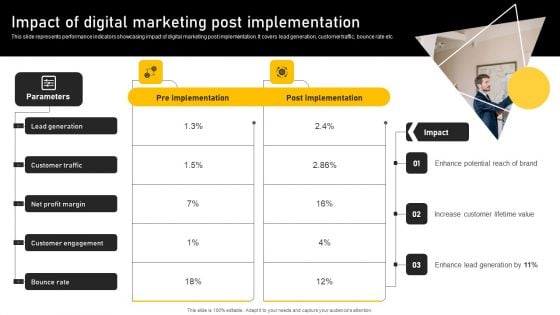
Online Ads Strategic Plan For Effective Marketing Impact Of Digital Marketing Post Implementation Pictures PDF
This slide represents performance indicators showcasing impact of digital marketing post implementation. It covers lead generation, customer traffic, bounce rate etc. Formulating a presentation can take up a lot of effort and time, so the content and message should always be the primary focus. The visuals of the PowerPoint can enhance the presenters message, so our Online Ads Strategic Plan For Effective Marketing How Advertisers Calculate CPC For Marketing Campaign Brochure PDF was created to help save time. Instead of worrying about the design, the presenter can concentrate on the message while our designers work on creating the ideal templates for whatever situation is needed. Slidegeeks has experts for everything from amazing designs to valuable content, we have put everything into Online Ads Strategic Plan For Effective Marketing How Advertisers Calculate CPC For Marketing Campaign Brochure PDF
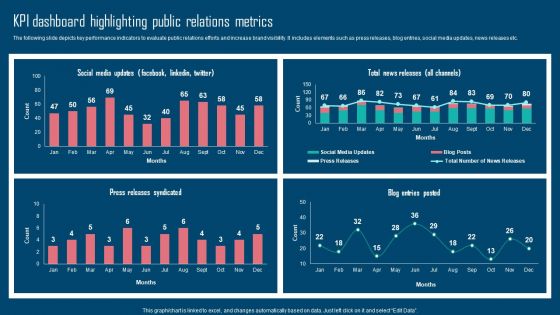
Adopting IMC Technique To Boost Brand Recognition Kpi Dashboard Highlighting Public Relations Metrics Brochure PDF
The following slide depicts key performance indicators to evaluate public relations efforts and increase brand visibility. It includes elements such as press releases, blog entries, social media updates, news releases etc. Formulating a presentation can take up a lot of effort and time, so the content and message should always be the primary focus. The visuals of the PowerPoint can enhance the presenters message, so our Adopting IMC Technique To Boost Brand Recognition Kpi Dashboard Highlighting Public Relations Metrics Brochure PDF was created to help save time. Instead of worrying about the design, the presenter can concentrate on the message while our designers work on creating the ideal templates for whatever situation is needed. Slidegeeks has experts for everything from amazing designs to valuable content, we have put everything into Adopting IMC Technique To Boost Brand Recognition Kpi Dashboard Highlighting Public Relations Metrics Brochure PDF
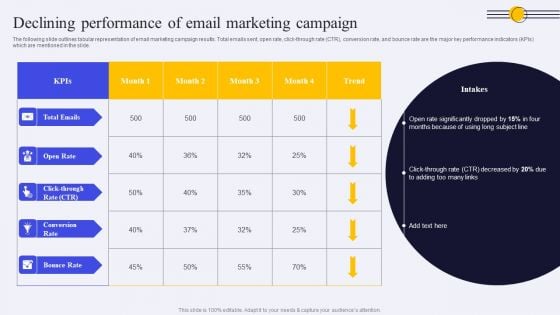
Declining Performance Of Email Marketing Campaign Ppt PowerPoint Presentation File Backgrounds PDF
The following slide outlines tabular representation of email marketing campaign results. Total emails sent, open rate, click through rate CTR, conversion rate, and bounce rate are the major key performance indicators KPIs which are mentioned in the slide. Boost your pitch with our creative Declining Performance Of Email Marketing Campaign Ppt PowerPoint Presentation File Backgrounds PDF. Deliver an awe inspiring pitch that will mesmerize everyone. Using these presentation templates you will surely catch everyones attention. You can browse the ppts collection on our website. We have researchers who are experts at creating the right content for the templates. So you do not have to invest time in any additional work. Just grab the template now and use them.
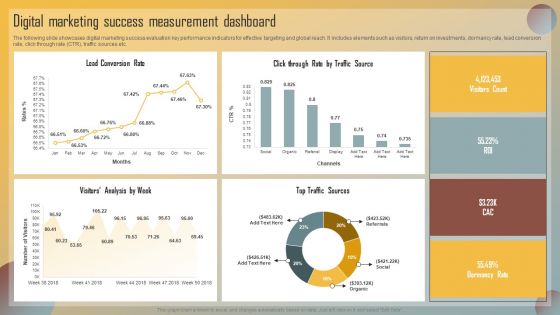
Guide For Marketing Analytics To Improve Decisions Digital Marketing Success Measurement Dashboard Guidelines PDF
The following slide showcases digital marketing success evaluation key performance indicators for effective targeting and global reach. It includes elements such as visitors, return on investments, dormancy rate, lead conversion rate, click through rate CTR, traffic sources etc. Boost your pitch with our creative Guide For Marketing Analytics To Improve Decisions Digital Marketing Success Measurement Dashboard Guidelines PDF. Deliver an awe-inspiring pitch that will mesmerize everyone. Using these presentation templates you will surely catch everyones attention. You can browse the ppts collection on our website. We have researchers who are experts at creating the right content for the templates. So you do not have to invest time in any additional work. Just grab the template now and use them.
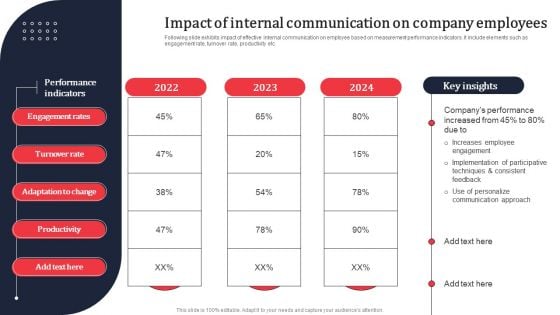
Impact Of Internal Communication On Company Employees Ppt PowerPoint Presentation File Example PDF
Following slide exhibits impact of effective internal communication on employee based on measurement performance indicators. It include elements such as engagement rate, turnover rate, productivity etc. If you are looking for a format to display your unique thoughts, then the professionally designed Impact Of Internal Communication On Company Employees Ppt PowerPoint Presentation File Example PDF is the one for you. You can use it as a Google Slides template or a PowerPoint template. Incorporate impressive visuals, symbols, images, and other charts. Modify or reorganize the text boxes as you desire. Experiment with shade schemes and font pairings. Alter, share or cooperate with other people on your work. Download Impact Of Internal Communication On Company Employees Ppt PowerPoint Presentation File Example PDF and find out how to give a successful presentation. Present a perfect display to your team and make your presentation unforgettable.
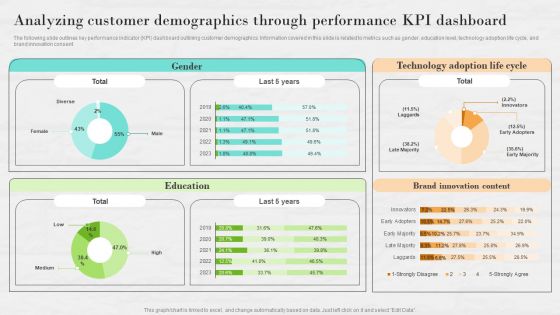
Market Research To Determine Business Opportunities Analyzing Customer Demographics Through Performance Brochure PDF
The following slide outlines key performance indicator KPI dashboard outlining customer demographics. Information covered in this slide is related to metrics such as gender, education level, technology adoption life cycle, and brand innovation consent. Boost your pitch with our creative Market Research To Determine Business Opportunities Analyzing Customer Demographics Through Performance Brochure PDF. Deliver an awe-inspiring pitch that will mesmerize everyone. Using these presentation templates you will surely catch everyones attention. You can browse the ppts collection on our website. We have researchers who are experts at creating the right content for the templates. So you do not have to invest time in any additional work. Just grab the template now and use them.
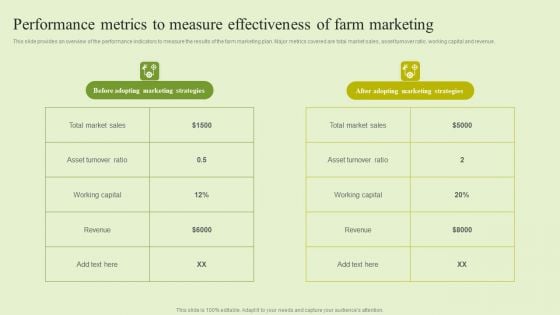
Agriculture Marketing Strategy To Improve Revenue Performance Performance Metrics To Measure Effectiveness Brochure PDF
This slide provides an overview of the performance indicators to measure the results of the farm marketing plan. Major metrics covered are total market sales, asset turnover ratio, working capital and revenue. Do you know about Slidesgeeks Agriculture Marketing Strategy To Improve Revenue Performance Performance Metrics To Measure Effectiveness Brochure PDF. These are perfect for delivering any kind od presentation. Using it, create PowerPoint presentations that communicate your ideas and engage audiences. Save time and effort by using our pre designed presentation templates that are perfect for a wide range of topic. Our vast selection of designs covers a range of styles, from creative to business, and are all highly customizable and easy to edit. Download as a PowerPoint template or use them as Google Slides themes.
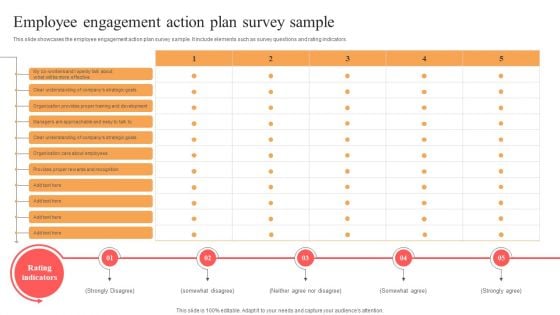
Implementing Techniques To Improve Employee Involvement Employee Engagement Action Plan Survey Sample Elements PDF
This slide showcases the employee engagement action plan survey sample. It include elements such as survey questions and rating indicators. If you are looking for a format to display your unique thoughts, then the professionally designed Implementing Techniques To Improve Employee Involvement Employee Engagement Action Plan Survey Sample Elements PDF is the one for you. You can use it as a Google Slides template or a PowerPoint template. Incorporate impressive visuals, symbols, images, and other charts. Modify or reorganize the text boxes as you desire. Experiment with shade schemes and font pairings. Alter, share or cooperate with other people on your work. Download Implementing Techniques To Improve Employee Involvement Employee Engagement Action Plan Survey Sample Elements PDF and find out how to give a successful presentation. Present a perfect display to your team and make your presentation unforgettable.
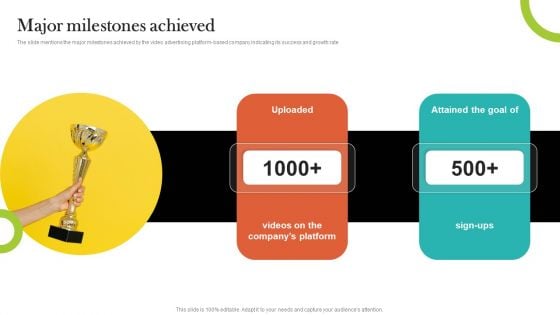
Video Promotion Service Investor Funding Elevator Pitch Deck Major Milestones Achieved Portrait PDF
The slide mentions the major milestones achieved by the video advertising platform-based company indicating its success and growth rate If you are looking for a format to display your unique thoughts, then the professionally designed Video Promotion Service Investor Funding Elevator Pitch Deck Major Milestones Achieved Portrait PDF is the one for you. You can use it as a Google Slides template or a PowerPoint template. Incorporate impressive visuals, symbols, images, and other charts. Modify or reorganize the text boxes as you desire. Experiment with shade schemes and font pairings. Alter, share or cooperate with other people on your work. Download Video Promotion Service Investor Funding Elevator Pitch Deck Major Milestones Achieved Portrait PDF and find out how to give a successful presentation. Present a perfect display to your team and make your presentation unforgettable.
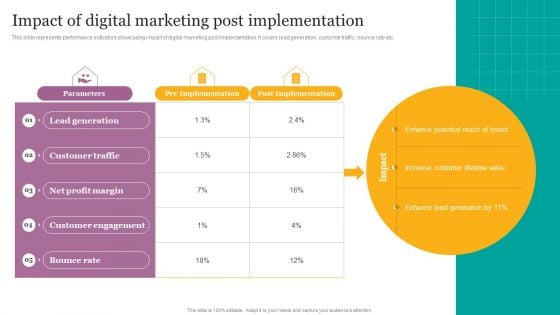
Impact Of Digital Marketing Post Implementation Ppt Ideas Templates PDF
This slide represents performance indicators showcasing impact of digital marketing post implementation. It covers lead generation, customer traffic, bounce rate etc. Find highly impressive Impact Of Digital Marketing Post Implementation Ppt Ideas Templates PDF on Slidegeeks to deliver a meaningful presentation. You can save an ample amount of time using these presentation templates. No need to worry to prepare everything from scratch because Slidegeeks experts have already done a huge research and work for you. You need to download Impact Of Digital Marketing Post Implementation Ppt Ideas Templates PDF for your upcoming presentation. All the presentation templates are 100 percent editable and you can change the color and personalize the content accordingly. Download now.
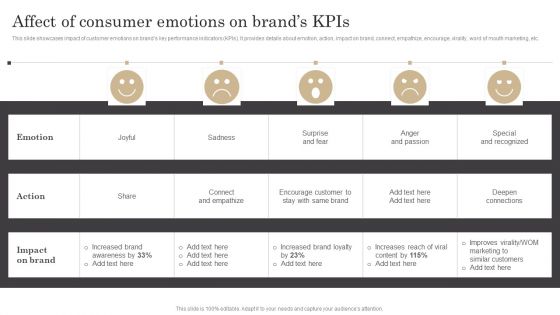
Affect Of Consumer Emotions On Brands Kpis Ppt Summary PDF
This slide showcases impact of customer emotions on brands key performance indicators KPIs. It provides details about emotion, action, impact on brand, connect, empathize, encourage, virality, word of mouth marketing, etc. If you are looking for a format to display your unique thoughts, then the professionally designed Affect Of Consumer Emotions On Brands Kpis Ppt Summary PDF is the one for you. You can use it as a Google Slides template or a PowerPoint template. Incorporate impressive visuals, symbols, images, and other charts. Modify or reorganize the text boxes as you desire. Experiment with shade schemes and font pairings. Alter, share or cooperate with other people on your work. Download Affect Of Consumer Emotions On Brands Kpis Ppt Summary PDF and find out how to give a successful presentation. Present a perfect display to your team and make your presentation unforgettable.
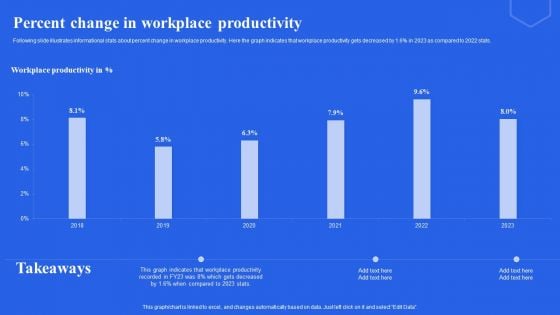
Percent Change In Workplace Productivity Ppt Pictures Slideshow PDF
Following slide illustrates informational stats about percent change in workplace productivity. Here the graph indicates that workplace productivity gets decreased by 1.6 percent in 2023 as compared to 2022 stats. Formulating a presentation can take up a lot of effort and time, so the content and message should always be the primary focus. The visuals of the PowerPoint can enhance the presenters message, so our Percent Change In Workplace Productivity Ppt Pictures Slideshow PDF was created to help save time. Instead of worrying about the design, the presenter can concentrate on the message while our designers work on creating the ideal templates for whatever situation is needed. Slidegeeks has experts for everything from amazing designs to valuable content, we have put everything into Percent Change In Workplace Productivity Ppt Pictures Slideshow PDF
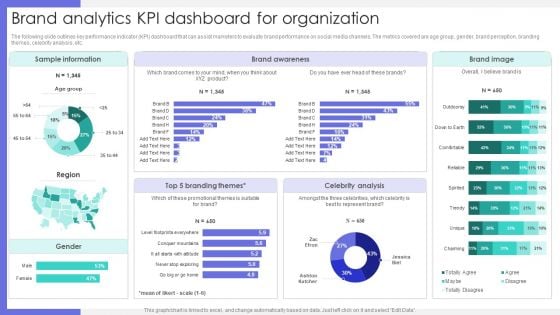
Brand Analytics Kpi Dashboard For Organization Ppt Portfolio Graphics Design PDF
The following slide outlines key performance indicator KPI dashboard that can assist marketers to evaluate brand performance on social media channels. The metrics covered are age group, gender, brand perception, branding themes, celebrity analysis, etc. Boost your pitch with our creative Brand Analytics Kpi Dashboard For Organization Ppt Portfolio Graphics Design PDF. Deliver an awe inspiring pitch that will mesmerize everyone. Using these presentation templates you will surely catch everyones attention. You can browse the ppts collection on our website. We have researchers who are experts at creating the right content for the templates. So you do not have to invest time in any additional work. Just grab the template now and use them.
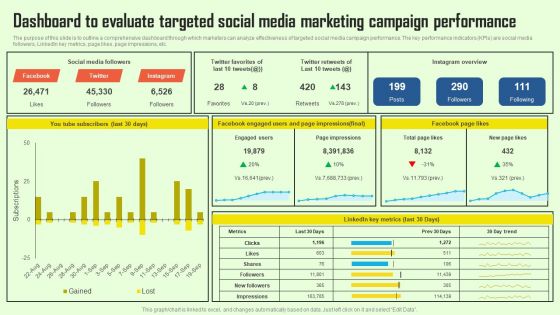
Increasing Consumer Engagement With Database Dashboard To Evaluate Targeted Social Media Portrait PDF
The purpose of this slide is to outline a comprehensive dashboard through which marketers can analyze effectiveness of targeted social media campaign performance. The key performance indicators KPIs are social media followers, LinkedIn key metrics, page likes, page impressions, etc. If you are looking for a format to display your unique thoughts, then the professionally designed Increasing Consumer Engagement With Database Dashboard To Evaluate Targeted Social Media Portrait PDF is the one for you. You can use it as a Google Slides template or a PowerPoint template. Incorporate impressive visuals, symbols, images, and other charts. Modify or reorganize the text boxes as you desire. Experiment with shade schemes and font pairings. Alter, share or cooperate with other people on your work. Download Increasing Consumer Engagement With Database Dashboard To Evaluate Targeted Social Media Portrait PDF and find out how to give a successful presentation. Present a perfect display to your team and make your presentation unforgettable.
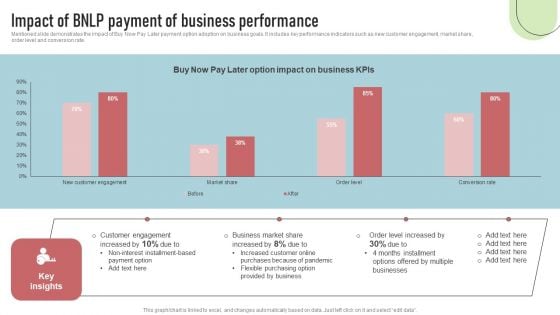
Cashless Payment Strategies To Enhance Business Performance Impact Of BNLP Payment Business Performance Mockup PDF
Mentioned slide demonstrates the impact of Buy Now Pay Later payment option adoption on business goals. It includes key performance indicators such as new customer engagement, market share, order level and conversion rate. Formulating a presentation can take up a lot of effort and time, so the content and message should always be the primary focus. The visuals of the PowerPoint can enhance the presenters message, so our Cashless Payment Strategies To Enhance Business Performance Impact Of BNLP Payment Business Performance Mockup PDF was created to help save time. Instead of worrying about the design, the presenter can concentrate on the message while our designers work on creating the ideal templates for whatever situation is needed. Slidegeeks has experts for everything from amazing designs to valuable content, we have put everything into Cashless Payment Strategies To Enhance Business Performance Impact Of BNLP Payment Business Performance Mockup PDF
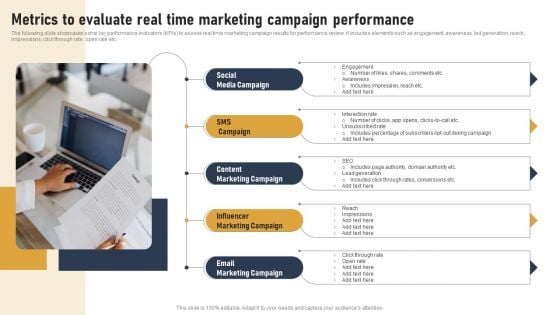
Incorporating Real Time Marketing For Improved Consumer Metrics To Evaluate Real Time Marketing Summary PDF
The following slide showcases some key performance indicators KPIs to assess real time marketing campaign results for performance review. It includes elements such as engagement, awareness, led generation, reach, impressions, click through rate, open rate etc. Formulating a presentation can take up a lot of effort and time, so the content and message should always be the primary focus. The visuals of the PowerPoint can enhance the presenters message, so our Incorporating Real Time Marketing For Improved Consumer Metrics To Evaluate Real Time Marketing Summary PDF was created to help save time. Instead of worrying about the design, the presenter can concentrate on the message while our designers work on creating the ideal templates for whatever situation is needed. Slidegeeks has experts for everything from amazing designs to valuable content, we have put everything into Incorporating Real Time Marketing For Improved Consumer Metrics To Evaluate Real Time Marketing Summary PDF
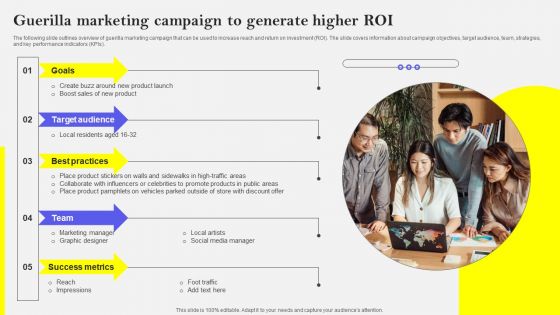
Guerilla Marketing Campaign To Generate Higher ROI Graphics PDF
The following slide outlines overview of guerilla marketing campaign that can be used to increase reach and return on investment ROI. The slide covers information about campaign objectives, target audience, team, strategies, and key performance indicators KPIs. If you are looking for a format to display your unique thoughts, then the professionally designed Guerilla Marketing Campaign To Generate Higher ROI Graphics PDF is the one for you. You can use it as a Google Slides template or a PowerPoint template. Incorporate impressive visuals, symbols, images, and other charts. Modify or reorganize the text boxes as you desire. Experiment with shade schemes and font pairings. Alter, share or cooperate with other people on your work. Download Guerilla Marketing Campaign To Generate Higher ROI Graphics PDF and find out how to give a successful presentation. Present a perfect display to your team and make your presentation unforgettable.
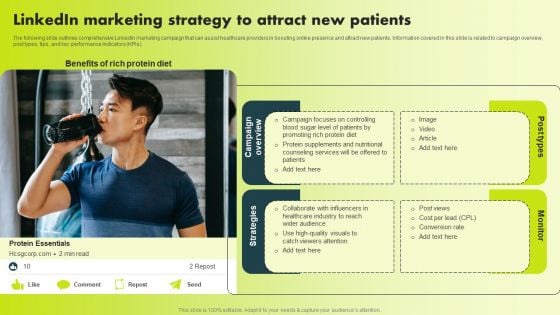
Linkedin Marketing Strategy To Attract New Patients Guidelines PDF
The following slide outlines comprehensive LinkedIn marketing campaign that can assist healthcare providers in boosting online presence and attract new patients. Information covered in this slide is related to campaign overview, post types, tips, and key performance indicators KPIs. If you are looking for a format to display your unique thoughts, then the professionally designed Linkedin Marketing Strategy To Attract New Patients Guidelines PDF is the one for you. You can use it as a Google Slides template or a PowerPoint template. Incorporate impressive visuals, symbols, images, and other charts. Modify or reorganize the text boxes as you desire. Experiment with shade schemes and font pairings. Alter, share or cooperate with other people on your work. Download Linkedin Marketing Strategy To Attract New Patients Guidelines PDF and find out how to give a successful presentation. Present a perfect display to your team and make your presentation unforgettable.
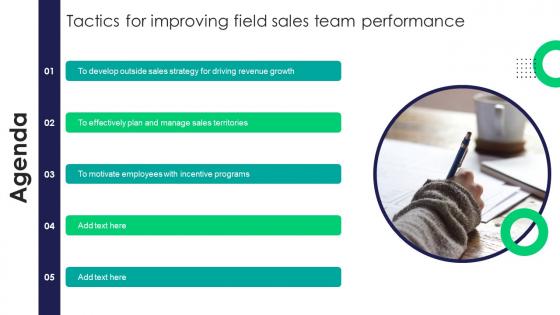
Agenda Tactics For Improving Field Sales Team Performance SA SS V
This slide showcases the impact of outside sales team with quarter-wise key performance indicators such as sales cycle length, cost per lead, win rate, etc. Boost your pitch with our creative Agenda Tactics For Improving Field Sales Team Performance SA SS V. Deliver an awe-inspiring pitch that will mesmerize everyone. Using these presentation templates you will surely catch everyones attention. You can browse the ppts collection on our website. We have researchers who are experts at creating the right content for the templates. So you do not have to invest time in any additional work. Just grab the template now and use them. Our Agenda Tactics For Improving Field Sales Team Performance SA SS V are topically designed to provide an attractive backdrop to any subject. Use them to look like a presentation pro.
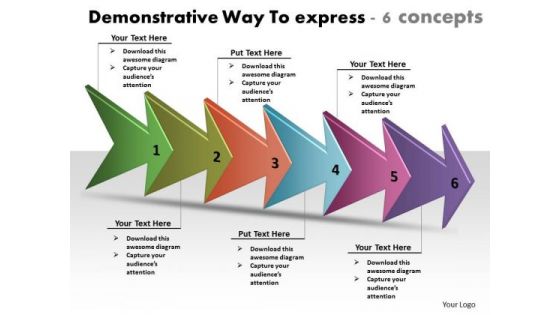
Demonstrative Way To Express 6 Concepts Network Mapping Freeware PowerPoint Templates
We present our demonstrative way to express 6 concepts network mapping freeware PowerPoint templates.Use our Arrows PowerPoint Templates because,You have configured your targets, identified your goals as per priority and importance. Use our Shapes PowerPoint Templates because,You can Raise your Company stocks at the Opening Bell. Use our Signs PowerPoint Templates because,They are the indicators of the path you have in mind. Use our Business PowerPoint Templates because,This layout helps you to bring some important aspects of your business process to the notice of all concerned. Streamline the flow of information across the board Use our Process and Flows PowerPoint Templates because,This slide is Designed to help bullet-point your views and thoughts.Use these PowerPoint slides for presentations relating to adventure, africa, blue, car, danger, democracy, demonstrations, desert, distance, dust, excursion, fels, ferien, flat, gebirge, hamada, holiday destination, horizon, housing, jeep, landscape, might, picking, piste, politics, rally, rallye, road, sahara, sand desert, sky, tourism, travelling, tunis, tunisia, turbulences, vacation. The prominent colors used in the PowerPoint template are Purple, Pink, Blue. People tell us our demonstrative way to express 6 concepts network mapping freeware PowerPoint templates are Dazzling. The feedback we get is that our desert PowerPoint templates and PPT Slides are Attractive. People tell us our demonstrative way to express 6 concepts network mapping freeware PowerPoint templates will help them to explain complicated concepts. Presenters tell us our demonstrations PowerPoint templates and PPT Slides are Great. The feedback we get is that our demonstrative way to express 6 concepts network mapping freeware PowerPoint templates are Colorful. Professionals tell us our car PowerPoint templates and PPT Slides are Chic. Our Demonstrative Way To Express 6 Concepts Network Mapping Freeware PowerPoint Templates are like an excellent buffet. An array of delicious dishes to choose from.
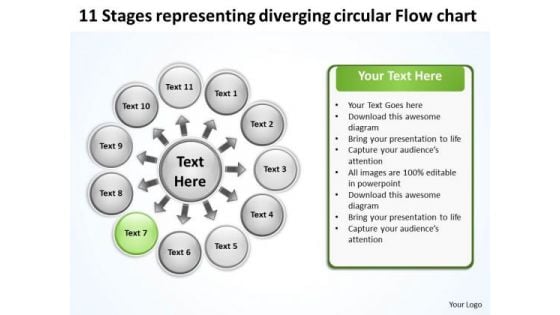
Representing Diverging Circular Flow Chart Relative Cycle Arrow Diagram PowerPoint Templates
We present our representing diverging circular flow chart Relative Cycle Arrow Diagram PowerPoint templates.Download and present our Ring charts PowerPoint Templates because you can present your opinions in this field using our impressive templates. Download and present our Circle charts PowerPoint Templates because stable ideas are the building blocks of a sucessful structure. Use our Business PowerPoint Templates because it illustrates the city with a lasting tryst with resilience. You epitomise the qualities that give your city its fame. Present our Marketing PowerPoint Templates because customer satisfaction is a mantra of the marketplace. Building a loyal client base is an essential element of your business. Use our Process and Flows PowerPoint Templates because all elements of the venture are equally critical.Use these PowerPoint slides for presentations relating to Button,cerulean, circle, circulation, cobalt,colorful, cyan, cycle, element,emblem, grayshadow, green,icon, indicator, interface, internet, label,link, load, marker, motion, movement,navigationpanel, next, orientation, pagsite, pink, pointer, previous, process, reload, rotation, satined, sign, signpost,smooth, sticker, sticky, symbol. The prominent colors used in the PowerPoint template are Green, Black, White. Customers tell us our representing diverging circular flow chart Relative Cycle Arrow Diagram PowerPoint templates are designed by a team of presentation professionals. We assure you our element PowerPoint templates and PPT Slides are readymade to fit into any presentation structure. PowerPoint presentation experts tell us our representing diverging circular flow chart Relative Cycle Arrow Diagram PowerPoint templates are Detailed. People tell us our circle PowerPoint templates and PPT Slides are Striking. We assure you our representing diverging circular flow chart Relative Cycle Arrow Diagram PowerPoint templates are Endearing. Use our circulation PowerPoint templates and PPT Slides are Delightful. Cross continents with our Representing Diverging Circular Flow Chart Relative Cycle Arrow Diagram PowerPoint Templates. Your thoughts will cover the earth.
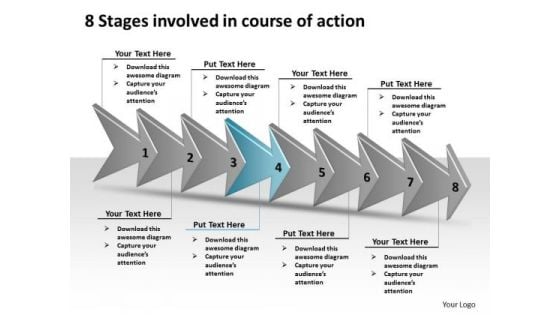
8 Stages Involved Course Of Action Make Flowchart PowerPoint Slides
We present our 8 stages involved course of action make flowchart PowerPoint Slides.Use our Leadership PowerPoint Templates because this diagram can be used to illustrate the logical path or system. Download and present our Shapes PowerPoint Templates because with the help of our Slides you can Illustrate your plans on using the many social media modes available to inform soceity at large of the benefits of your product. Use our Signs PowerPoint Templates because you must Evolve the strategy to take you down the required path with appropriate, efficient and effective marketing along the way. Download our Arrows PowerPoint Templates because we provide the means to project your views. Download and present our Process and Flows PowerPoint Templates because the Venn graphic comprising interlinking circles geometrically demonstate how various functions operating independantly, to a large extent, are essentially interdependant.Use these PowerPoint slides for presentations relating to Designator, blue bottom, circular cobalt banner, clean group badge, clear directional, crimson application icon, down load, download, circle marker, filter grain, front, grunge, grungy, internet page site, left orientation, magenta cursor symbol, monochromatic texture, monochrome pattern, navigation panel, next indicator, noise effect, Arrows sign, push, red pointer pictogram, redo, right, round shape, scattered surface,. The prominent colors used in the PowerPoint template are Blue light, White, Gray. The feedback we get is that our 8 stages involved course of action make flowchart PowerPoint Slides are Pleasant. People tell us our cobalt PowerPoint templates and PPT Slides are Attractive. We assure you our 8 stages involved course of action make flowchart PowerPoint Slides are Upbeat. Presenters tell us our cobalt PowerPoint templates and PPT Slides are One-of-a-kind. We assure you our 8 stages involved course of action make flowchart PowerPoint Slides will make you look like a winner. Use our group PowerPoint templates and PPT Slides are Splendid. Beat mediocrity with our 8 Stages Involved Course Of Action Make Flowchart PowerPoint Slides. You will come out on top.
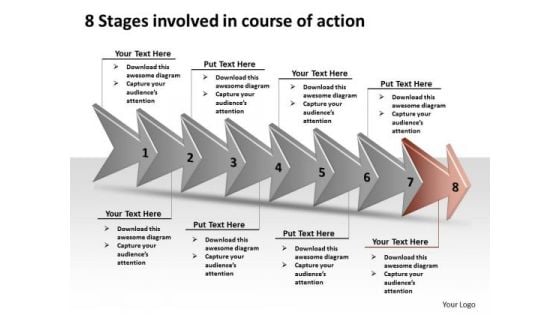
8 Stages Involved Course Of Action Ppt Production Flow Charts PowerPoint Slides
We present our 8 stages involved course of action ppt production flow charts PowerPoint Slides.Download our Leadership PowerPoint Templates because this diagram can be used to illustrate the logical path or system. Download our Shapes PowerPoint Templates because it Educates your team with your thoughts and logic. Present our Signs PowerPoint Templates because some opportunities are bound to be highly profitable for you to follow up. Use our Arrows PowerPoint Templates because we all know that alphabetical order is a time honoured concept. Download our Process and Flows PowerPoint Templates because this slide helps you to give your team an overview of your capability and insight into the minute details of the overall picture highlighting the interdependence at every operational level.Use these PowerPoint slides for presentations relating to Around, Arrows, artistic, bevel, bright, concept, conceptual, decrease, design, direction, down, ecology, high, icon, illustration, increase, indication, isolated, low, motion, movement, nature, opposite, point, protection, recycling, red, reflection, renewable, reuse, set, shinning, sign, stylish, symbol. The prominent colors used in the PowerPoint template are White, Black, Gray. The feedback we get is that our 8 stages involved course of action ppt production flow charts PowerPoint Slides are Youthful. People tell us our decrease PowerPoint templates and PPT Slides are Wistful. We assure you our 8 stages involved course of action ppt production flow charts PowerPoint Slides are Striking. Presenters tell us our design PowerPoint templates and PPT Slides are Gorgeous. We assure you our 8 stages involved course of action ppt production flow charts PowerPoint Slides are Charming. Use our concept PowerPoint templates and PPT Slides are Dynamic. Try our 8 Stages Involved Course Of Action Ppt Production Flow Charts PowerPoint Slides and get bitten by the bug. You will cease to consider anything else.
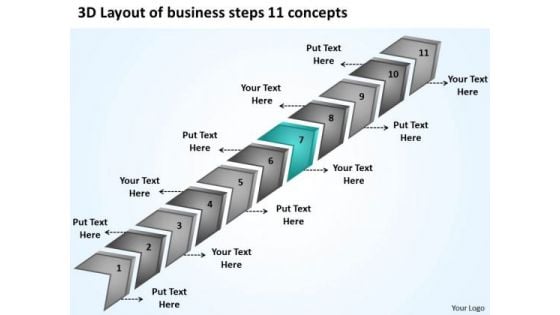
PowerPoint Templates Download Steps 11 Concepts Making Business Plan Slides
We present our powerpoint templates download steps 11 concepts making business plan Slides.Download and present our Business PowerPoint Templates because you have had a great year or so business wise. It is time to celebrate the efforts of your team. Use our Arrows PowerPoint Templates because spreading the light of knowledge around you will clear the doubts and enlighten the questioning minds with your brilliance and ability. Use our Shapes PowerPoint Templates because this diagram has the unique ability to drive home your ideas and show how they mesh to guarantee success. Use our Signs PowerPoint Templates because they are the indicators of the path you have in mind. Use our Process and Flows PowerPoint Templates because you can Bullet-point your thoughts and ideas to profitably accomplish every step of every stage along the way.Use these PowerPoint slides for presentations relating to Age, Ancient, Antique, Arrows, Art, Artistic, Background, Colorful, Colors, Contemporary, Decoration, Design, Dirt, Dynamic, Edge, Element, Frame, Future, Grunge, Illustration, Linear, Lines, Modern, Pattern, Place, Pointer, Poster, Texture, Vintage. The prominent colors used in the PowerPoint template are Green, Gray, Black. We assure you our powerpoint templates download steps 11 concepts making business plan Slides are Luxuriant. We assure you our Colorful PowerPoint templates and PPT Slides are Fun. Customers tell us our powerpoint templates download steps 11 concepts making business plan Slides are Stylish. Presenters tell us our Art PowerPoint templates and PPT Slides are Colorful. You can be sure our powerpoint templates download steps 11 concepts making business plan Slides are Efficient. The feedback we get is that our Arrows PowerPoint templates and PPT Slides are Second to none. Your ideas will never go out of fashion. Our PowerPoint Templates Download Steps 11 Concepts Making Business Plan Slides will keep them contemporary.
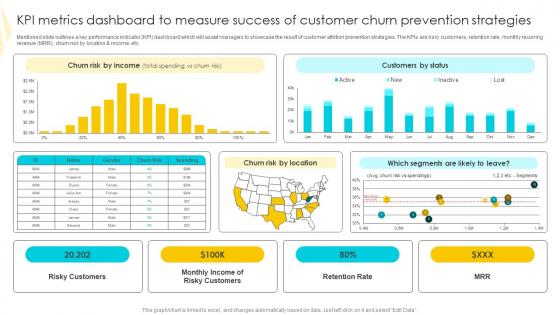
KPI Metrics Dashboard To Measure Strategies To Mitigate Customer Churn Formats Pdf
Mentioned slide outlines a key performance indicator KPI dashboard which will assist managers to showcase the result of customer attrition prevention strategies. The KPIs are risky customers, retention rate, monthly recurring revenue MRR, churn risk by location and income, etc. This KPI Metrics Dashboard To Measure Strategies To Mitigate Customer Churn Formats Pdf is perfect for any presentation, be it in front of clients or colleagues. It is a versatile and stylish solution for organizing your meetings. The KPI Metrics Dashboard To Measure Strategies To Mitigate Customer Churn Formats Pdf features a modern design for your presentation meetings. The adjustable and customizable slides provide unlimited possibilities for acing up your presentation. Slidegeeks has done all the homework before launching the product for you. So, do not wait, grab the presentation templates today Mentioned slide outlines a key performance indicator KPI dashboard which will assist managers to showcase the result of customer attrition prevention strategies. The KPIs are risky customers, retention rate, monthly recurring revenue MRR, churn risk by location and income, etc.
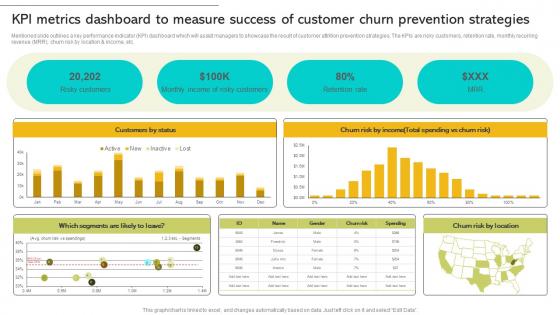
Implementing Strategies To Enhance Kpi Metrics Dashboard To Measure Success Of Customer Churn Ideas PDF
Mentioned slide outlines a key performance indicator KPI dashboard which will assist managers to showcase the result of customer attrition prevention strategies. The KPIs are risky customers, retention rate, monthly recurring revenue MRR, churn risk by location and income, etc. Explore a selection of the finest Implementing Strategies To Enhance Kpi Metrics Dashboard To Measure Success Of Customer Churn Ideas PDF here. With a plethora of professionally designed and pre-made slide templates, you can quickly and easily find the right one for your upcoming presentation. You can use our Implementing Strategies To Enhance Kpi Metrics Dashboard To Measure Success Of Customer Churn Ideas PDF to effectively convey your message to a wider audience. Slidegeeks has done a lot of research before preparing these presentation templates. The content can be personalized and the slides are highly editable. Grab templates today from Slidegeeks. Mentioned slide outlines a key performance indicator KPI dashboard which will assist managers to showcase the result of customer attrition prevention strategies. The KPIs are risky customers, retention rate, monthly recurring revenue MRR, churn risk by location and income, etc.
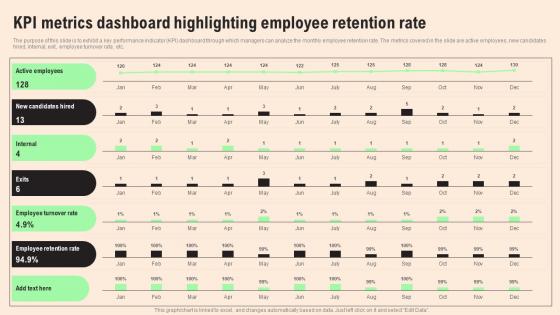
KPI Metrics Dashboard Highlighting HR Retention Techniques For Business Owners Slides Pdf
The purpose of this slide is to exhibit a key performance indicator KPI dashboard through which managers can analyze the monthly employee retention rate. The metrics covered in the slide are active employees, new candidates hired, internal, exit, employee turnover rate, etc. Slidegeeks is one of the best resources for PowerPoint templates. You can download easily and regulate KPI Metrics Dashboard Highlighting HR Retention Techniques For Business Owners Slides Pdf for your personal presentations from our wonderful collection. A few clicks is all it takes to discover and get the most relevant and appropriate templates. Use our Templates to add a unique zing and appeal to your presentation and meetings. All the slides are easy to edit and you can use them even for advertisement purposes. The purpose of this slide is to exhibit a key performance indicator KPI dashboard through which managers can analyze the monthly employee retention rate. The metrics covered in the slide are active employees, new candidates hired, internal, exit, employee turnover rate, etc.
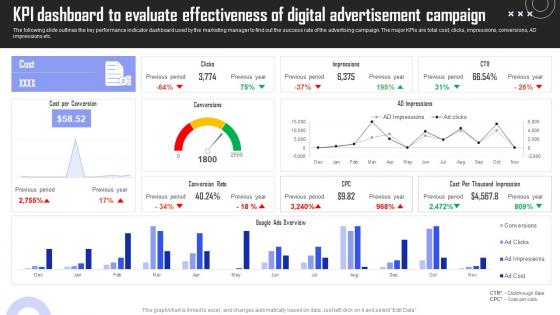
KPI Dashboard Evaluate Brand Building Techniques To Gain Competitive Edge Template Pdf
The following slide outlines the key performance indicator dashboard used by the marketing manager to find out the success rate of the advertising campaign. The major KPIs are total cost, clicks, impressions, conversions, AD impressions etc. Explore a selection of the finest KPI Dashboard Evaluate Brand Building Techniques To Gain Competitive Edge Template Pdf here. With a plethora of professionally designed and pre made slide templates, you can quickly and easily find the right one for your upcoming presentation. You can use our KPI Dashboard Evaluate Brand Building Techniques To Gain Competitive Edge Template Pdf to effectively convey your message to a wider audience. Slidegeeks has done a lot of research before preparing these presentation templates. The content can be personalized and the slides are highly editable. Grab templates today from Slidegeeks. The following slide outlines the key performance indicator dashboard used by the marketing manager to find out the success rate of the advertising campaign. The major KPIs are total cost, clicks, impressions, conversions, AD impressions etc.
Online Tracking Optimize Website Marketing Intelligence Guide Data Gathering Introduction Pdf
The following slide provides overview of performance indicators for online tracking to manage and optimize user behavior on website. It highlights metrics such as web conversions, users, top landing pages, bounce rate, conversion rate, page, sessions and goals value. Presenting this PowerPoint presentation, titled Online Tracking Optimize Website Marketing Intelligence Guide Data Gathering Introduction Pdf, with topics curated by our researchers after extensive research. This editable presentation is available for immediate download and provides attractive features when used. Download now and captivate your audience. Presenting this Online Tracking Optimize Website Marketing Intelligence Guide Data Gathering Introduction Pdf. Our researchers have carefully researched and created these slides with all aspects taken into consideration. This is a completely customizable Online Tracking Optimize Website Marketing Intelligence Guide Data Gathering Introduction Pdf that is available for immediate downloading. Download now and make an impact on your audience. Highlight the attractive features available with our PPTs. The following slide provides overview of performance indicators for online tracking to manage and optimize user behavior on website. It highlights metrics such as web conversions, users, top landing pages, bounce rate, conversion rate, page, sessions and goals value.
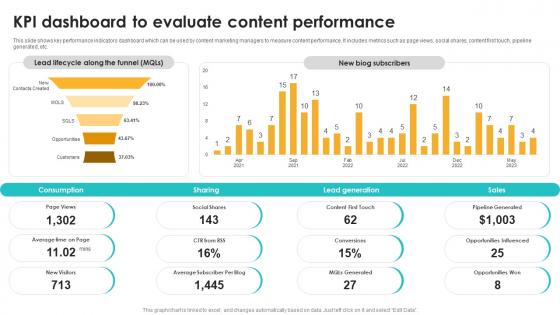
Kpi Dashboard To Evaluate Content Performance Seo Content Plan To Drive Strategy SS V
This slide shows key performance indicators dashboard which can be used by content marketing managers to measure content performance. It includes metrics such as page views, social shares, content first touch, pipeline generated, etc. This Kpi Dashboard To Evaluate Content Performance Seo Content Plan To Drive Strategy SS V is perfect for any presentation, be it in front of clients or colleagues. It is a versatile and stylish solution for organizing your meetings. The Kpi Dashboard To Evaluate Content Performance Seo Content Plan To Drive Strategy SS V features a modern design for your presentation meetings. The adjustable and customizable slides provide unlimited possibilities for acing up your presentation. Slidegeeks has done all the homework before launching the product for you. So, do not wait, grab the presentation templates today This slide shows key performance indicators dashboard which can be used by content marketing managers to measure content performance. It includes metrics such as page views, social shares, content first touch, pipeline generated, etc.
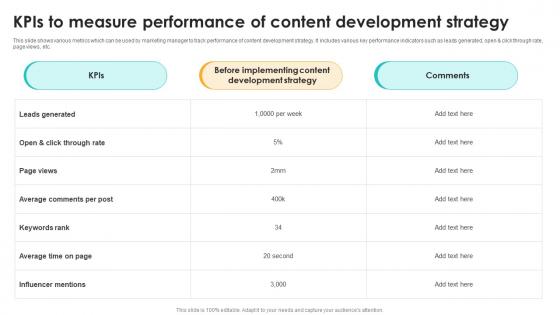
Kpis To Measure Performance Of Content Development Strategy Seo Content Plan To Drive Strategy SS V
This slide shows various metrics which can be used by marketing manager to track performance of content development strategy. It includes various key performance indicators such as leads generated, open and click through rate, page views, etc. Explore a selection of the finest Kpis To Measure Performance Of Content Development Strategy Seo Content Plan To Drive Strategy SS V here. With a plethora of professionally designed and pre-made slide templates, you can quickly and easily find the right one for your upcoming presentation. You can use our Kpis To Measure Performance Of Content Development Strategy Seo Content Plan To Drive Strategy SS V to effectively convey your message to a wider audience. Slidegeeks has done a lot of research before preparing these presentation templates. The content can be personalized and the slides are highly editable. Grab templates today from Slidegeeks. This slide shows various metrics which can be used by marketing manager to track performance of content development strategy. It includes various key performance indicators such as leads generated, open and click through rate, page views, etc.
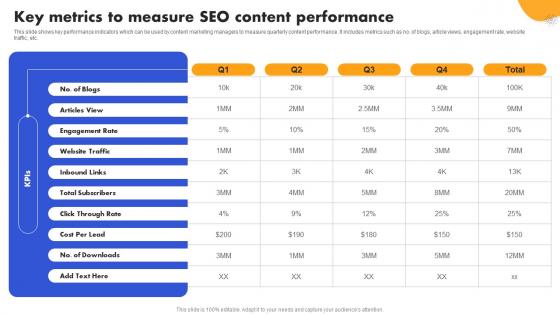
SEO Strategy To Improve ROI Key Metrics To Measure SEO Content Strategy SS V
This slide shows key performance indicators which can be used by content marketing managers to measure quarterly content performance. It includes metrics such as no. of blogs, article views, engagement rate, website traffic, etc. Coming up with a presentation necessitates that the majority of the effort goes into the content and the message you intend to convey. The visuals of a PowerPoint presentation can only be effective if it supplements and supports the story that is being told. Keeping this in mind our experts created SEO Strategy To Improve ROI Key Metrics To Measure SEO Content Strategy SS V to reduce the time that goes into designing the presentation. This way, you can concentrate on the message while our designers take care of providing you with the right template for the situation. This slide shows key performance indicators which can be used by content marketing managers to measure quarterly content performance. It includes metrics such as no. of blogs, article views, engagement rate, website traffic, etc.
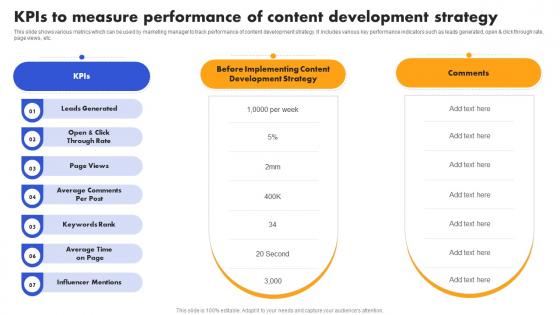
SEO Strategy To Improve ROI Kpis To Measure Performance Of Content Strategy SS V
This slide shows various metrics which can be used by marketing manager to track performance of content development strategy. It includes various key performance indicators such as leads generated, open and click through rate, page views, etc. Explore a selection of the finest SEO Strategy To Improve ROI Kpis To Measure Performance Of Content Strategy SS V here. With a plethora of professionally designed and pre-made slide templates, you can quickly and easily find the right one for your upcoming presentation. You can use our SEO Strategy To Improve ROI Kpis To Measure Performance Of Content Strategy SS V to effectively convey your message to a wider audience. Slidegeeks has done a lot of research before preparing these presentation templates. The content can be personalized and the slides are highly editable. Grab templates today from Slidegeeks. This slide shows various metrics which can be used by marketing manager to track performance of content development strategy. It includes various key performance indicators such as leads generated, open and click through rate, page views, etc.
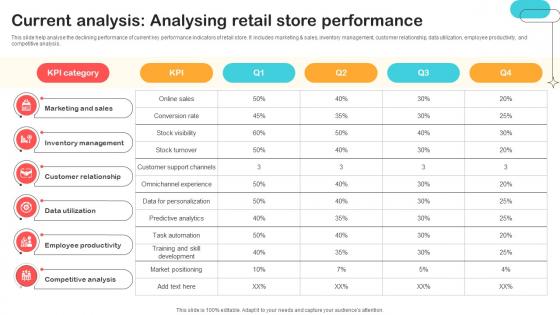
Current Analysis Analysing Retail Store Performance Optimizing Retail Operations With Digital DT SS V
This slide help analyse the declining performance of current key performance indicators of retail store. It includes marketing and sales, inventory management, customer relationship, data utilization, employee productivity, and competitive analysis.Whether you have daily or monthly meetings, a brilliant presentation is necessary. Current Analysis Analysing Retail Store Performance Optimizing Retail Operations With Digital DT SS V can be your best option for delivering a presentation. Represent everything in detail using Current Analysis Analysing Retail Store Performance Optimizing Retail Operations With Digital DT SS V and make yourself stand out in meetings. The template is versatile and follows a structure that will cater to your requirements. All the templates prepared by Slidegeeks are easy to download and edit. Our research experts have taken care of the corporate themes as well. So, give it a try and see the results. This slide help analyse the declining performance of current key performance indicators of retail store. It includes marketing and sales, inventory management, customer relationship, data utilization, employee productivity, and competitive analysis.


 Continue with Email

 Home
Home


