Score Meter
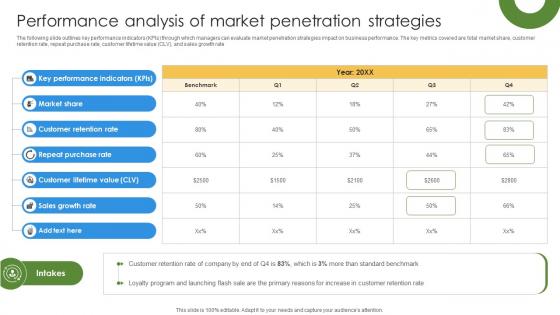
Marketing Growth Strategy To Performance Analysis Of Market Penetration Strategies Strategy SS V
The following slide outlines key performance indicators KPIs through which managers can evaluate market penetration strategies impact on business performance. The key metrics covered are total market share, customer retention rate, repeat purchase rate, customer lifetime value CLV, and sales growth rate. Slidegeeks is here to make your presentations a breeze with Marketing Growth Strategy To Performance Analysis Of Market Penetration Strategies Strategy SS V With our easy-to-use and customizable templates, you can focus on delivering your ideas rather than worrying about formatting. With a variety of designs to choose from, you are sure to find one that suits your needs. And with animations and unique photos, illustrations, and fonts, you can make your presentation pop. So whether you are giving a sales pitch or presenting to the board, make sure to check out Slidegeeks first The following slide outlines key performance indicators KPIs through which managers can evaluate market penetration strategies impact on business performance. The key metrics covered are total market share, customer retention rate, repeat purchase rate, customer lifetime value CLV, and sales growth rate.
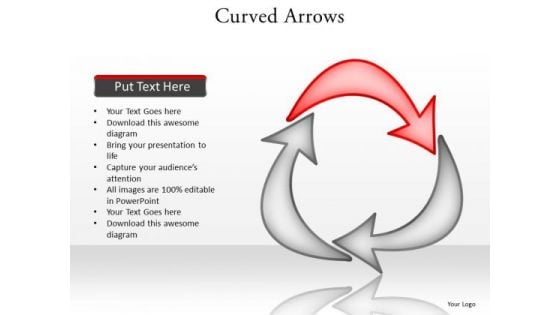
Ppt Stage 1 Curved Arrow Forming Triangle PowerPoint Templates
PPT stage 1 curved arrow forming triangle PowerPoint Templates-This PowerPoint Diagram shows the highlighted red arrow signifying the process is going on. It portrays the concept of bolt, cursor, dart, indicator, missile, pointer, projectile, shaft, achievement, attainment, close, conclusion, consummation, culmination, curtains, dispatch etc.-Can be used for presentations on abstract, arrow, art, brand, circle, clip-art, collection, curve, decoration, design, dot, elements, ellipse, form, geometric, glossy, graphic, icon, illustration, image, mirror, service, symbol-PPT stage 1 curved arrow forming triangle PowerPoint Templates Collect all the evidence on our Ppt Stage 1 Curved Arrow Forming Triangle PowerPoint Templates. Connect the clues and come to conclusions with ease.
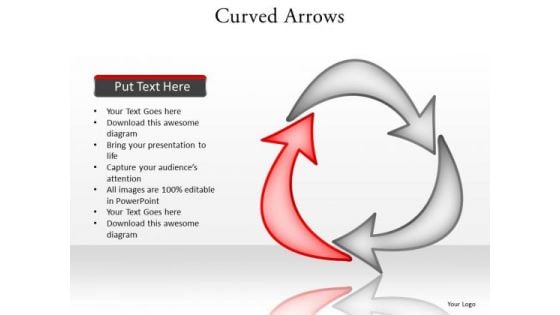
Ppt Stage 3 Curved Arrow Forming Triangle Presentation PowerPoint Templates
PPT stage 3 curved arrow forming triangle presentation PowerPoint Templates-This PowerPoint Diagram shows the highlighted red arrow signifying the process is going on. It portrays the concept of bolt, cursor, dart, indicator, missile, pointer, projectile, shaft, achievement, attainment, close, conclusion, consummation, culmination, curtains, dispatch etc.-Can be used for presentations on abstract, arrow, art, brand, circle, clip-art, collection, curve, decoration, design, dot, elements, ellipse, form, geometric, glossy, graphic, icon, illustration, image, mirror, service, symbol-PPT stage 3 curved arrow forming triangle presentation PowerPoint Templates Raise the bar with our Ppt Stage 3 Curved Arrow Forming Triangle Presentation PowerPoint Templates. You will come out on top.
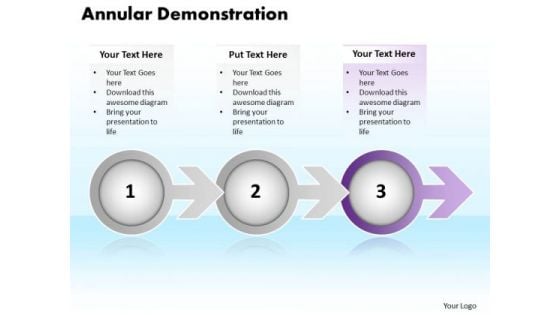
Ppt Annular Demonstration Of 3 Power Point Stage Using Arrow PowerPoint Templates
PPT annular demonstration of 3 power point stage using arrow PowerPoint Templates-This PowerPoint diagram shows three circles connected with arrows. Circles defines path functions and arrows indicate the progression of the process-PPT annular demonstration of 3 power point stage using arrow PowerPoint Templates-3d, Arrow, Bevel, Blue, Boy, Bright, Circular, Concept, Design, Fancy, Funky, Graphic, Icon, Illustration, Isolated, Logo, Male, Man, Reflection, Shinning, Sign, Symbol, Vivid Be a creative business leader with our Ppt Annular Demonstration Of 3 Power Point Stage Using Arrow PowerPoint Templates. They will make you look good.
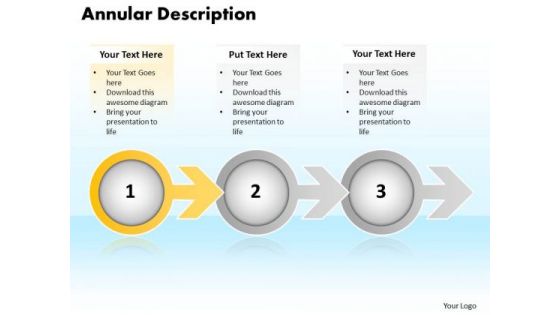
Ppt Annular Description Of 3 State Diagram Using Arrow PowerPoint Templates
PPT annular description of 3 state diagram using arrow PowerPoint Templates-This PowerPoint diagram shows three circles connected with arrows. Circles defines path functions and arrows indicate the progression of the process-PPT annular description of 3 state diagram using arrow PowerPoint Templates-3d, Arrow, Bevel, Blue, Boy, Bright, Circular, Concept, Design, Fancy, Funky, Graphic, Icon, Illustration, Isolated, Logo, Male, Man, Reflection, Shinning, Sign, Symbol, Vivid You are entitled to excellence. Demand your due from our Ppt Annular Description Of 3 State Diagram Using Arrow PowerPoint Templates.
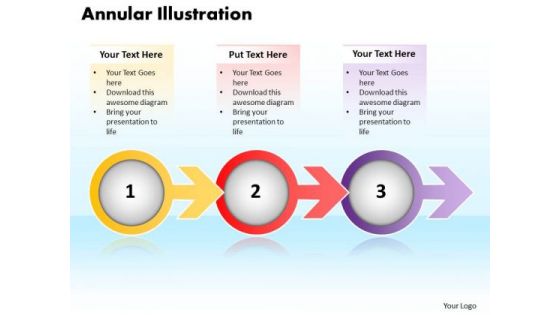
Ppt Annular Illustration Of 3 State PowerPoint Template Diagram Using Arrow Templates
PPT annular illustration of 3 state powerpoint template diagram using arrow Templates-This PowerPoint diagram shows three circles connected with arrows. Circles defines path functions and arrows indicate the progression of the process-PPT annular illustration of 3 state powerpoint template diagram using arrow Templates-3d, Arrow, Bevel, Blue, Boy, Bright, Circular, Concept, Design, Fancy, Funky, Graphic, Icon, Illustration, Isolated, Logo, Male, Man, Reflection, Shinning, Sign, Symbol, Vivid Enter the professional club with our Ppt Annular Illustration Of 3 State PowerPoint Template Diagram Using Arrow Templates. You will come out on top.
Eight Stages To Develop A CRM Plan Ppt PowerPoint Presentation Icon Picture PDF
Presenting eight stages to develop a crm plan ppt powerpoint presentation icon picture pdf to dispense important information. This template comprises eight stages. It also presents valuable insights into the topics including define your crm strategy vision and goals, define your target customer with buyer personas, define your customer journey, establish the processes for a 360 customer experience, study the market and know your positioning, knowing your product or service, invest in crm software, setting key performance indicators kpis for each team. This is a completely customizable PowerPoint theme that can be put to use immediately. So, download it and address the topic impactfully.
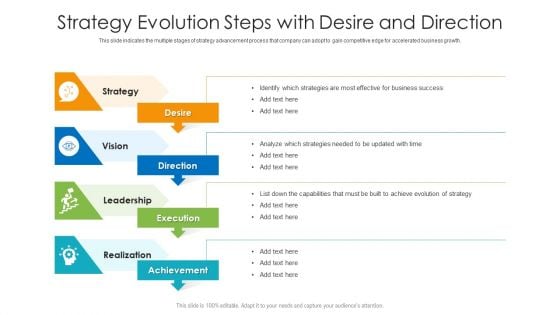
Strategy Evolution Steps With Desire And Direction Ppt Infographic Template Examples PDF
This slide indicates the multiple stages of strategy advancement process that company can adopt to gain competitive edge for accelerated business growth. Persuade your audience using this strategy evolution steps with desire and direction ppt infographic template examples pdf. This PPT design covers four stages, thus making it a great tool to use. It also caters to a variety of topics including strategy, evolution, achievement. Download this PPT design now to present a convincing pitch that not only emphasizes the topic but also showcases your presentation skills.
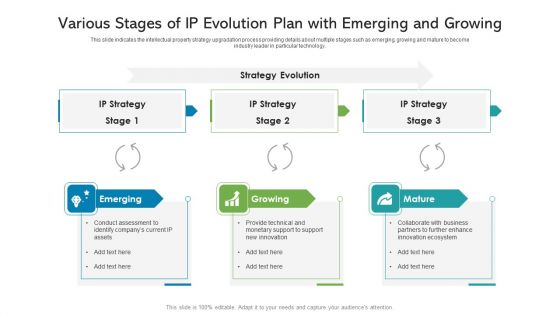
Various Stages Of IP Evolution Plan With Emerging And Growing Ppt Infographic Template Display PDF
This slide indicates the intellectual property strategy upgradation process providing details about multiple stages such as emerging, growing and mature to become industry leader in particular technology. Presenting various stages of ip evolution plan with emerging and growing ppt infographic template display pdf to dispense important information. This template comprises three stages. It also presents valuable insights into the topics including evolution, strategy, technical. This is a completely customizable PowerPoint theme that can be put to use immediately. So, download it and address the topic impactfully.
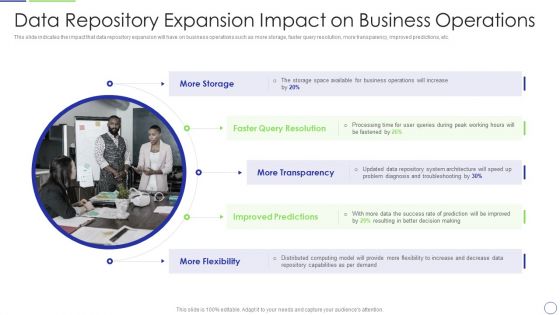
Developing Organization Primary Data Storage Action Plan Data Repository Expansion Impact On Business Operations Formats PDF
This slide indicates the impact that data repository expansion will have on business operations such as more storage, faster query resolution, more transparency, improved predictions, etc. This is a developing organization primary data storage action plan data repository expansion impact on business operations formats pdf template with various stages. Focus and dispense information on one stages using this creative set, that comes with editable features. It contains large content boxes to add your information on topics like resolution, processing, transparency, predictions, improved, success. You can also showcase facts, figures, and other relevant content using this PPT layout. Grab it now.

Developing Organization Primary Data Storage Action Plan Performance Analysis Of Existing Data Repository System Clipart PDF
The slide indicates the performance analysis of the organizations data repository system providing information regarding the current and desired state, identified gaps, and recommended solutions. This is a developing organization primary data storage action plan performance analysis of existing data repository system clipart pdf template with various stages. Focus and dispense information on four stages using this creative set, that comes with editable features. It contains large content boxes to add your information on topics like recommended, solutions, processing, repository, capacity, connections. You can also showcase facts, figures, and other relevant content using this PPT layout. Grab it now.
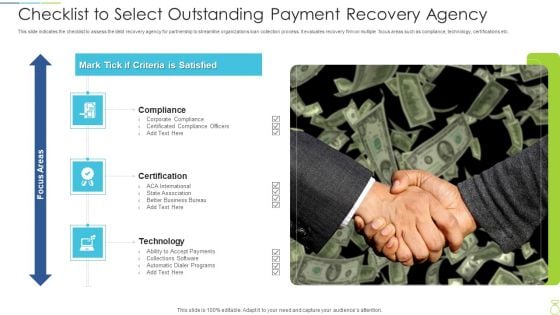
Checklist To Select Outstanding Payment Recovery Agency Template PDF
This slide indicates the checklist to assess the debt recovery agency for partnership to streamline organizations loan collection process. It evaluates recovery firm on multiple focus areas such as compliance, technology, certifications etc. Presenting checklist to select outstanding payment recovery agency template pdf to dispense important information. This template comprises three stages. It also presents valuable insights into the topics including compliance, certification, technology. This is a completely customizable PowerPoint theme that can be put to use immediately. So, download it and address the topic impactfully.
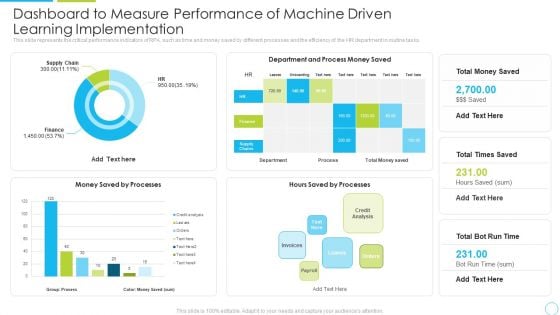
Dashboard To Measure Performance Of Machine Driven Learning Implementation Ppt Gallery Gridlines PDF
This slide represents the critical performance indicators of RPA, such as time and money saved by different processes and the efficiency of the HR department in routine tasks. Deliver an awe inspiring pitch with this creative dashboard to measure performance of machine driven learning implementation ppt gallery gridlines pdf bundle. Topics like dashboard to measure performance of machine driven learning implementation can be discussed with this completely editable template. It is available for immediate download depending on the needs and requirements of the user.
BANT Sales Lead Qualification Model Analyzing And Understanding The Performance Icons PDF
Purpose of the following slide is to show the key performance indicators of the current sales process, the provided displays KPIs such as customer acquired, CAC, volume per customer etc. Deliver and pitch your topic in the best possible manner with this BANT Sales Lead Qualification Model Analyzing And Understanding The Performance Icons PDF. Use them to share invaluable insights on New Customer, Weekly Sales, Revenues Sales and impress your audience. This template can be altered and modified as per your expectations. So, grab it now.
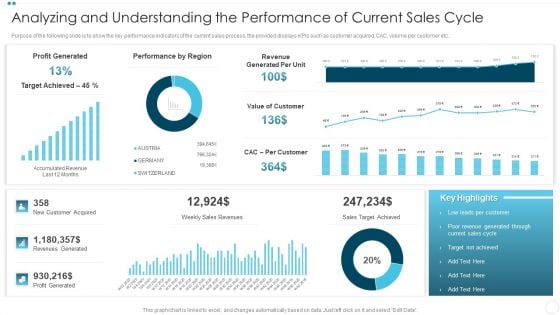
Analyzing And Understanding The Performance Of Current Sales Cycle Background PDF
Purpose of the following slide is to show the key performance indicators of the current sales process, the provided displays KPIs such as customer acquired, CAC, volume per customer etc.Deliver and pitch your topic in the best possible manner with this Analyzing And Understanding The Performance Of Current Sales Cycle Background PDF Use them to share invaluable insights on Profit Generated, Performance By Region, Customer Acquired and impress your audience. This template can be altered and modified as per your expectations. So, grab it now.
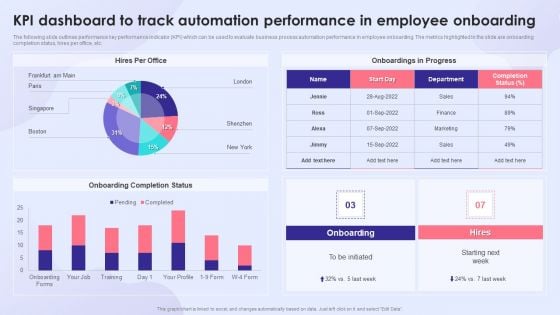
KPI Dashboard To Track Automation Performance In Employee Onboarding Introduction PDF
The following slide outlines performance key performance indicator KPI which can be used to evaluate business process automation performance in employee onboarding. The metrics highlighted in the slide are onboarding completion status, hires per office, etc. Deliver an awe inspiring pitch with this creative KPI Dashboard To Track Automation Performance In Employee Onboarding Introduction PDF bundle. Topics like Onboarding Completion Status, Onboardings In Progress, Employee Onboarding can be discussed with this completely editable template. It is available for immediate download depending on the needs and requirements of the user.
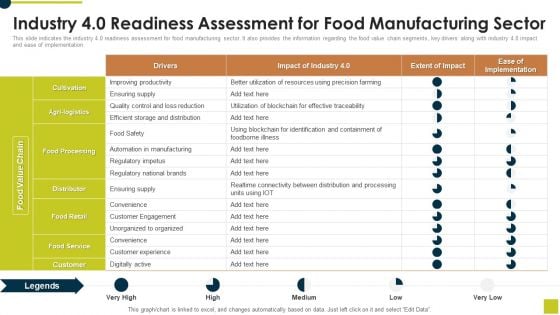
Industry 40 Readiness Assessment For Food Manufacturing Sector Information PDF
This slide indicates the industry 4.0 readiness assessment for food manufacturing sector. It also provides the information regarding the food value chain segments, key drivers along with industry 4.0 impact and ease of implementation. Deliver and pitch your topic in the best possible manner with this Industry 40 Readiness Assessment For Food Manufacturing Sector Information PDF. Use them to share invaluable insights on Improving Productivity, Ensuring Supply, Food Processing and impress your audience. This template can be altered and modified as per your expectations. So, grab it now.
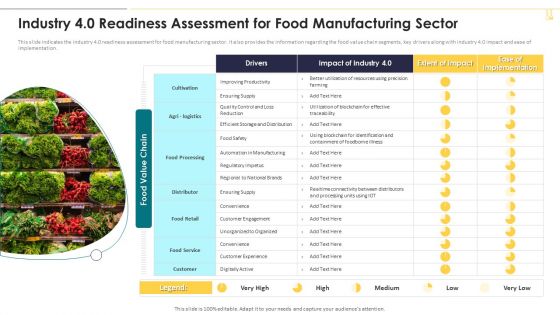
Industry 4 0 Readiness Assessment For Food Manufacturing Sector Graphics PDF
This slide indicates the industry 4.0 readiness assessment for food manufacturing sector. It also provides the information regarding the food value chain segments, key drivers along with industry 4.0 impact and ease of implementation. Deliver and pitch your topic in the best possible manner with this Industry 4 0 Readiness Assessment For Food Manufacturing Sector Graphics PDF. Use them to share invaluable insights on Food Processing, Food Retail, Food Service and impress your audience. This template can be altered and modified as per your expectations. So, grab it now.
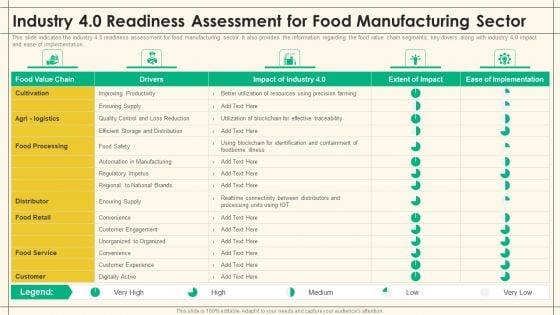
Industry 4 0 Readiness Assessment For Food Manufacturing Sector Precooked Food Industry Analysis Template PDF
This slide indicates the industry 4.0 readiness assessment for food manufacturing sector. It also provides the information regarding the food value chain segments, key drivers along with industry 4.0 impact and ease of implementation.Deliver and pitch your topic in the best possible manner with this Industry 4 0 Readiness Assessment For Food Manufacturing Sector Precooked Food Industry Analysis Template PDF. Use them to share invaluable insights on Food Processing, Efficient Storage, Customer Experience and impress your audience. This template can be altered and modified as per your expectations. So, grab it now.
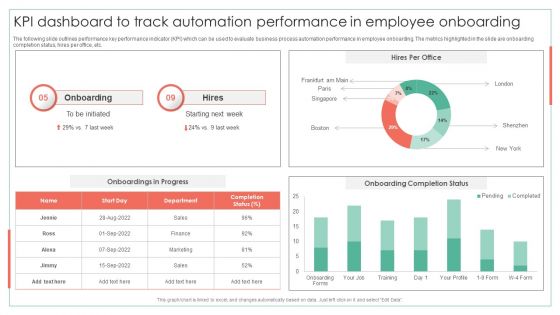
KPI Dashboard To Track Automation Performance In Employee Onboarding Achieving Operational Efficiency Download PDF
The following slide outlines performance key performance indicator KPI which can be used to evaluate business process automation performance in employee onboarding. The metrics highlighted in the slide are onboarding completion status, hires per office, etc.Deliver an awe inspiring pitch with this creative KPI Dashboard To Track Automation Performance In Employee Onboarding Achieving Operational Efficiency Download PDF bundle. Topics like Onboarding Completion, Onboarding, Onboarding Completion can be discussed with this completely editable template. It is available for immediate download depending on the needs and requirements of the user.
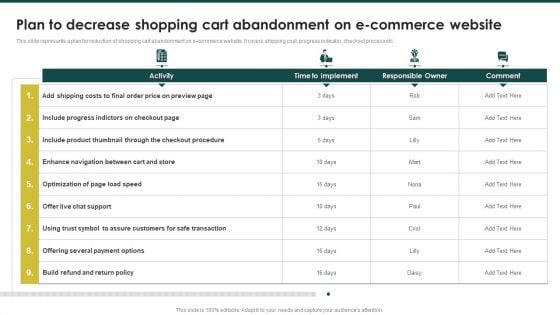
Plan To Decrease Shopping Cart Abandonment Website Ecommerce Marketing Plan To Enhance Demonstration PDF
This slide represents a plan for reduction of shopping cart abandonment on e-commerce website. It covers shipping cost, progress indicator, checkout process etc.Make sure to capture your audiences attention in your business displays with our gratis customizable Plan To Decrease Shopping Cart Abandonment Website Ecommerce Marketing Plan To Enhance Demonstration PDF. These are great for business strategies, office conferences, capital raising or task suggestions. If you desire to acquire more customers for your tech business and ensure they stay satisfied, create your own sales presentation with these plain slides.
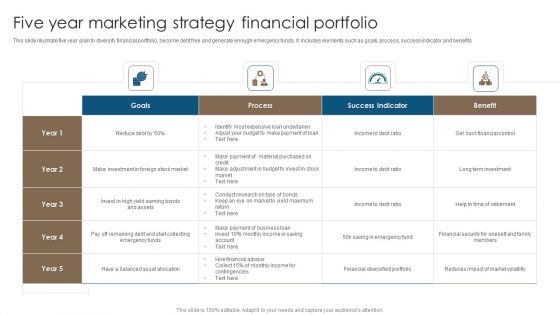
Five Year Marketing Strategy Financial Portfolio Professional PDF
This slide illustrate five year plan to diversify financial portfolio, become debt free and generate enough emergency funds. It includes elements such as goals, process, success indicator and benefits. Pitch your topic with ease and precision using this Five Year Marketing Strategy Financial Portfolio Professional PDF. This layout presents information on Reduces Impact, Market Volatility, Financial Security. It is also available for immediate download and adjustment. So, changes can be made in the color, design, graphics or any other component to create a unique layout.
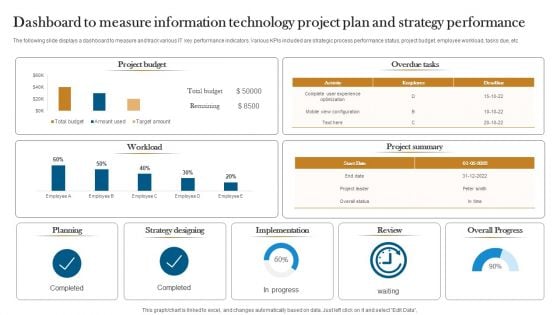
Dashboard To Measure Information Technology Project Plan And Strategy Performance Designs PDF
The following slide displays a dashboard to measure and track various IT key performance indicators. Various KPIs included are strategic process performance status, project budget, employee workload, tasks due, etc. Showcasing this set of slides titled Dashboard To Measure Information Technology Project Plan And Strategy Performance Designs PDF. The topics addressed in these templates are Strategy Designing, Implementation, Overall Progress. All the content presented in this PPT design is completely editable. Download it and make adjustments in color, background, font etc. as per your unique business setting.
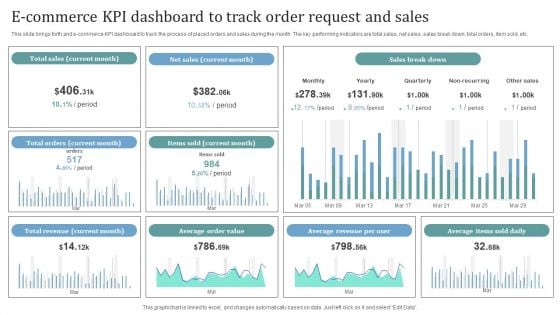
E Commerce KPI Dashboard To Track Order Request And Sales Introduction PDF
This slide brings forth and e commerce KPI dashboard to track the process of placed orders and sales during the month. The key performing indicators are total sales, net sales, sales break down, total orders, item sold, etc. Showcasing this set of slides titled E Commerce KPI Dashboard To Track Order Request And Sales Introduction PDF. The topics addressed in these templates are Total Sales, Net Sales, Sales Break Down. All the content presented in this PPT design is completely editable. Download it and make adjustments in color, background, font etc. as per your unique business setting.

KPI Analytics Dashboard With Sourcing Raw Material Cycle Time Inspiration PDF
Following slide shows the key performance indicator KPI dashboard which will assist corporates to effectively monitor procurement process. The metrics are number of suppliers, contract compliance, average procurement cycle time, etc. Showcasing this set of slides titled KPI Analytics Dashboard With Sourcing Raw Material Cycle Time Inspiration PDF. The topics addressed in these templates are Kpi Analytics Dashboard, Sourcing Raw Material, Cycle Time. All the content presented in this PPT design is completely editable. Download it and make adjustments in color, background, font etc. as per your unique business setting.
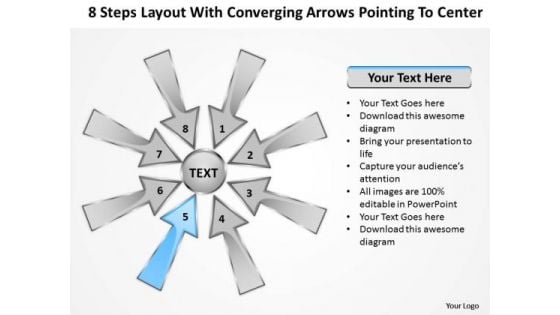
Steps Layout With Converging Arrows Pointing To Center Charts And Diagrams PowerPoint Slides
We present our steps layout with converging arrows pointing to center Charts and Diagrams PowerPoint Slides.Present our Arrows PowerPoint Templates because it focuses the light on the path to sure shot success. Download and present our Circle Charts PowerPoint Templates because you have a good idea of the roadmap to your desired destination. Download and present our Shapes PowerPoint Templates because this diagram provides trainers a tool to teach the procedure in a highly visual, engaging way. Present our Business PowerPoint Templates because it enlightens your team and colleagues on the critical factors involved. Present our Flow Charts PowerPoint Templates because it outlines the process with this innovative graphic to authenticate your plan of achieving the goal of added value/profit.Use these PowerPoint slides for presentations relating to 3d, abstract, all, around, arrow, aspect, attention, attract, blue, center, collect, colorful, conceptual, converge, course, cutout, direct, direction, factor, gather, globalization, go, green, guide, illustration, indicate, integration, isolated, location, many, movement, point, pointer, rainbow, reach, red, round, show, sides, sign, source, sphere, strategy, summon, symbol, target, unity, way, white, yellow. The prominent colors used in the PowerPoint template are Blue, Gray, Black. Presenters tell us our steps layout with converging arrows pointing to center Charts and Diagrams PowerPoint Slides are Royal. The feedback we get is that our aspect PowerPoint templates and PPT Slides are Clever. Presenters tell us our steps layout with converging arrows pointing to center Charts and Diagrams PowerPoint Slides are designed to make your presentations professional. You can be sure our attention PowerPoint templates and PPT Slides are Spectacular. People tell us our steps layout with converging arrows pointing to center Charts and Diagrams PowerPoint Slides are Ultra. PowerPoint presentation experts tell us our attract PowerPoint templates and PPT Slides are Endearing. Monitor plans with our Steps Layout With Converging Arrows Pointing To Center Charts And Diagrams PowerPoint Slides. Download without worries with our money back guaranteee.
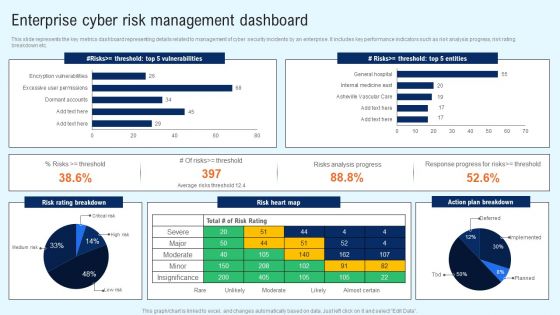
Implementing Cyber Security Incident Enterprise Cyber Risk Dashboard Professional PDF
This slide represents the key metrics dashboard representing details related to management of cyber security incidents by an enterprise. It includes key performance indicators such as risk analysis progress, risk rating breakdown etc. Do you have an important presentation coming up Are you looking for something that will make your presentation stand out from the rest Look no further than Implementing Cyber Security Incident Enterprise Cyber Risk Dashboard Professional PDF. With our professional designs, you can trust that your presentation will pop and make delivering it a smooth process. And with Slidegeeks, you can trust that your presentation will be unique and memorable. So why wait Grab Implementing Cyber Security Incident Enterprise Cyber Risk Dashboard Professional PDF today and make your presentation stand out from the rest.

Incident Response Techniques Deployement Impact Of Cybersecurity Incidents On Organization Clipart PDF
This slide represents the impact of events which indicates that organizations data has been compromised for unlawful activities. It includes impact of cyber security events such as increased costs, operational disruption, reputational damage etc. Do you have to make sure that everyone on your team knows about any specific topic I yes, then you should give Incident Response Techniques Deployement Cyber Security Incident Management Team Structure Diagrams PDF a try. Our experts have put a lot of knowledge and effort into creating this impeccable Incident Response Techniques Deployement Cyber Security Incident Management Team Structure Diagrams PDF. You can use this template for your upcoming presentations, as the slides are perfect to represent even the tiniest detail. You can download these templates from the Slidegeeks website and these are easy to edit. So grab these today.
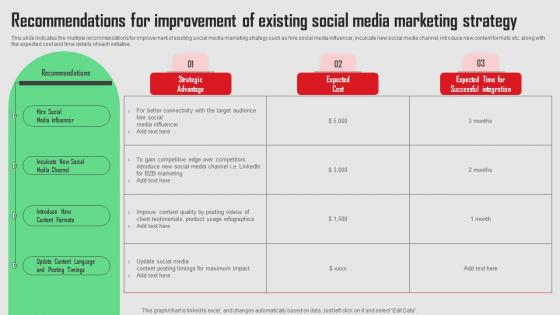
Recommendations For Improvement Of Existing Social Media Platforms Performance Template Pdf
This slide indicates the multiple recommendations for improvement of existing social media marketing strategy such as hire social media influencer, inculcate new social media channel, introduce new content formats etc. along with the expected cost and time details of each initiative.Do you have an important presentation coming up Are you looking for something that will make your presentation stand out from the rest Look no further than Recommendations For Improvement Of Existing Social Media Platforms Performance Template Pdf. With our professional designs, you can trust that your presentation will pop and make delivering it a smooth process. And with Slidegeeks, you can trust that your presentation will be unique and memorable. So why wait Grab Recommendations For Improvement Of Existing Social Media Platforms Performance Template Pdf today and make your presentation stand out from the rest. This slide indicates the multiple recommendations for improvement of existing social media marketing strategy such as hire social media influencer, inculcate new social media channel, introduce new content formats etc. along with the expected cost and time details of each initiative.
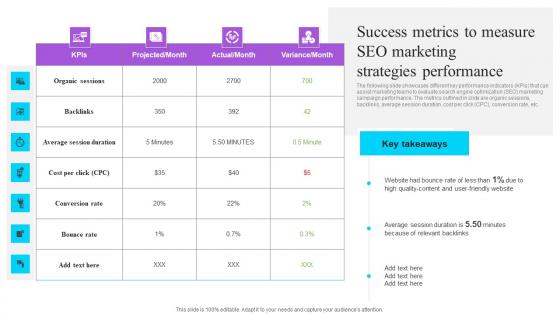
Success Metrics To Measure Seo Marketing Strategies Performance Effective GTM Techniques Brochure PDF
The following slide showcases different key performance indicators KPIs that can assist marketing teams to evaluate search engine optimization SEO marketing campaign performance. The metrics outlined in slide are organic sessions, backlinks, average session duration, cost per click CPC, conversion rate, etc. Do you have an important presentation coming up Are you looking for something that will make your presentation stand out from the rest Look no further than Success Metrics To Measure Seo Marketing Strategies Performance Effective GTM Techniques Brochure PDF. With our professional designs, you can trust that your presentation will pop and make delivering it a smooth process. And with Slidegeeks, you can trust that your presentation will be unique and memorable. So why wait Grab Success Metrics To Measure Seo Marketing Strategies Performance Effective GTM Techniques Brochure PDF today and make your presentation stand out from the rest The following slide showcases different key performance indicators KPIs that can assist marketing teams to evaluate search engine optimization SEO marketing campaign performance. The metrics outlined in slide are organic sessions, backlinks, average session duration, cost per click CPC, conversion rate, etc.
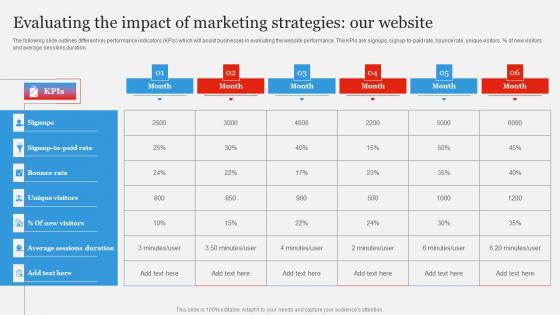
Evaluating Impact Marketing Branding Strategy To Gain Competitive Edge Brochure Pdf
The following slide outlines different key performance indicators KPIs which will assist businesses in evaluating the website performance. The KPIs are signups, signup to paid rate, bounce rate, unique visitors, percent of new visitors and average sessions duration. Do you have an important presentation coming up Are you looking for something that will make your presentation stand out from the rest Look no further than Evaluating Impact Marketing Branding Strategy To Gain Competitive Edge Brochure Pdf. With our professional designs, you can trust that your presentation will pop and make delivering it a smooth process. And with Slidegeeks, you can trust that your presentation will be unique and memorable. So why wait Grab Evaluating Impact Marketing Branding Strategy To Gain Competitive Edge Brochure Pdf today and make your presentation stand out from the rest The following slide outlines different key performance indicators KPIs which will assist businesses in evaluating the website performance. The KPIs are signups, signup to paid rate, bounce rate, unique visitors, percent of new visitors and average sessions duration.
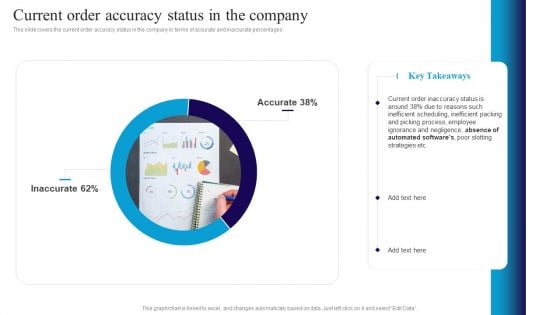
Deploying Automation In Logistics To Improve Current Order Accuracy Status In The Company Brochure PDF
This slide covers the reasons why company wants to implement automation in business as current shipping and Logistics Management System Efficiency is decreasing compared for 3 years. Some indicators are order accuracy rate, on time delivery, average cycle time , inventory accuracy, perfect order rate, overall integrated logistics efficiency etc. Present like a pro with Deploying Automation In Logistics To Improve Current Order Accuracy Status In The Company Brochure PDF. Create beautiful presentations together with your team, using our easy to use presentation slides. Share your ideas in real time and make changes on the fly by downloading our templates. So whether youre in the office, on the go, or in a remote location, you can stay in sync with your team and present your ideas with confidence. With Slidegeeks presentation got a whole lot easier. Grab these presentations today.
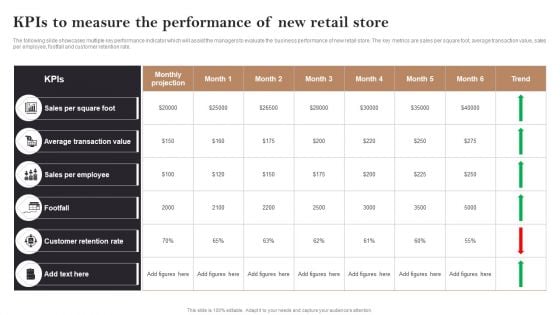
Kpis To Measure The Performance Of New Retail Store Opening Retail Store In Untapped Ideas PDF
The following slide showcases multiple key performance indicator which will assist the managers to evaluate the business performance of new retail store. The key metrics are sales per square foot, average transaction value, sales per employee, footfall and customer retention rate. Want to ace your presentation in front of a live audience Our Kpis To Measure The Performance Of New Retail Store Opening Retail Store In Untapped Ideas PDF can help you do that by engaging all the users towards you.. Slidegeeks experts have put their efforts and expertise into creating these impeccable powerpoint presentations so that you can communicate your ideas clearly. Moreover, all the templates are customizable, and easy-to-edit and downloadable. Use these for both personal and commercial use.
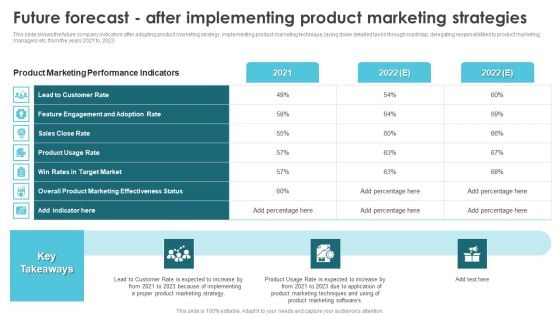
Product Marketing For Generating Future Forecast After Implementing Product Pictures PDF
This slide shows the future company indicators after adopting product marketing strategy, implementing product marketing technique, laying down detailed tasks through roadmap, delegating responsibilities to product marketing managers etc. from the years 2021 to 2023. Are you searching for a Product Marketing For Generating Future Forecast After Implementing Product Pictures PDF that is uncluttered, straightforward, and original Its easy to edit, and you can change the colors to suit your personal or business branding. For a presentation that expresses how much effort youve put in, this template is ideal With all of its features, including tables, diagrams, statistics, and lists, its perfect for a business plan presentation. Make your ideas more appealing with these professional slides. Download Product Marketing For Generating Future Forecast After Implementing Product Pictures PDF from Slidegeeks today.
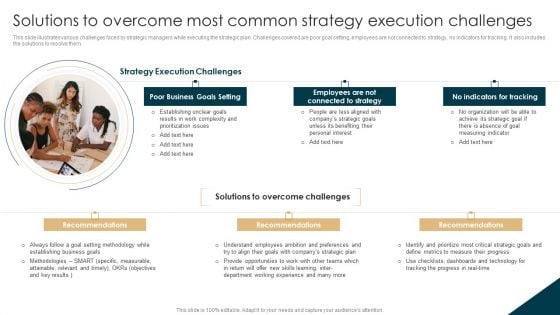
Solutions To Overcome Most Common Strategy Execution Challenges Structure PDF
This slide illustrates various challenges faced by strategic managers while executing the strategic plan. Challenges covered are poor goal setting, employees are not connected to strategy, no indicators for tracking. It also includes the solutions to resolve them. Do you have to make sure that everyone on your team knows about any specific topic I yes, then you should give Solutions To Overcome Most Common Strategy Execution Challenges Structure PDF a try. Our experts have put a lot of knowledge and effort into creating this impeccable Solutions To Overcome Most Common Strategy Execution Challenges Structure PDF. You can use this template for your upcoming presentations, as the slides are perfect to represent even the tiniest detail. You can download these templates from the Slidegeeks website and these are easy to edit. So grab these today.
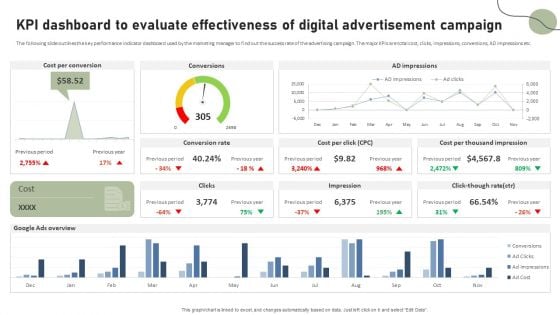
KPI Dashboard To Evaluate Effectiveness Of Digital Advertisement Campaign Pictures PDF
The following slide outlines the key performance indicator dashboard used by the marketing manager to find out the success rate of the advertising campaign. The major KPIs are total cost, clicks, impressions, conversions, AD impressions etc. Do you have to make sure that everyone on your team knows about any specific topic I yes, then you should give KPI Dashboard To Evaluate Effectiveness Of Digital Advertisement Campaign Pictures PDF a try. Our experts have put a lot of knowledge and effort into creating this impeccable KPI Dashboard To Evaluate Effectiveness Of Digital Advertisement Campaign Pictures PDF. You can use this template for your upcoming presentations, as the slides are perfect to represent even the tiniest detail. You can download these templates from the Slidegeeks website and these are easy to edit. So grab these today.
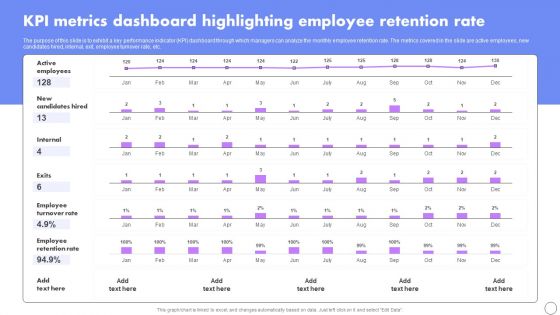
KPI Metrics Dashboard Highlighting Employee Retention Rate Developing Employee Retention Techniques Sample PDF
The purpose of this slide is to exhibit a key performance indicator KPI dashboard through which managers can analyze the monthly employee retention rate. The metrics covered in the slide are active employees, new candidates hired, internal, exit, employee turnover rate, etc.Do you have to make sure that everyone on your team knows about any specific topic I yes, then you should give KPI Metrics Dashboard Highlighting Employee Retention Rate Developing Employee Retention Techniques Sample PDF a try. Our experts have put a lot of knowledge and effort into creating this impeccable KPI Metrics Dashboard Highlighting Employee Retention Rate Developing Employee Retention Techniques Sample PDF. You can use this template for your upcoming presentations, as the slides are perfect to represent even the tiniest detail. You can download these templates from the Slidegeeks website and these are easy to edit. So grab these today.
Guidebook For Executing Business Market Intelligence Online Tracking To Optimize Website Information PDF
The following slide provides overview of performance indicators for online tracking to manage and optimize user behavior on website. It highlights metrics such as web conversions, users, top landing pages, bounce rate, conversion rate, page, sessions and goals value. Want to ace your presentation in front of a live audience Our Guidebook For Executing Business Market Intelligence Online Tracking To Optimize Website Information PDF can help you do that by engaging all the users towards you. Slidegeeks experts have put their efforts and expertise into creating these impeccable powerpoint presentations so that you can communicate your ideas clearly. Moreover, all the templates are customizable, and easy to edit and downloadable. Use these for both personal and commercial use.
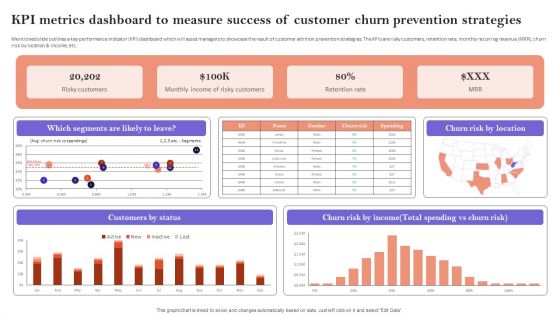
KPI Metrics Dashboard To Measure Success Of Customer Churn Prevention Strategies Diagrams PDF
Mentioned slide outlines a key performance indicator KPI dashboard which will assist managers to showcase the result of customer attrition prevention strategies. The KPIs are risky customers, retention rate, monthly recurring revenue MRR, churn risk by location and income, etc. This KPI Metrics Dashboard To Measure Success Of Customer Churn Prevention Strategies Diagrams PDF is perfect for any presentation, be it in front of clients or colleagues. It is a versatile and stylish solution for organizing your meetings. The KPI Metrics Dashboard To Measure Success Of Customer Churn Prevention Strategies Diagrams PDF features a modern design for your presentation meetings. The adjustable and customizable slides provide unlimited possibilities for acing up your presentation. Slidegeeks has done all the homework before launching the product for you. So, do not wait, grab the presentation templates today
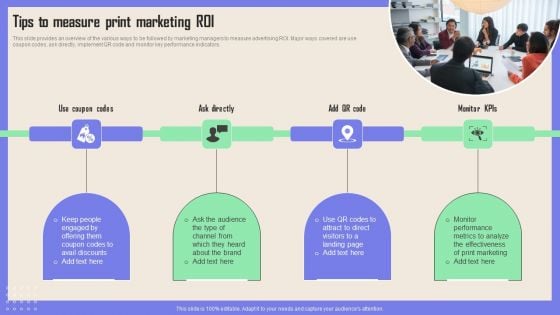
Print Advertising Tips To Measure Print Marketing ROI Information PDF
This slide provides an overview of the various ways to be followed by marketing managers to measure advertising ROI. Major ways covered are use coupon codes, ask directly, implement QR code and monitor key performance indicators. This Print Advertising Tips To Measure Print Marketing ROI Information PDF is perfect for any presentation, be it in front of clients or colleagues. It is a versatile and stylish solution for organizing your meetings. The Print Advertising Tips To Measure Print Marketing ROI Information PDF features a modern design for your presentation meetings. The adjustable and customizable slides provide unlimited possibilities for acing up your presentation. Slidegeeks has done all the homework before launching the product for you. So, do not wait, grab the presentation templates today
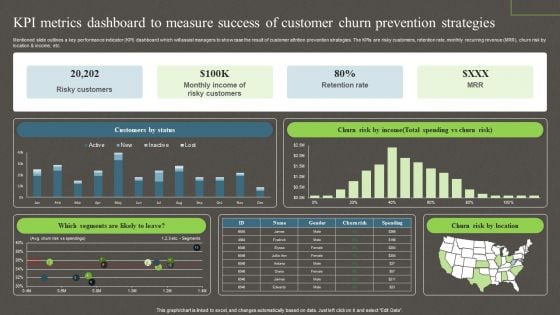
Kpi Metrics Dashboard To Measure Success Of Customer Churn Prevention Strategies Ppt PowerPoint Presentation File Model PDF
Mentioned slide outlines a key performance indicator KPI dashboard which will assist managers to showcase the result of customer attrition prevention strategies. The KPIs are risky customers, retention rate, monthly recurring revenue MRR, churn risk by location and income, etc. This Kpi Metrics Dashboard To Measure Success Of Customer Churn Prevention Strategies Ppt PowerPoint Presentation File Model PDF from Slidegeeks makes it easy to present information on your topic with precision. It provides customization options, so you can make changes to the colors, design, graphics, or any other component to create a unique layout. It is also available for immediate download, so you can begin using it right away. Slidegeeks has done good research to ensure that you have everything you need to make your presentation stand out. Make a name out there for a brilliant performance.
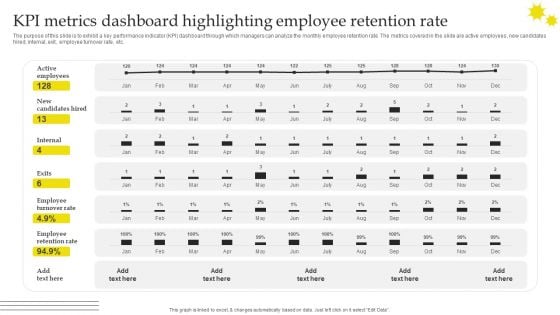
Effective Strategies For Retaining Healthcare Staff KPI Metrics Dashboard Highlighting Employee Retention Rate Summary PDF
The purpose of this slide is to exhibit a key performance indicator KPI dashboard through which managers can analyze the monthly employee retention rate. The metrics covered in the slide are active employees, new candidates hired, internal, exit, employee turnover rate, etc. Welcome to our selection of the Effective Strategies For Retaining Healthcare Staff KPI Metrics Dashboard Highlighting Employee Retention Rate Summary PDF. These are designed to help you showcase your creativity and bring your sphere to life. Planning and Innovation are essential for any business that is just starting out. This collection contains the designs that you need for your everyday presentations. All of our PowerPoints are 100 percent editable, so you can customize them to suit your needs. This multi purpose template can be used in various situations. Grab these presentation templates today.
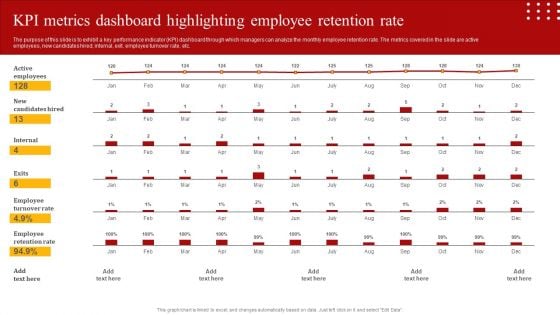
Staff Retention Techniques To Minimize Hiring Expenses KPI Metrics Dashboard Highlighting Employee Retention Template PDF
The purpose of this slide is to exhibit a key performance indicator KPI dashboard through which managers can analyze the monthly employee retention rate. The metrics covered in the slide are active employees, new candidates hired, internal, exit, employee turnover rate, etc. Do you have to make sure that everyone on your team knows about any specific topic I yes, then you should give Staff Retention Techniques To Minimize Hiring Expenses KPI Metrics Dashboard Highlighting Employee Retention Template PDF a try. Our experts have put a lot of knowledge and effort into creating this impeccable Staff Retention Techniques To Minimize Hiring Expenses KPI Metrics Dashboard Highlighting Employee Retention Template PDF. You can use this template for your upcoming presentations, as the slides are perfect to represent even the tiniest detail. You can download these templates from the Slidegeeks website and these are easy to edit. So grab these today.
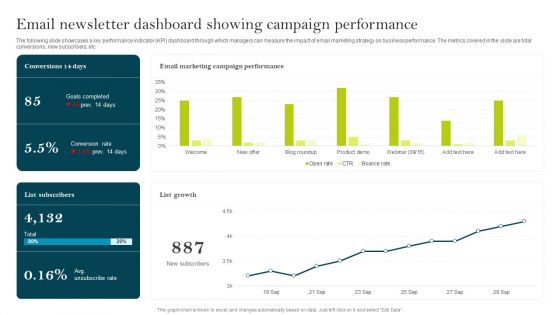
Email Newsletter Dashboard Showing Campaign Performance Ppt PowerPoint Presentation File Infographic Template PDF
The following slide showcases a key performance indicator KPI dashboard through which managers can measure the impact of email marketing strategy on business performance. The metrics covered in the slide are total conversions, new subscribers, etc. Coming up with a presentation necessitates that the majority of the effort goes into the content and the message you intend to convey. The visuals of a PowerPoint presentation can only be effective if it supplements and supports the story that is being told. Keeping this in mind our experts created Email Newsletter Dashboard Showing Campaign Performance Ppt PowerPoint Presentation File Infographic Template PDF to reduce the time that goes into designing the presentation. This way, you can concentrate on the message while our designers take care of providing you with the right template for the situation.
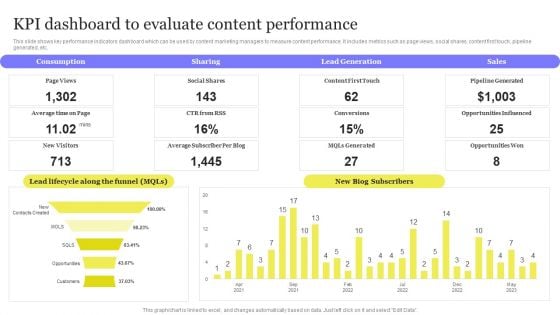
Enhancing Digital Visibility Using SEO Content Strategy KPI Dashboard To Evaluate Content Performance Diagrams PDF
This slide shows key performance indicators dashboard which can be used by content marketing managers to measure content performance. It includes metrics such as page views, social shares, content first touch, pipeline generated, etc. This modern and well arranged Enhancing Digital Visibility Using SEO Content Strategy KPI Dashboard To Evaluate Content Performance Diagrams PDF provides lots of creative possibilities. It is very simple to customize and edit with the Powerpoint Software. Just drag and drop your pictures into the shapes. All facets of this template can be edited with Powerpoint no extra software is necessary. Add your own material, put your images in the places assigned for them, adjust the colors, and then you can show your slides to the world, with an animated slide included.

Enhancing Digital Visibility Using SEO Content Strategy Kpis Measure Performance Content Development Background PDF
This slide shows various metrics which can be used by marketing manager to track performance of content development strategy. It includes various key performance indicators such as leads generated, open and click through rate, page views, etc. Welcome to our selection of the Enhancing Digital Visibility Using SEO Content Strategy Kpis Measure Performance Content Development Background PDF. These are designed to help you showcase your creativity and bring your sphere to life. Planning and Innovation are essential for any business that is just starting out. This collection contains the designs that you need for your everyday presentations. All of our PowerPoints are 100 percent editable, so you can customize them to suit your needs. This multi purpose template can be used in various situations. Grab these presentation templates today.
Strategic Market Insight Implementation Guide Online Tracking To Optimize Website Performance Background PDF
The following slide provides overview of performance indicators for online tracking to manage and optimize user behavior on website. It highlights metrics such as web conversions, users, top landing pages, bounce rate, conversion rate, page, sessions and goals value. Here you can discover an assortment of the finest PowerPoint and Google Slides templates. With these templates, you can create presentations for a variety of purposes while simultaneously providing your audience with an eye catching visual experience. Download Strategic Market Insight Implementation Guide Online Tracking To Optimize Website Performance Background PDF to deliver an impeccable presentation. These templates will make your job of preparing presentations much quicker, yet still, maintain a high level of quality. Slidegeeks has experienced researchers who prepare these templates and write high quality content for you. Later on, you can personalize the content by editing the Strategic Market Insight Implementation Guide Online Tracking To Optimize Website Performance Background PDF.
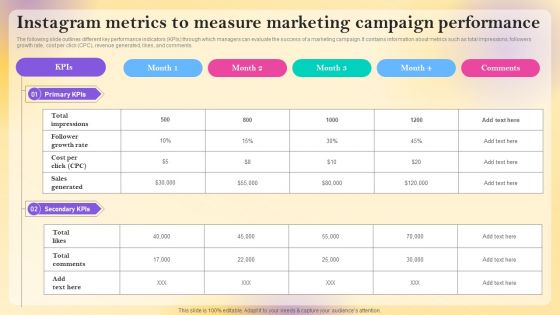
Instagram Metrics To Measure Marketing Campaign Performance Formats PDF
The following slide outlines different key performance indicators KPIs through which managers can evaluate the success of a marketing campaign. It contains information about metrics such as total impressions, followers growth rate, cost per click CPC, revenue generated, likes, and comments. Explore a selection of the finest Instagram Metrics To Measure Marketing Campaign Performance Formats PDF here. With a plethora of professionally designed and pre made slide templates, you can quickly and easily find the right one for your upcoming presentation. You can use our Instagram Metrics To Measure Marketing Campaign Performance Formats PDF to effectively convey your message to a wider audience. Slidegeeks has done a lot of research before preparing these presentation templates. The content can be personalized and the slides are highly editable. Grab templates today from Slidegeeks.
Performance Tracking KPI Dashboard For Digital Marketing Strategy Ppt Icon Slideshow PDF
Mentioned slide provides information about the key performance indicators that can be used by managers to measure the success of digital marketing strategy, KPIs covered are status, progress, priority and timeline. This Performance Tracking KPI Dashboard For Digital Marketing Strategy Ppt Icon Slideshow PDF from Slidegeeks makes it easy to present information on your topic with precision. It provides customization options, so you can make changes to the colors, design, graphics, or any other component to create a unique layout. It is also available for immediate download, so you can begin using it right away. Slidegeeks has done good research to ensure that you have everything you need to make your presentation stand out. Make a name out there for a brilliant performance.
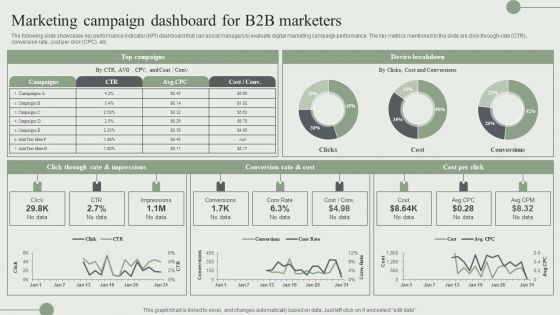
Marketing Campaign Dashboard For B2B Marketers Ppt PowerPoint Presentation File Diagrams PDF
The following slide showcases key performance indicator KPI dashboard that can assist managers to evaluate digital marketing campaign performance. The key metrics mentioned in the slide are click-through-rate CTR, conversion rate, cost per click CPC, etc. Present like a pro with Marketing Campaign Dashboard For B2B Marketers Ppt PowerPoint Presentation File Diagrams PDF Create beautiful presentations together with your team, using our easy to use presentation slides. Share your ideas in real time and make changes on the fly by downloading our templates. So whether you are in the office, on the go, or in a remote location, you can stay in sync with your team and present your ideas with confidence. With Slidegeeks presentation got a whole lot easier. Grab these presentations today.
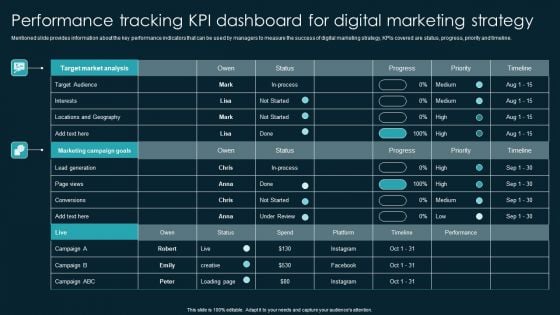
Performance Tracking KPI Dashboard For Digital Marketing Strategy Topics PDF
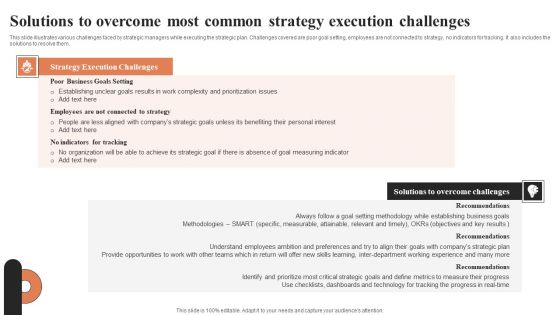
Solutions To Overcome Most Common Strategy Execution Challenges Ppt Styles Guidelines PDF
This slide illustrates various challenges faced by strategic managers while executing the strategic plan. Challenges covered are poor goal setting, employees are not connected to strategy, no indicators for tracking. It also includes the solutions to resolve them. Explore a selection of the finest Solutions To Overcome Most Common Strategy Execution Challenges Ppt Styles Guidelines PDF here. With a plethora of professionally designed and pre-made slide templates, you can quickly and easily find the right one for your upcoming presentation. You can use our Solutions To Overcome Most Common Strategy Execution Challenges Ppt Styles Guidelines PDF to effectively convey your message to a wider audience. Slidegeeks has done a lot of research before preparing these presentation templates. The content can be personalized and the slides are highly editable. Grab templates today from Slidegeeks.
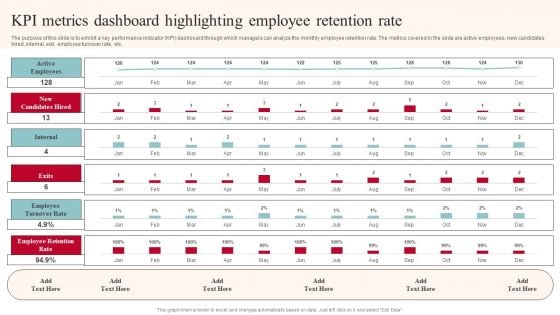
KPI Metrics Dashboard Highlighting Employee Retention Rate Structure PDF
The purpose of this slide is to exhibit a key performance indicator KPI dashboard through which managers can analyze the monthly employee retention rate. The metrics covered in the slide are active employees, new candidates hired, internal, exit, employee turnover rate, etc. Do you have to make sure that everyone on your team knows about any specific topic I yes, then you should give KPI Metrics Dashboard Highlighting Employee Retention Rate Structure PDF a try. Our experts have put a lot of knowledge and effort into creating this impeccable KPI Metrics Dashboard Highlighting Employee Retention Rate Structure PDF. You can use this template for your upcoming presentations, as the slides are perfect to represent even the tiniest detail. You can download these templates from the Slidegeeks website and these are easy to edit. So grab these today.
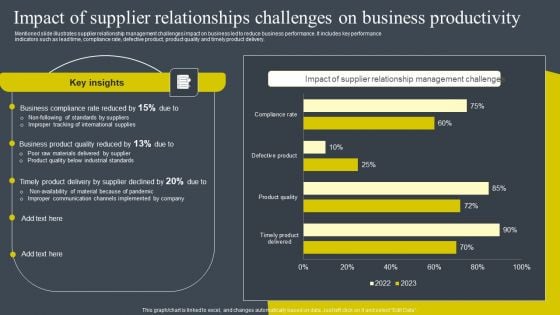
Impact Of Supplier Relationships Challenges On Business Productivity Diagrams PDF
Mentioned slide illustrates supplier relationship management challenges impact on business led to reduce business performance. It includes key performance indicators such as lead time, compliance rate, defective product, product quality and timely product delivery. The Impact Of Supplier Relationships Challenges On Business Productivity Diagrams PDF is a compilation of the most recent design trends as a series of slides. It is suitable for any subject or industry presentation, containing attractive visuals and photo spots for businesses to clearly express their messages. This template contains a variety of slides for the user to input data, such as structures to contrast two elements, bullet points, and slides for written information. Slidegeeks is prepared to create an impression.

Retail Outlet Opening To Enhance Product Sale Kpis To Measure The Performance Infographics PDF
The following slide showcases multiple key performance indicator which will assist the managers to evaluate the business performance of new retail store. The key metrics are sales per square foot, average transaction value, sales per employee, footfall and customer retention rate. Slidegeeks is here to make your presentations a breeze with Retail Outlet Opening To Enhance Product Sale Kpis To Measure The Performance Infographics PDF With our easy to use and customizable templates, you can focus on delivering your ideas rather than worrying about formatting. With a variety of designs to choose from, you are sure to find one that suits your needs. And with animations and unique photos, illustrations, and fonts, you can make your presentation pop. So whether you are giving a sales pitch or presenting to the board, make sure to check out Slidegeeks first.
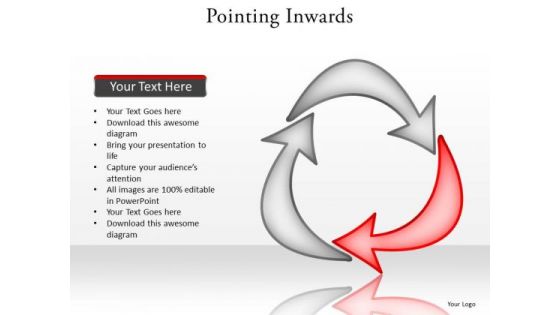
Ppt Curved PowerPoint Graphics Arrows Stage 2 Forming Triangle Templates
PPT curved powerpoint graphics arrows stage 2 forming triangle Templates-This PowerPoint Diagram shows the highlighted red arrow signifying the process is going on. It portrays the concept of bolt, cursor, dart, indicator, missile, pointer, projectile, shaft, achievement, attainment, close, conclusion, consummation, culmination, curtains, dispatch etc.-Can be used for presentations on around, arrow, business, button, chart, circle, collection, color, computer, curve, cycle, direction, down, ecology, element, environment, flowing, green, group, guidance, icon, isolated, leadership, leading, moving, pollution, processing, push, rotate, set, shape, shiny, sign, stick, symbol, triangle, turning, up, variation, waste-PPT curved powerpoint graphics arrows stage 2 forming triangle Templates Back up your boast with our Ppt Curved PowerPoint Graphics Arrows Stage 2 Forming Triangle Templates. Demonstrate to your audience that you can.
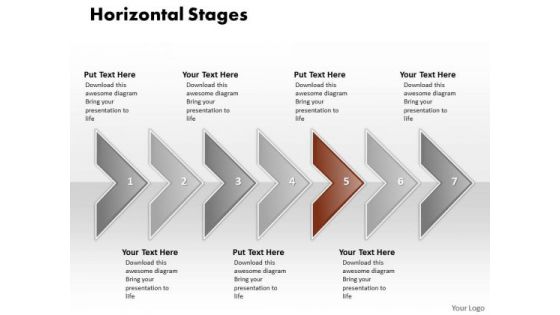
Ppt Correlated Arrows In Horizontal Create PowerPoint Macro 7 State Diagram Templates
PPT correlated arrows in horizontal create powerpoint macro 7 state diagram Templates-This Diagram is used to illustrate how information will move between interrelated systems in the accomplishment of a given function, task or process. The visual description of this information flow with each given level showing how data is fed into a given process step and subsequently passed along at the completion of that step.-PPT correlated arrows in horizontal create powerpoint macro 7 state diagram Templates-Aim, Arrow, Badge, Border, Color, Connection, Curve, Design, Direction, Download, Icon, Illustration, Indicator, Internet, Label, Link, Magenta, Mark, Next, Object, Orientation, Paper, Peeling, Pointer, Rounded, Set, Shadow, Shape, Sign Our Ppt Correlated Arrows In Horizontal Create PowerPoint Macro 7 State Diagram Templates are exceptionally adaptive. They will blend in with any scenario.
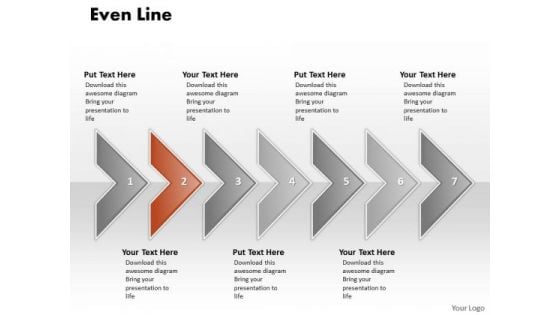
Ppt Correlated Arrows PowerPoint Templates Even Line 7 Stages
PPT correlated arrows powerpoint templates even line 7 stages-This Diagram is used to illustrate how information will move between interrelated systems in the accomplishment of a given function, task or process. The visual description of this information flow with each given level showing how data is fed into a given process step and subsequently passed along at the completion of that step.-PPT correlated arrows powerpoint templates even line 7 stages-Aim, Arrow, Badge, Border, Color, Connection, Curve, Design, Direction, Download, Icon, Illustration, Indicator, Internet, Label, Link, Magenta, Mark, Next, Object, Orientation, Paper, Peeling, Pointer, Rounded, Set, Shadow, Shape, Sign Let your ideas grow in their minds. Our Ppt Correlated Arrows PowerPoint Templates Even Line 7 Stages will act like a fertilizer.
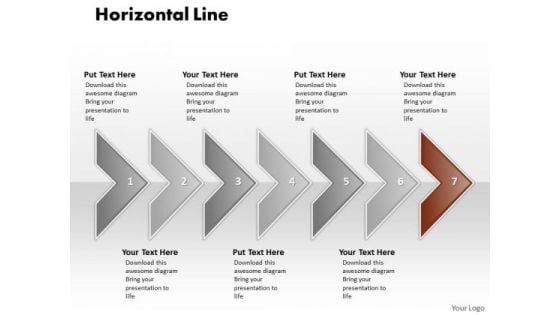
Ppt Correlated Circular Arrows PowerPoint 2010 Horizontal Line 7 Stages Templates
PPT correlated circular arrows powerpoint 2010 horizontal line 7 stages Templates-This Diagram is used to illustrate how information will move between interrelated systems in the accomplishment of a given function, task or process. The visual description of this information flow with each given level showing how data is fed into a given process step and subsequently passed along at the completion of that step.-PPT correlated circular arrows powerpoint 2010 horizontal line 7 stages Templates-Aim, Arrow, Badge, Border, Color, Connection, Curve, Design, Direction, Download, Icon, Illustration, Indicator, Internet, Label, Link, Magenta, Mark, Next, Object, Orientation, Paper, Peeling, Pointer, Rounded, Set, Shadow, Shape, Sign Pioneer changes with our Ppt Correlated Circular Arrows PowerPoint 2010 Horizontal Line 7 Stages Templates. Download without worries with our money back guaranteee.
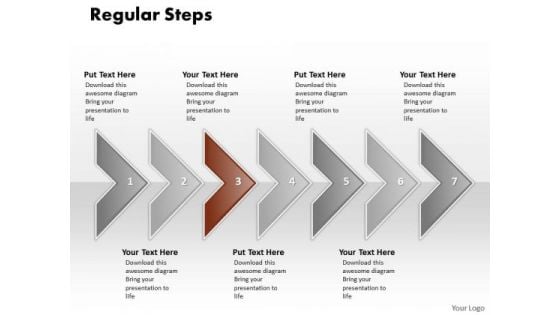
Ppt Correlated Curved Arrows PowerPoint 2010 Regular Line 7 Stages Templates
PPT correlated curved arrows powerpoint 2010 regular line 7 stages Templates-This Diagram is used to illustrate how information will move between interrelated systems in the accomplishment of a given function, task or process. The visual description of this information flow with each given level showing how data is fed into a given process step and subsequently passed along at the completion of that step.-PPT correlated curved arrows powerpoint 2010 regular line 7 stages Templates-Aim, Arrow, Badge, Border, Color, Connection, Curve, Design, Direction, Download, Icon, Illustration, Indicator, Internet, Label, Link, Magenta, Mark, Next, Object, Orientation, Paper, Peeling, Pointer, Rounded, Set, Shadow, Shape, Sign Examine every deatail with our Ppt Correlated Curved Arrows PowerPoint 2010 Regular Line 7 Stages Templates. Put each element to the test.


 Continue with Email

 Home
Home


