Scoring Chart
Levels Chart Examples In Powerpoint And Google Slides Cpb
Introducing our well designed Levels Chart Examples In Powerpoint And Google Slides Cpb This PowerPoint design presents information on topics like Levels Chart Examples As it is predesigned it helps boost your confidence level. It also makes you a better presenter because of its high quality content and graphics. This PPT layout can be downloaded and used in different formats like PDF, PNG, and JPG. Not only this, it is available in both Standard Screen and Widescreen aspect ratios for your convenience. Therefore, click on the download button now to persuade and impress your audience. Our Levels Chart Examples In Powerpoint And Google Slides Cpb are topically designed to provide an attractive backdrop to any subject. Use them to look like a presentation pro.
Function Flow Chart In Powerpoint And Google Slides Cpb
Introducing our well designed Function Flow Chart In Powerpoint And Google Slides Cpb. This PowerPoint design presents information on topics like Function Flow Chart. As it is predesigned it helps boost your confidence level. It also makes you a better presenter because of its high quality content and graphics. This PPT layout can be downloaded and used in different formats like PDF, PNG, and JPG. Not only this, it is available in both Standard Screen and Widescreen aspect ratios for your convenience. Therefore, click on the download button now to persuade and impress your audience. Our Function Flow Chart In Powerpoint And Google Slides Cpb are topically designed to provide an attractive backdrop to any subject. Use them to look like a presentation pro.
Pregnancy Heart Rate Chart In Powerpoint And Google Slides Cpb
Introducing our well designed Pregnancy Heart Rate Chart In Powerpoint And Google Slides Cpb. This PowerPoint design presents information on topics like Pregnancy Heart Rate Chart. As it is predesigned it helps boost your confidence level. It also makes you a better presenter because of its high quality content and graphics. This PPT layout can be downloaded and used in different formats like PDF, PNG, and JPG. Not only this, it is available in both Standard Screen and Widescreen aspect ratios for your convenience. Therefore, click on the download button now to persuade and impress your audience. Our Pregnancy Heart Rate Chart In Powerpoint And Google Slides Cpb are topically designed to provide an attractive backdrop to any subject. Use them to look like a presentation pro.
Triptans Comparison Chart In Powerpoint And Google Slides Cpb
Presenting our innovatively designed set of slides titled Triptans Comparison Chart In Powerpoint And Google Slides Cpb This completely editable PowerPoint graphic exhibits Triptans Comparison Chart that will help you convey the message impactfully. It can be accessed with Google Slides and is available in both standard screen and widescreen aspect ratios. Apart from this, you can download this well structured PowerPoint template design in different formats like PDF, JPG, and PNG. So, click the download button now to gain full access to this PPT design. Our Triptans Comparison Chart In Powerpoint And Google Slides Cpb are topically designed to provide an attractive backdrop to any subject. Use them to look like a presentation pro.
Foods Chart In Powerpoint And Google Slides Cpb
Introducing our well designed Foods Chart In Powerpoint And Google Slides Cpb. This PowerPoint design presents information on topics like Foods Chart. As it is predesigned it helps boost your confidence level. It also makes you a better presenter because of its high-quality content and graphics. This PPT layout can be downloaded and used in different formats like PDF, PNG, and JPG. Not only this, it is available in both Standard Screen and Widescreen aspect ratios for your convenience. Therefore, click on the download button now to persuade and impress your audience. Our Foods Chart In Powerpoint And Google Slides Cpb are topically designed to provide an attractive backdrop to any subject. Use them to look like a presentation pro.
Sound Quality Chart In Powerpoint And Google Slides Cpb
Presenting our innovatively designed set of slides titled Sound Quality Chart In Powerpoint And Google Slides Cpb. This completely editable PowerPoint graphic exhibits Sound Quality Chart that will help you convey the message impactfully. It can be accessed with Google Slides and is available in both standard screen and widescreen aspect ratios. Apart from this, you can download this well structured PowerPoint template design in different formats like PDF, JPG, and PNG. So, click the download button now to gain full access to this PPT design. Our Sound Quality Chart In Powerpoint And Google Slides Cpb are topically designed to provide an attractive backdrop to any subject. Use them to look like a presentation pro.
Gantt Chart Multiple Projects In Powerpoint And Google Slides Cpb
Introducing our well designed Gantt Chart Multiple Projects In Powerpoint And Google Slides Cpb. This PowerPoint design presents information on topics like Gantt Chart Multiple Projects. As it is predesigned it helps boost your confidence level. It also makes you a better presenter because of its high quality content and graphics. This PPT layout can be downloaded and used in different formats like PDF, PNG, and JPG. Not only this, it is available in both Standard Screen and Widescreen aspect ratios for your convenience. Therefore, click on the download button now to persuade and impress your audience. Our Gantt Chart Multiple Projects In Powerpoint And Google Slides Cpb are topically designed to provide an attractive backdrop to any subject. Use them to look like a presentation pro.
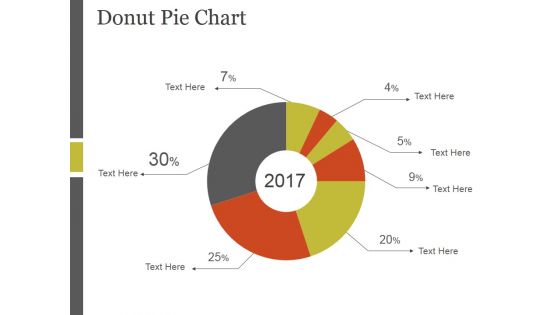
Donut Pie Chart Ppt PowerPoint Presentation Slide Download
This is a donut pie chart ppt powerpoint presentation slide download. This is a seven stage process. The stages in this process are donut, process, marketing, business, management, strategy.
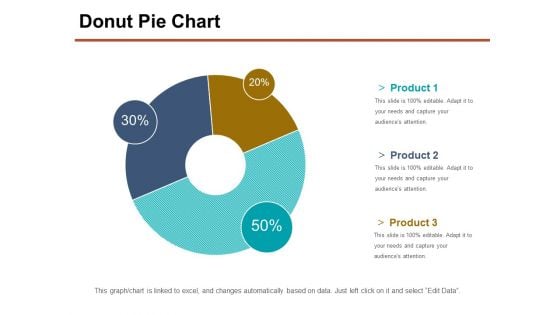
Donut Pie Chart Ppt PowerPoint Presentation Professional Slide Portrait
This is a donut pie chart ppt powerpoint presentation professional slide portrait. This is a three stage process. The stages in this process are product, percentage, business, management, process.
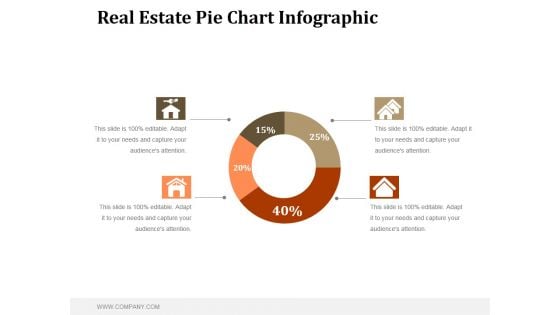
Real Estate Pie Chart Infographic Ppt PowerPoint Presentation Shapes
This is a real estate pie chart infographic ppt powerpoint presentation shapes. This is a four stage process. The stages in this process are business, marketing, management, finance, planning.

Transformation Chart Ppt PowerPoint Presentation Complete Deck With Slides
This is a transformation chart ppt powerpoint presentation complete deck with slides. This is a one stage process. The stages in this process are business, planning, strategy, marketing, management.
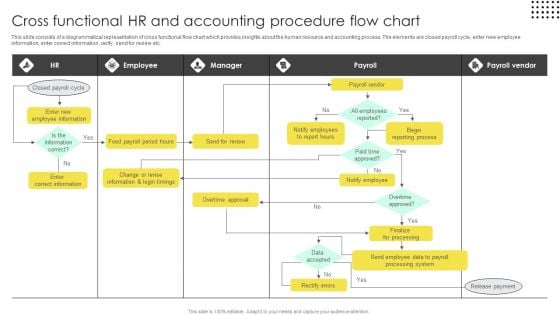
Cross Functional Hr And Accounting Procedure Flow Chart Sample PDF
This slide consists of a diagrammatical representation of cross functional flow chart which provides insights about the human resource and accounting process. The elements are closed payroll cycle, enter new employee information, enter correct information, verify, send for review etc. Showcasing this set of slides titled Cross Functional Hr And Accounting Procedure Flow Chart Sample PDF. The topics addressed in these templates are Correct Information, Employee Information, Overtime Approval. All the content presented in this PPT design is completely editable. Download it and make adjustments in color, background, font etc. as per your unique business setting.
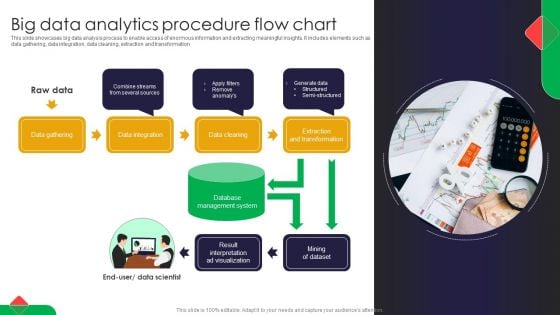
Big Data Analytics Procedure Flow Chart Portrait PDF
This slide showcases big data analysis process to enable access of enormous information and extracting meaningful insights. It includes elements such as data gathering, data integration, data cleaning, extraction and transformation Pitch your topic with ease and precision using this Big Data Analytics Procedure Flow Chart Portrait PDF. This layout presents information on Raw Data, Flow Chart, Big Data. It is also available for immediate download and adjustment. So, changes can be made in the color, design, graphics or any other component to create a unique layout.
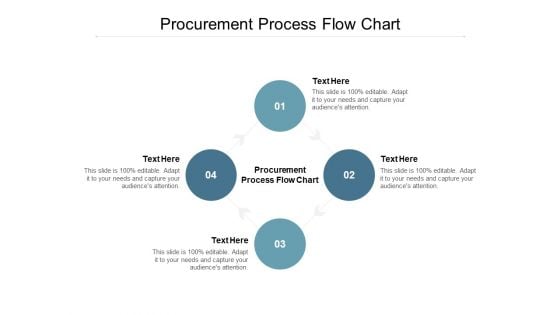
Procurement Process Flow Chart Ppt PowerPoint Presentation Pictures Designs Download
Presenting this set of slides with name procurement process flow chart ppt powerpoint presentation pictures designs download. This is an editable Powerpoint four stages graphic that deals with topics like procurement process flow chart to help convey your message better graphically. This product is a premium product available for immediate download and is 100 percent editable in Powerpoint. Download this now and use it in your presentations to impress your audience.
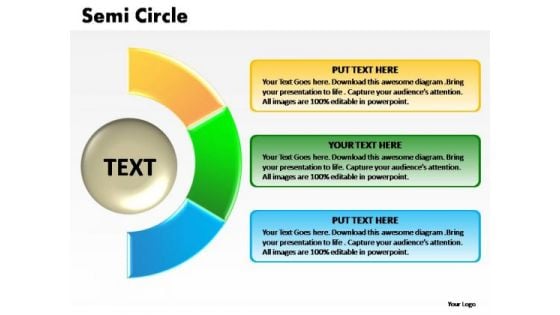
PowerPoint Process Image Semi Circle Chart Ppt Template
PowerPoint Process Image Semi Circle Chart PPT Template-The Circle of Life - a concept emmbedded in our minds and hence easy to comprehend. Life and Business is made up of processes comprising stages that flow from one to another. An excellent graphic to attract the attention of and understanding by your audience to improve earnings. Our PowerPoint Process Image Semi Circle Chart Ppt Template are like a dictionary. They will have the right words for you.
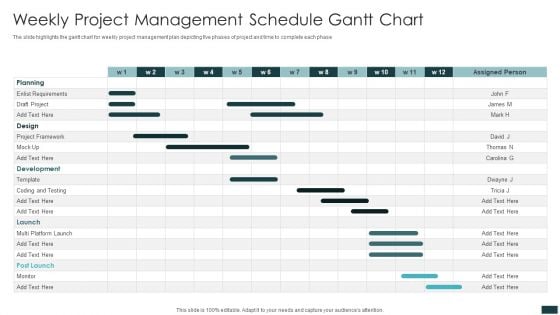
Weekly Project Management Schedule Gantt Chart Information PDF
The slide highlights the gantt chart for weekly project management plan depicting five phases of project and time to complete each phase. Pitch your topic with ease and precision using this Weekly Project Management Schedule Gantt Chart Information PDF. This layout presents information on Project Framework, Design, Planning. It is also available for immediate download and adjustment. So, changes can be made in the color, design, graphics or any other component to create a unique layout.
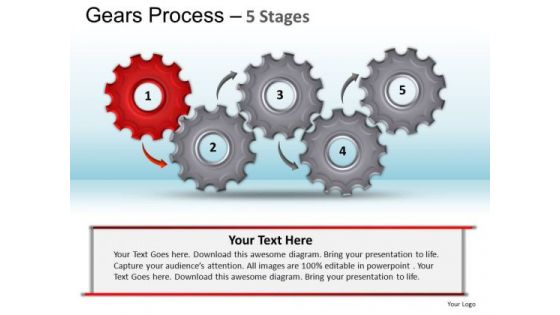
PowerPoint Design Slides Chart Gears Process Ppt Template
PowerPoint Design Slides Chart Gears Process PPT Template-The Circle of Life - a concept emmbedded in our minds and hence easy to comprehend. Life and Business is made up of processes comprising stages that flow from one to another. An excellent graphic to attract the attention of and understanding by your audience to improve earnings. Give your thoughts an extravagant display. Our PowerPoint Design Slides Chart Gears Process Ppt Template will add on extra dimensions.
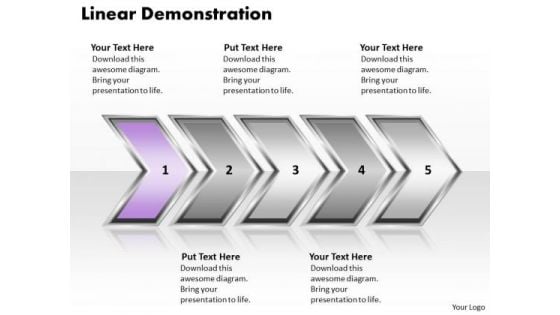
Ppt Linear Demonstration Of Arrows PowerPoint 2010 Org Chart Templates
PPT linear demonstration of arrows powerpoint 2010 org chart Templates-Life and Business is made up of processes comprising stages that flow from one to another. An excellent graphic to attract the attention of and understanding by your audience to improve earnings.-PPT linear demonstration of arrows powerpoint 2010 org chart Templates-Aim, Arrow, Arrowheads, Badge, Border, Click, Connection, Curve, Design, Direction, Download, Element, Fuchsia, Icon, Illustration, Indicator, Internet, Magenta, Mark, Object, Orientation, Pointer, Shadow, Shape, Sign Encourage creativity with our Ppt Linear Demonstration Of Arrows PowerPoint 2010 Org Chart Templates. You will come out on top.
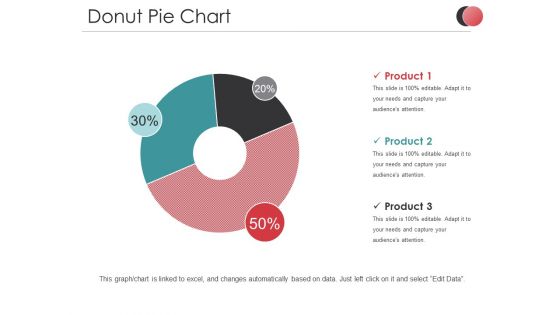
Donut Pie Chart Ppt PowerPoint Presentation Inspiration Background Image
This is a donut pie chart ppt powerpoint presentation inspiration background image. This is a three stage process. The stages in this process are product, percentage, business, marketing, process.
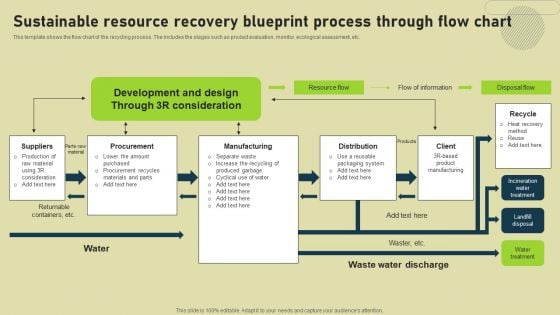
Sustainable Resource Recovery Blueprint Process Through Flow Chart Inspiration PDF
This template shows the flow chart of the recycling process. The includes the stages such as product evaluation, monitor, ecological assessment, etc. Pitch your topic with ease and precision using this Sustainable Resource Recovery Blueprint Process Through Flow Chart Inspiration PDF. This layout presents information on Procurement, Manufacturing, Suppliers. It is also available for immediate download and adjustment. So, changes can be made in the color, design, graphics or any other component to create a unique layout.
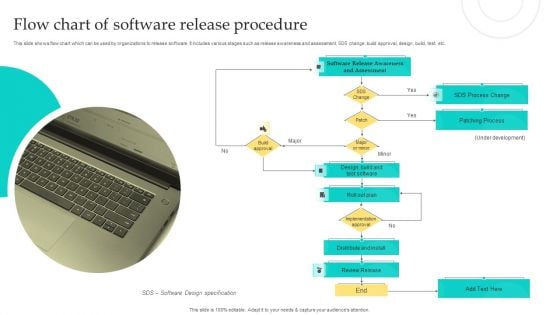
Flow Chart Of Software Release Procedure Professional PDF
This slide shows flow chart which can be used by organizations to release software. It includes various stages such as release awareness and assessment, SDS change, build approval, design, build, test, etc. Persuade your audience using this Flow Chart Of Software Release Procedure Professional PDF. This PPT design covers one stages, thus making it a great tool to use. It also caters to a variety of topics including Design, Patching Process, Development. Download this PPT design now to present a convincing pitch that not only emphasizes the topic but also showcases your presentation skills.
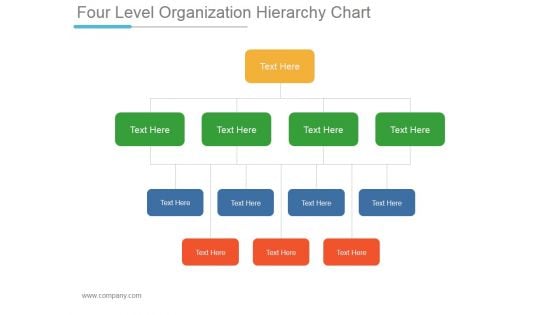
Four Level Organization Hierarchy Chart Ppt PowerPoint Presentation Clipart
This is a four level organization hierarchy chart ppt powerpoint presentation clipart. This is a four stage process. The stages in this process are business, strategy, marketing, management, text.
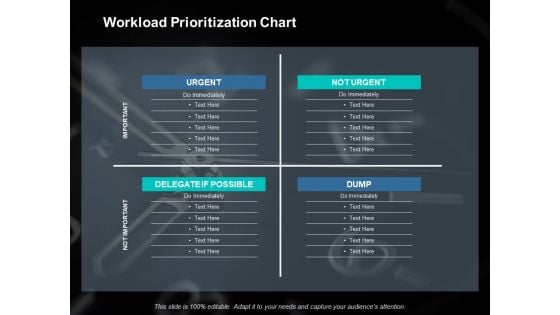
Workload Prioritization Chart Ppt PowerPoint Presentation Gallery Example File
This is a workload prioritization chart ppt powerpoint presentation gallery example file. This is a four stage process. The stages in this process are business, planning, strategy, marketing, management.
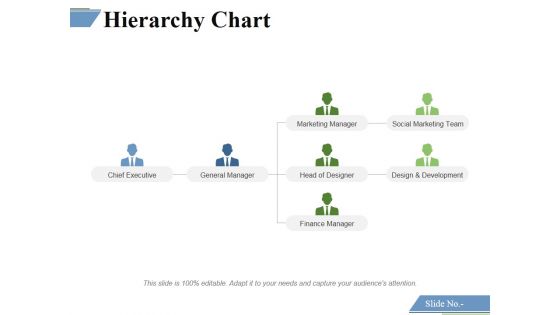
Hierarchy Chart Ppt PowerPoint Presentation Infographic Template Themes
This is a hierarchy chart ppt powerpoint presentation infographic template themes. This is a four stage process. The stages in this process are chief executive, general manager, marketing manager, head of designer, finance manager, design and development, social marketing team.
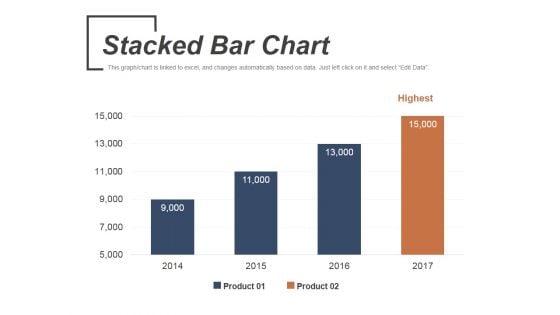
Stacked Bar Chart Ppt PowerPoint Presentation Inspiration Ideas
This is a stacked bar chart ppt powerpoint presentation inspiration ideas. This is a four stage process. The stages in this process are product, highest, business, marketing, bar graph.
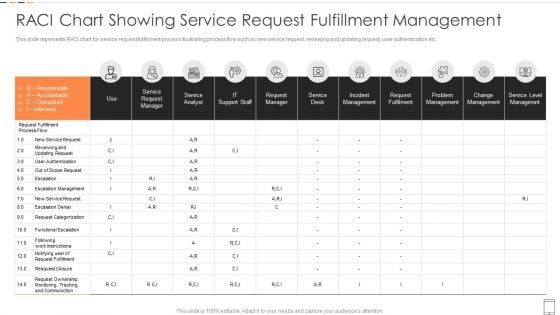
RACI Chart Showing Service Request Fulfillment Management Introduction PDF
This slide represents RACI chart for service request fulfillment process illustrating process flow such as new service request, reviewing and updating request, user authentication etc.Pitch your topic with ease and precision using this RACI Chart Showing Service Request Fulfillment Management Introduction PDF This layout presents information on Incident Management, Request Fulfilment, Problem Management It is also available for immediate download and adjustment. So, changes can be made in the color, design, graphics or any other component to create a unique layout.
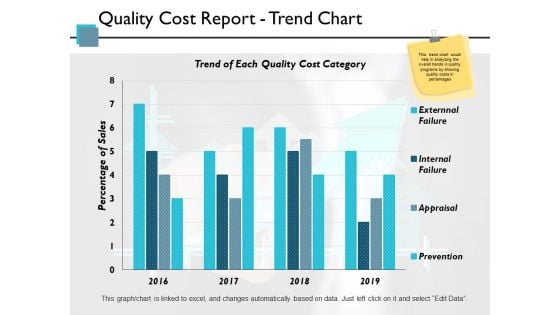
Quality Cost Report Trend Chart Ppt PowerPoint Presentation Pictures Themes
This is a quality cost report trend chart ppt powerpoint presentation pictures themes. This is a four stage process. The stages in this process are finance, strategy, marketing, management, business.
Sequential Chart With Financial Management Icons Powerpoint Template
This PowerPoint template has been designed with sequential chart with icons. This business slide may be used to display financial management steps. Present your views and ideas with this impressive design.

Donut Pie Chart Product Finance Ppt PowerPoint Presentation Diagram Ppt
This is a donut pie chart product finance ppt powerpoint presentation diagram ppt. This is a three stage process. The stages in this process are finance, management, strategy, analysis, marketing.
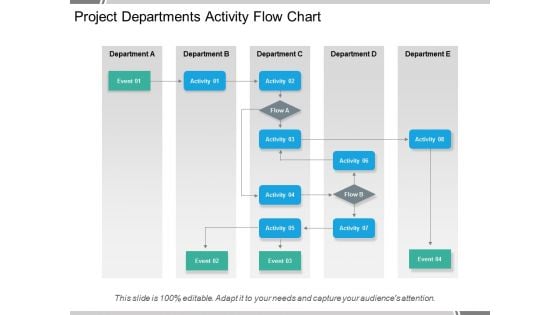
Project Departments Activity Flow Chart Ppt PowerPoint Presentation Pictures Show
This is a project departments activity flow chart ppt powerpoint presentation pictures show. This is a five stage process. The stages in this process are operational excellence, operational plan, operational process.
Clustered Bar Chart Finance Ppt PowerPoint Presentation Icon Tips
This is a clustered bar chart finance ppt powerpoint presentation icon tips. This is a two stage process. The stages in this process are analysis, finance, marketing, management, investment.
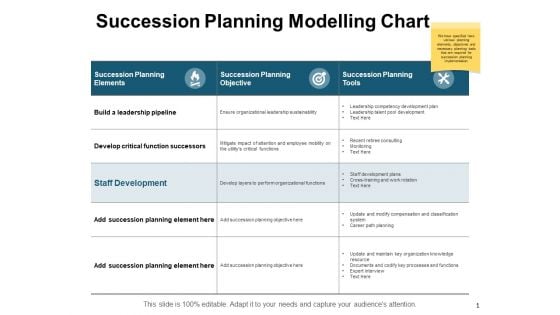
Succession Planning Modelling Chart Ppt PowerPoint Presentation Professional Outline
This is a succession planning modelling chart ppt powerpoint presentation professional outline. The topics discussed in this diagram are marketing, business, management, planning, strategy This is a completely editable PowerPoint presentation, and is available for immediate download.
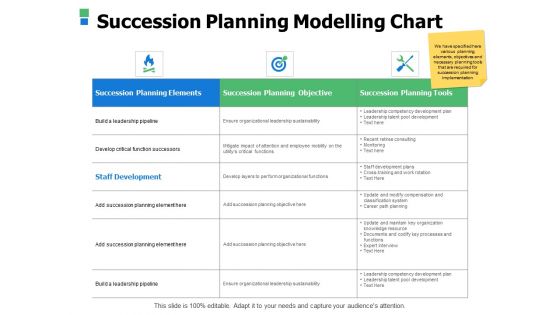
Succession Planning Modelling Chart Ppt Powerpoint Presentation Slides Samples
This is a succession planning modelling chart ppt powerpoint presentation slides samples. The topics discussed in this diagram are business, management, planning, strategy, marketing. This is a completely editable PowerPoint presentation, and is available for immediate download.
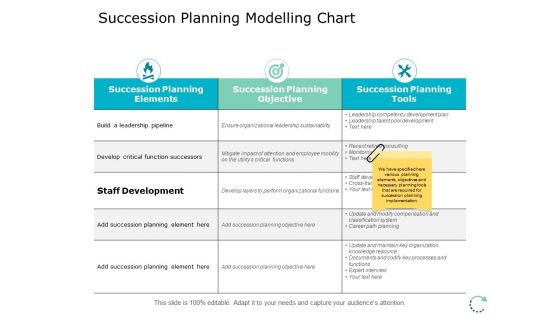
Succession Planning Modelling Chart Ppt PowerPoint Presentation Inspiration Slideshow
This is a succession planning modelling chart ppt powerpoint presentation inspiration slideshow. The topics discussed in this diagram are marketing, business, management, planning, strategy This is a completely editable PowerPoint presentation and is available for immediate download.
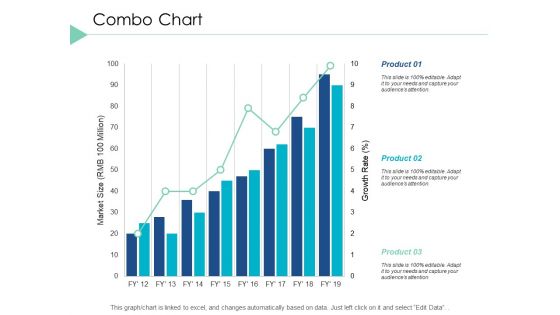
Combo Chart Graph Ppt PowerPoint Presentation Infographic Template Layout Ideas
This is a combo chart graph ppt powerpoint presentation infographic template layout ideas. This is a three stage process. The stages in this process are finance, marketing, analysis, investment, million.
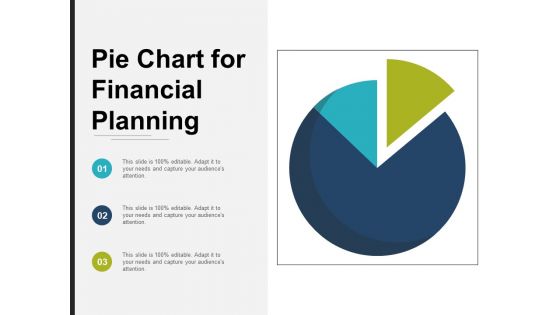
Pie Chart For Financial Planning Ppt PowerPoint Presentation Professional Aids
This is a pie chart for financial planning ppt powerpoint presentation professional aids. This is a three stage process. The stages in this process are sectioned circle, segmented circle, partitioned circle.
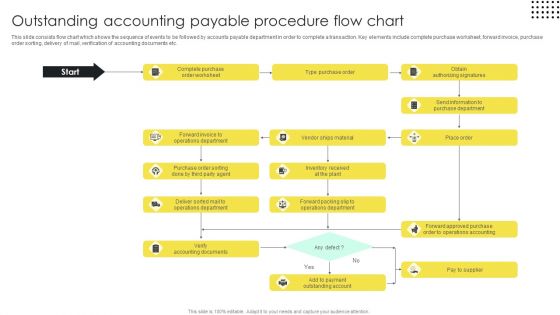
Outstanding Accounting Payable Procedure Flow Chart Introduction PDF
This slide consists flow chart which shows the sequence of events to be followed by accounts payable department in order to complete a transaction. Key elements include complete purchase worksheet, forward invoice, purchase order sorting, delivery of mail, verification of accounting documents etc. Showcasing this set of slides titled Outstanding Accounting Payable Procedure Flow Chart Introduction PDF. The topics addressed in these templates are Purchase Department, Place Order, Accounting. All the content presented in this PPT design is completely editable. Download it and make adjustments in color, background, font etc. as per your unique business setting.
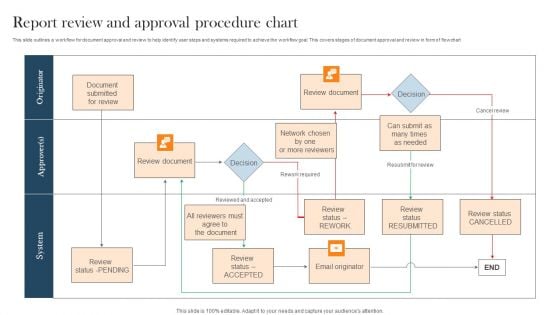
Report Review And Approval Procedure Chart Pictures PDF
This slide outlines a workflow for document approval and review to help identify user steps and systems required to achieve the workflow goal. This covers stages of document approval and review in form of flowchart Showcasing this set of slides titled Report Review And Approval Procedure Chart Pictures PDF. The topics addressed in these templates are Review Document, Chart, Decision. All the content presented in this PPT design is completely editable. Download it and make adjustments in color, background, font etc. as per your unique business setting.
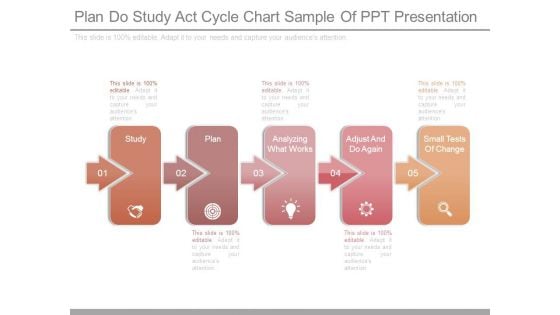
Plan Do Study Act Cycle Chart Sample Of Ppt Presentation
This is a plan do study act cycle chart sample of ppt presentation. This is a five stage process. The stages in this process are study, plan, analyzing what works, adjust and do again, small tests of change.
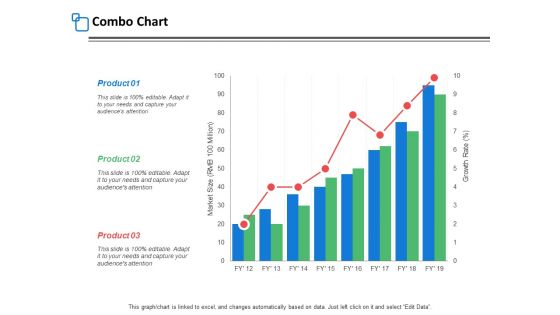
Combo Chart Finance Ppt PowerPoint Presentation Styles Background Image
This is a combo chart finance ppt powerpoint presentation styles background image. The topics discussed in this diagram are marketing, business, management, planning, strategy This is a completely editable PowerPoint presentation, and is available for immediate download
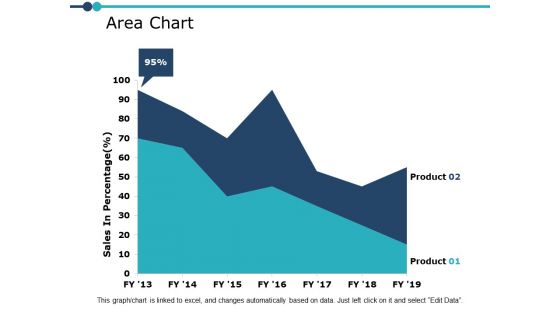
Area Chart Finance Ppt PowerPoint Presentation File Slide
This is a area chart finance ppt powerpoint presentation file slide. The topics discussed in this diagram are marketing, business, management, planning, strategy This is a completely editable PowerPoint presentation, and is available for immediate download.
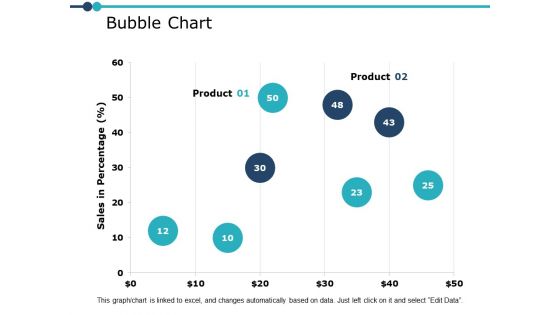
Bubble Chart Graph Ppt PowerPoint Presentation Ideas Outfit
This is a bubble chart graph ppt powerpoint presentation ideas outfit. The topics discussed in this diagram are marketing, business, management, planning, strategy This is a completely editable PowerPoint presentation, and is available for immediate download.
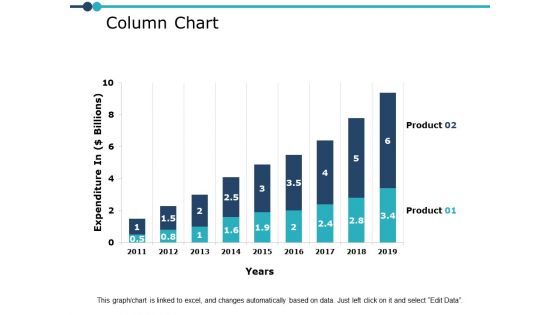
Column Chart Finance Ppt PowerPoint Presentation Show Background
This is a column chart finance ppt powerpoint presentation show background. The topics discussed in this diagram are marketing, business, management, planning, strategy This is a completely editable PowerPoint presentation, and is available for immediate download.
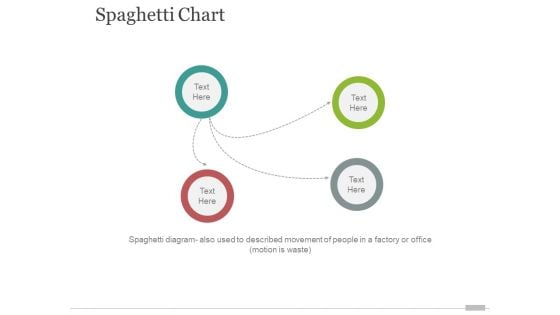
spaghetti chart template 1 ppt powerpoint presentation styles design inspiration
This is a spaghetti chart template 1 ppt powerpoint presentation styles design inspiration. This is a three stage process. The stages in this process are business, marketing, circle, management.
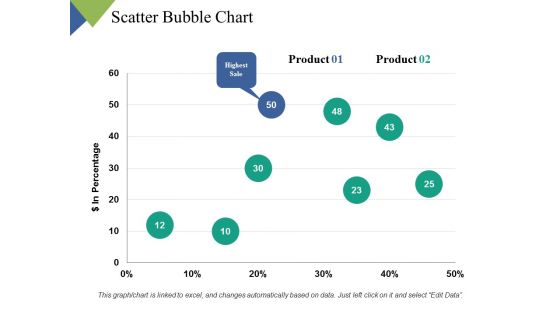
Scatter Bubble Chart Ppt PowerPoint Presentation Inspiration Graphics Tutorials
This is a scatter bubble chart ppt powerpoint presentation inspiration graphics tutorials. This is a two stage process. The stages in this process are finance, marketing, management, investment, analysis.
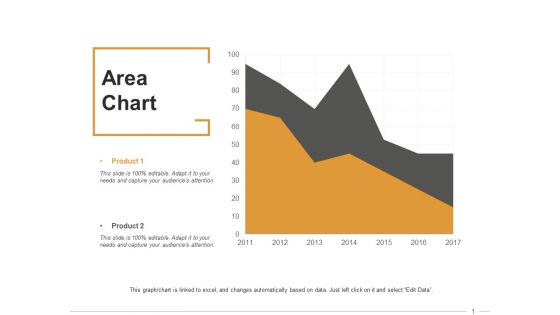
Area Chart Ppt PowerPoint Presentation Infographic Template Clipart Images
This is a area chart ppt powerpoint presentation infographic template clipart images. This is a two stage process. The stages in this process are finance, marketing, management, investment, analysis.
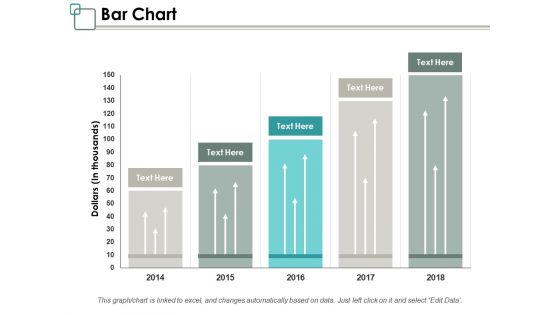
Bar Chart Ppt PowerPoint Presentation Infographic Template Graphics Design
This is a bar chart ppt powerpoint presentation infographic template graphics design. This is a five stage process. The stages in this process are management, marketing, business, percentage, product.
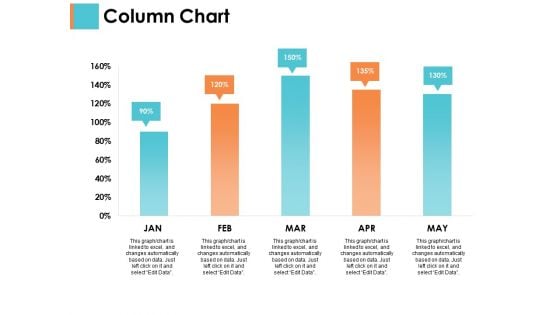
Column Chart Sample Budget Ppt Ppt PowerPoint Presentation Infographics Brochure
This is a column chart sample budget ppt ppt powerpoint presentation infographics brochure. This is a two stage process. The stages in this process are business, management, strategy, analysis, marketing.
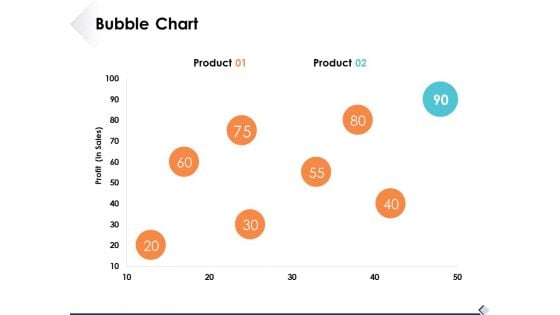
Bubble Chart Marketing Business Ppt PowerPoint Presentation Model Sample
This is a bubble chart marketing business ppt powerpoint presentation model sample. This is a two stage process. The stages in this process are finance, business, management, strategy, analysis.

Donut Pie Chart Finance Ppt PowerPoint Presentation Portfolio Model
This is a donut pie chart finance ppt powerpoint presentation portfolio model. This is a three stage process. The stages in this process are finance, management, strategy, analysis, marketing.
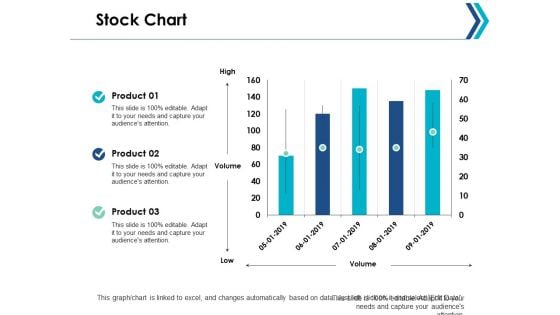
Stock Chart Finance Analysis Ppt Powerpoint Presentation Ideas Portrait
This is a stock chart finance analysis ppt powerpoint presentation ideas portrait. This is a three stage process. The stages in this process are finance, marketing, management, investment, strategy.
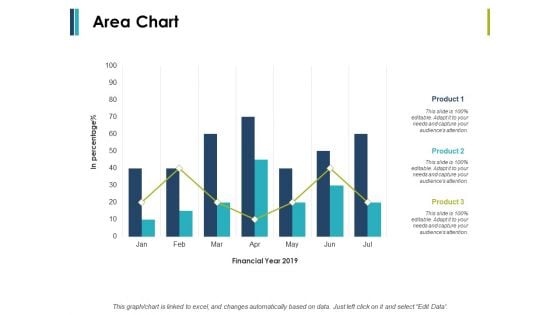
Area Chart Finance Ppt PowerPoint Presentation Infographic Template Model
This is a area chart finance ppt powerpoint presentation infographic template model. This is a two stage process. The stages in this process are finance, marketing, management, investment, analysis.
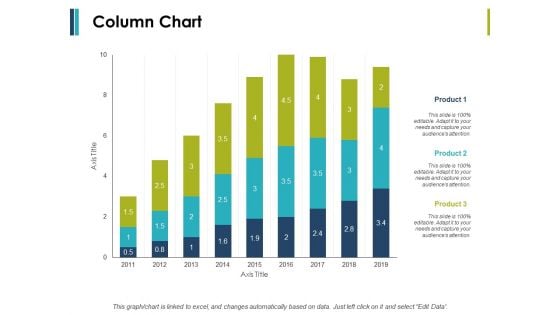
Column Chart And Graph Ppt PowerPoint Presentation File Introduction
This is a column chart and graph ppt powerpoint presentation file introduction. This is a three stage process. The stages in this process are finance, marketing, management, investment, analysis.

Working Capital Modelling Chart Ppt PowerPoint Presentation Slides Deck
Presenting this set of slides with name working capital modelling chart ppt powerpoint presentation slides deck. The topics discussed in these slides are business, management, planning, strategy, marketing. This is a completely editable PowerPoint presentation and is available for immediate download. Download now and impress your audience.
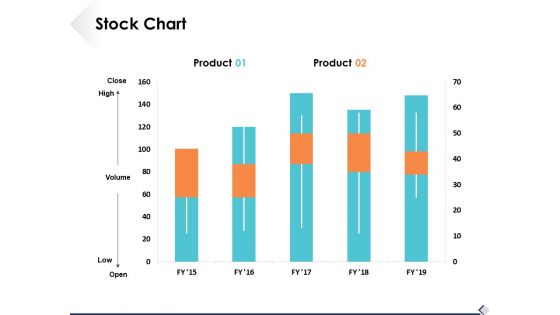
Stock Chart Finance Ppt PowerPoint Presentation Styles Background Image
This is a stock chart finance ppt powerpoint presentation styles background image. This is a two stage process. The stages in this process are analysis, marketing, icons, finance, strategy.
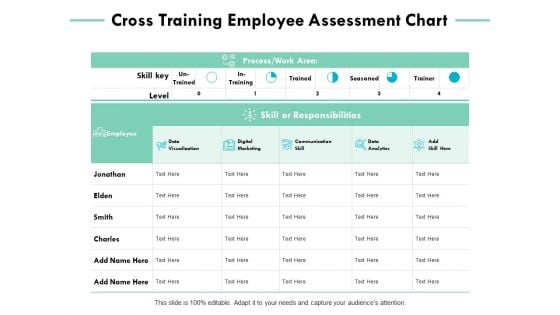
Cross Training Employee Assessment Chart Ppt PowerPoint Presentation Gallery Templates
This is a cross training employee assessment chart ppt powerpoint presentation gallery templates. The topics discussed in this diagram are business, management, compare, marketing. This is a completely editable PowerPoint presentation, and is available for immediate download.

Employee Assessment Review Chart Ppt PowerPoint Presentation Infographics Graphics
This is a employee assessment review chart ppt powerpoint presentation infographics graphics. The topics discussed in this diagram are business, management, marketing. This is a completely editable PowerPoint presentation, and is available for immediate download.
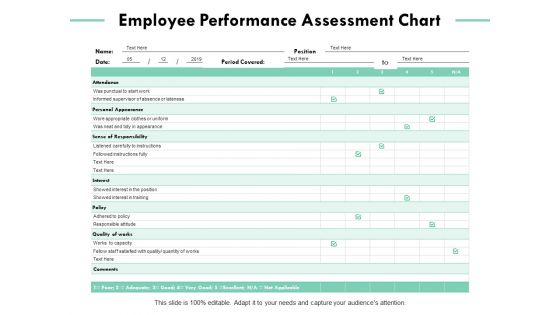
Employee Performance Assessment Chart Ppt PowerPoint Presentation Pictures Structure
This is a employee performance assessment chart ppt powerpoint presentation pictures structure. The topics discussed in this diagram are business, management, marketing, compare. This is a completely editable PowerPoint presentation, and is available for immediate download.
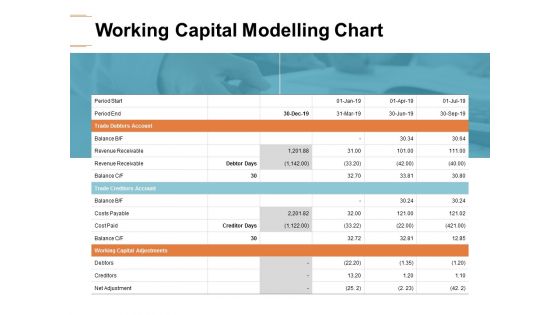
Working Capital Modelling Chart Ppt PowerPoint Presentation Visual Aids Pictures
presenting this set of slides with name working capital modelling chart ppt powerpoint presentation visual aids pictures. the topics discussed in these slides are trade debtors account, trade creditors account, working capital adjustments. this is a completely editable powerpoint presentation and is available for immediate download. download now and impress your audience.
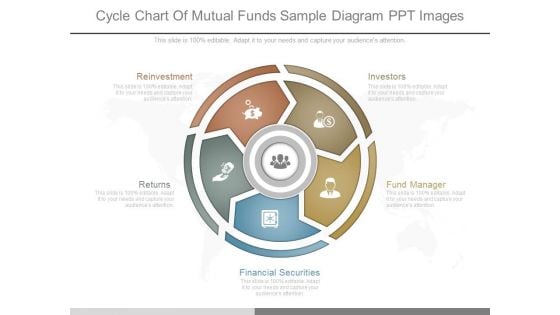
Cycle Chart Of Mutual Funds Sample Diagram Ppt Images
This is a cycle chart of mutual funds sample diagram ppt images. This is a five stage process. The stages in this process are reinvestment, returns, investors, fund manager, financial securities.


 Continue with Email

 Home
Home


