Scoring Chart
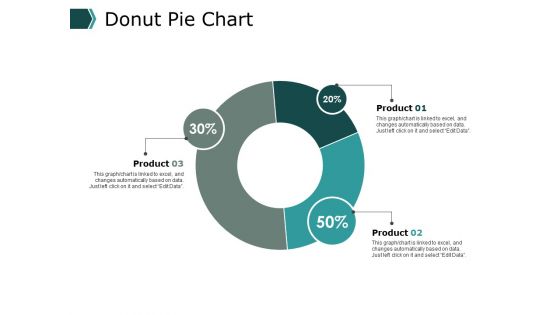
Donut Pie Chart Finance Ppt PowerPoint Presentation File Slide Download
This is a donut pie chart finance ppt powerpoint presentation file slide download. This is a three stage process. The stages in this process are finance, marketing, management, investment, analysis.
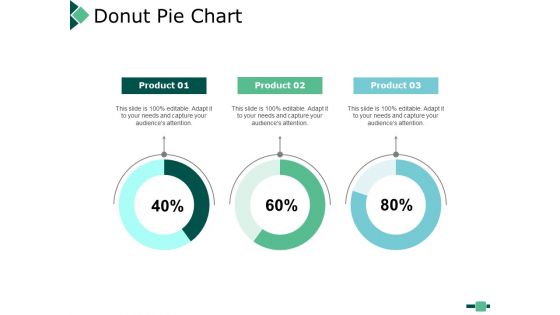
Donut Pie Chart Finance Ppt PowerPoint Presentation Styles Summary
This is a donut pie chart finance ppt powerpoint presentation styles summary. This is a three stage process. The stages in this process are finance, marketing, management, investment, analysis.
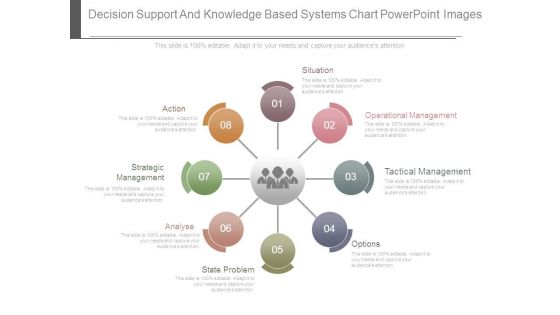
Decision Support And Knowledge Based Systems Chart Powerpoint Images
This is a decision support and knowledge based systems chart powerpoint images. This is a eight stage process. The stages in this process are situation, operational management, tactical management, options, state problem, analyse, strategic management, action.
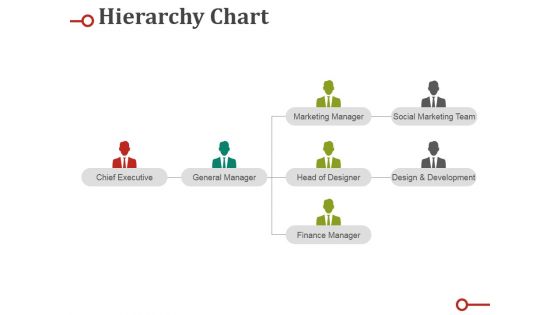
Hierarchy Chart Ppt PowerPoint Presentation Infographic Template Designs Download
This is a hierarchy chart ppt powerpoint presentation infographic template designs download. This is a four stage process. The stages in this process are chief executive, general manager, marketing manager, head of designer, finance manager.
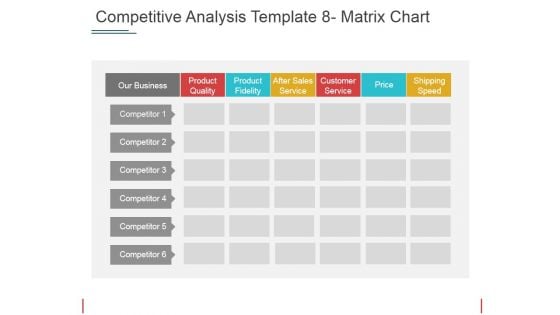
Competitive Analysis Matrix Chart Ppt PowerPoint Presentation Portfolio Format Ideas
This is a competitive analysis matrix chart ppt powerpoint presentation portfolio format ideas. This is a six stage process. The stages in this process are our business, product quality, product fidelity, after sales service, customer service.
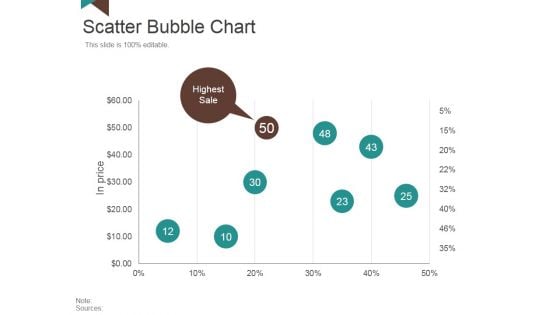
Scatter Bubble Chart Ppt PowerPoint Presentation Inspiration Backgrounds
This is a scatter bubble chart ppt powerpoint presentation inspiration backgrounds. This is a five stage process. The stages in this process are highest sale, in price, business, marketing, success.
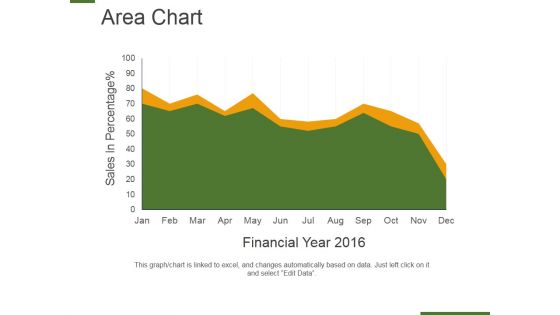
Area Chart Ppt PowerPoint Presentation Layouts Graphics Example
This is a area chart ppt powerpoint presentation layouts graphics example. This is a two stage process. The stages in this process are sales in percentage, financial year, business, marketing, presentation.
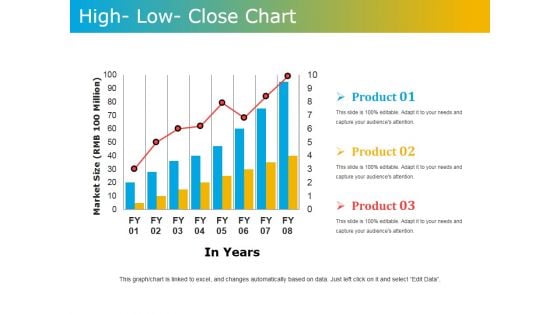
High Low Close Chart Ppt PowerPoint Presentation Model Graphics Tutorials
This is a high low close chart ppt powerpoint presentation model graphics tutorials. This is a three stage process. The stages in this process are market size, in years, product.
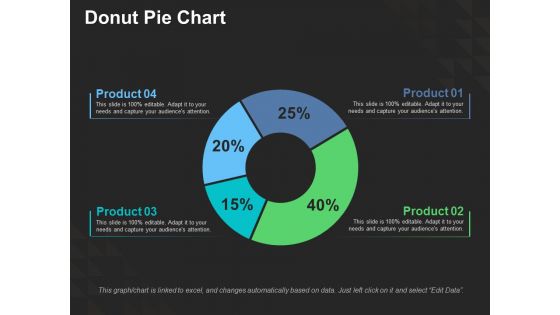
Donut Pie Chart Ppt PowerPoint Presentation Ideas Design Templates
This is a donut pie chart ppt powerpoint presentation ideas design templates. This is a four stage process. The stages in this process are analysis finance, investment, business, planning, marketing.
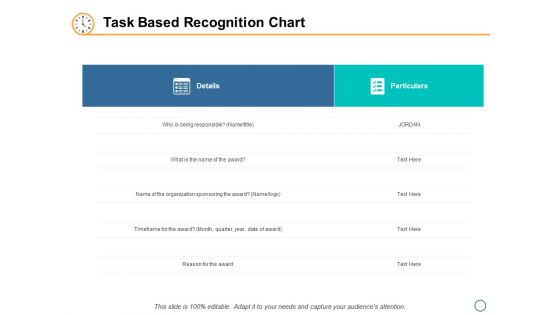
Task Based Recognition Chart Ppt PowerPoint Presentation Inspiration Vector
This is a task based recognition chart ppt powerpoint presentation inspiration vector. This is a two stage process. The stages in this process are business, planning, strategy, detail, particular.
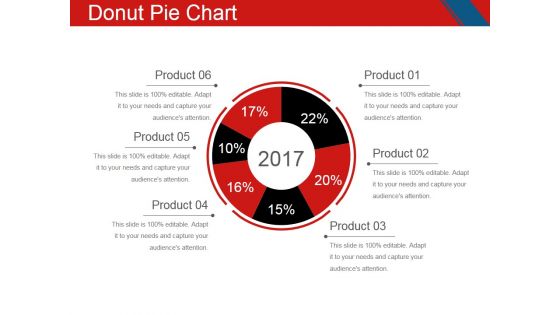
Donut Pie Chart Ppt PowerPoint Presentation Infographic Template Sample
This is a donut pie chart ppt powerpoint presentation infographic template sample. This is a six stage process. The stages in this process are business, pie, process, planning, strategy.
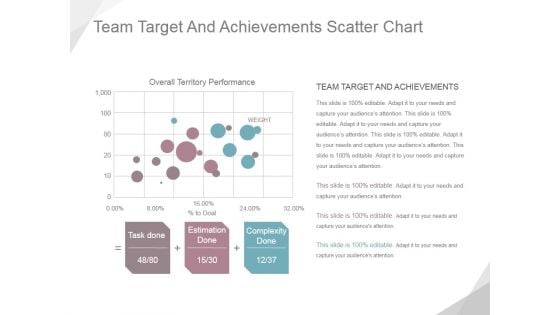
Team Target And Achievements Scatter Chart Ppt PowerPoint Presentation Example
This is a team target and achievements scatter chart ppt powerpoint presentation example. This is a three stage process. The stages in this process are overall territory performance, task done, estimation done, complexity done.
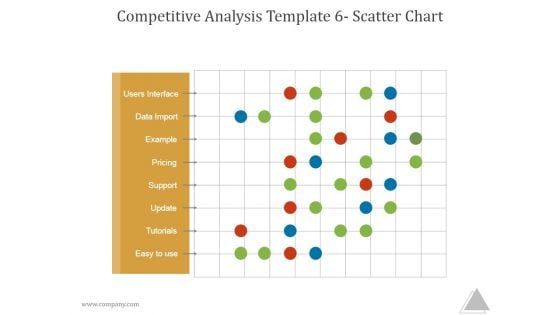
Competitive Analysis Template 6 Scatter Chart Ppt PowerPoint Presentation Shapes
This is a competitive analysis template 6 scatter chart ppt powerpoint presentation shapes. This is a one stage process. The stages in this process are users interface, data import, example, pricing, support update, tutorials, easy to use.
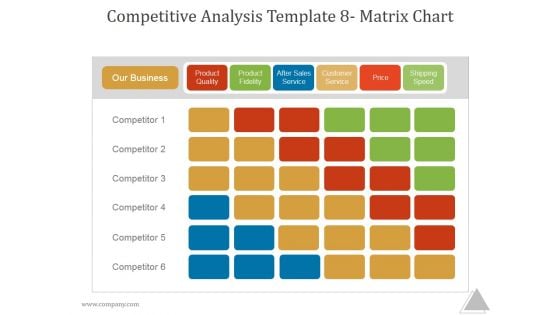
Competitive Analysis Template 8 Matrix Chart Ppt PowerPoint Presentation Templates
This is a competitive analysis template 8 matrix chart ppt powerpoint presentation templates. This is a six stage process. The stages in this process are our business, product quality, product fidelity, after sales service, customer service, price, shipping speed, competitor.
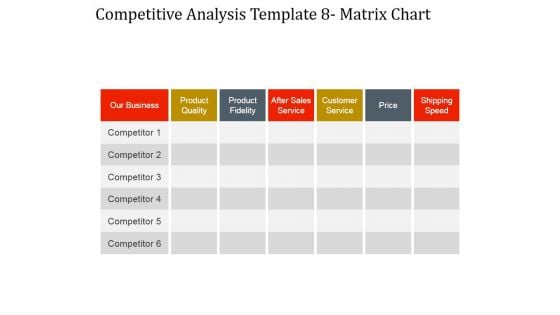
Competitive Analysis Matrix Chart Ppt PowerPoint Presentation Gallery
This is a competitive analysis matrix chart ppt powerpoint presentation gallery. This is a seven stage process. The stages in this process are our business, product quality, product fidelity, after sales service, customer service, price, shipping speed.
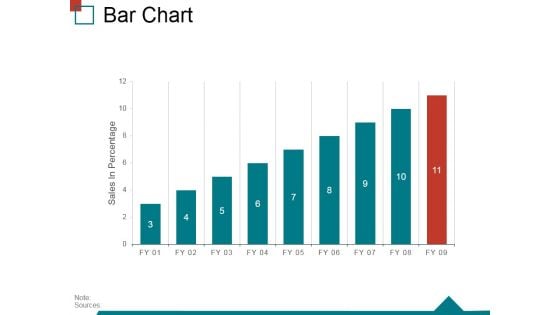
Bar Chart Ppt PowerPoint Presentation Infographic Template Skills
This is a bar chart ppt powerpoint presentation infographic template skills. This is a nine stage process. The stages in this process are sales in percentage, finance, business, marketing, strategy, success.
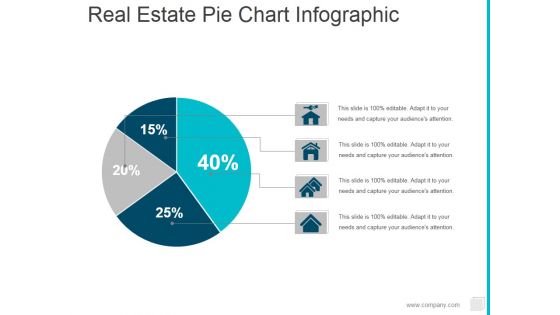
Real Estate Pie Chart Infographic Ppt PowerPoint Presentation Ideas Shapes
This is a real estate pie chart infographic ppt powerpoint presentation ideas shapes. This is a four stage process. The stages in this process are pie, finance, marketing, percentage.
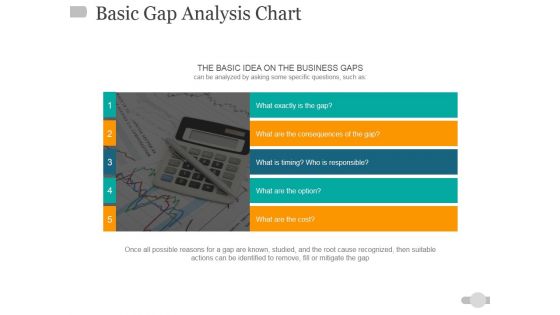
Basic Gap Analysis Chart Ppt PowerPoint Presentation Pictures Design Ideas
This is a basic gap analysis chart ppt powerpoint presentation pictures design ideas. This is a five stage process. The stages in this process are business, finance, marketing, analysis, investment.

Organization Chart Template Ppt PowerPoint Presentation Infographic Template Styles
This is a organization chart template ppt powerpoint presentation infographic template styles. This is a four stage process. The stages in this process are john smith, anita carol, merry doe, jess parker.
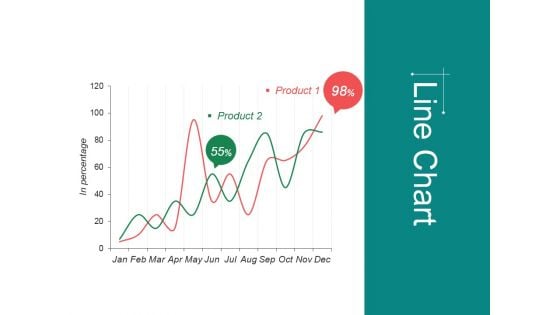
Line Chart Ppt Powerpoint Presentation Infographic Template Format
This is a line chart ppt powerpoint presentation infographic template format. This is a two stage process. The stages in this process are jan, feb, mar, apr, may, financial.

Scatter Bubble Chart Ppt PowerPoint Presentation Professional Model
This is a scatter bubble chart ppt powerpoint presentation professional model. This is a six stage process. The stages in this process are sales in profit, financial year, growth, business, marketing, strategy.
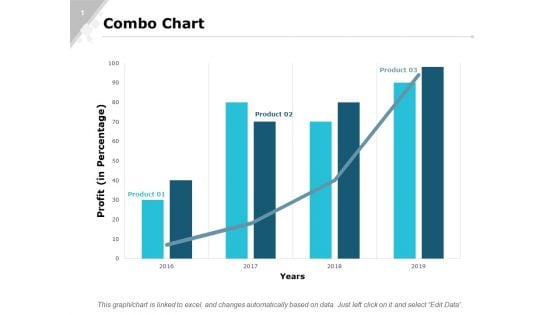
Combo Chart Graph Ppt PowerPoint Presentation Gallery Designs Download
This is a combo chart graph ppt powerpoint presentation gallery designs download. This is a three stage process. The stages in this process are finance, marketing, analysis, investment, million.
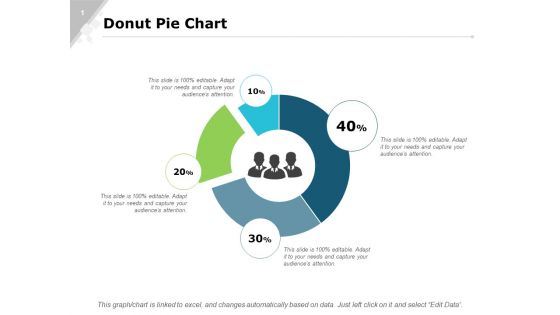
Donut Pie Chart Bar Ppt PowerPoint Presentation Infographics Slide Portrait
This is a donut pie chart bar ppt powerpoint presentation infographics slide portrait. This is a four stage process. The stages in this process are finance, marketing, analysis, investment, million.
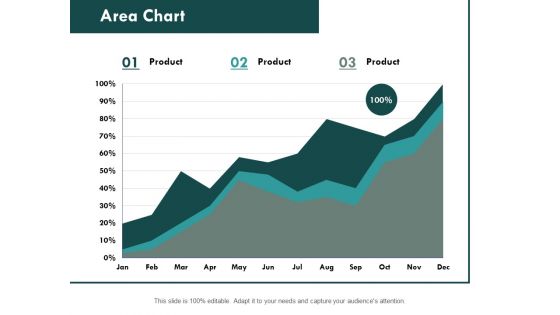
Area Chart Graph Ppt PowerPoint Presentation Professional Format Ideas
This is a column chart graph ppt powerpoint presentation slides file formats. This is a stage three process. The stages in this process are finance, marketing, analysis, investment, million.
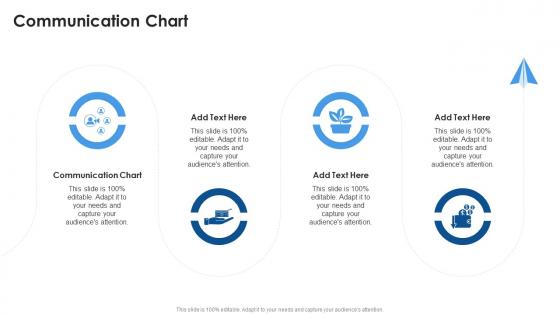
Communication Chart In Powerpoint And Google Slides Cpb
Introducing our well designed Communication Chart In Powerpoint And Google Slides Cpb. This PowerPoint design presents information on topics like Communication Chart. As it is predesigned it helps boost your confidence level. It also makes you a better presenter because of its high quality content and graphics. This PPT layout can be downloaded and used in different formats like PDF, PNG, and JPG. Not only this, it is available in both Standard Screen and Widescreen aspect ratios for your convenience. Therefore, click on the download button now to persuade and impress your audience. Our Communication Chart In Powerpoint And Google Slides Cpb are topically designed to provide an attractive backdrop to any subject. Use them to look like a presentation pro.
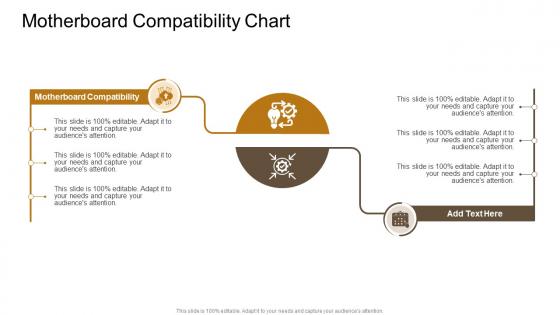
Motherboard Compatibility Chart In Powerpoint And Google Slides Cpb
Introducing our well-designed Motherboard Compatibility Chart In Powerpoint And Google Slides Cpb. This PowerPoint design presents information on topics like Motherboard Compatibility Chart. As it is predesigned it helps boost your confidence level. It also makes you a better presenter because of its high-quality content and graphics. This PPT layout can be downloaded and used in different formats like PDF, PNG, and JPG. Not only this, it is available in both Standard Screen and Widescreen aspect ratios for your convenience. Therefore, click on the download button now to persuade and impress your audience. Our Motherboard Compatibility Chart In Powerpoint And Google Slides Cpb are topically designed to provide an attractive backdrop to any subject. Use them to look like a presentation pro.
Performance Internet Chart In Powerpoint And Google Slides Cpb
Introducing our well designed Performance Internet Chart In Powerpoint And Google Slides Cpb. This PowerPoint design presents information on topics like Performance Internet Chart. As it is predesigned it helps boost your confidence level. It also makes you a better presenter because of its high quality content and graphics. This PPT layout can be downloaded and used in different formats like PDF, PNG, and JPG. Not only this, it is available in both Standard Screen and Widescreen aspect ratios for your convenience. Therefore, click on the download button now to persuade and impress your audience. Our Performance Internet Chart In Powerpoint And Google Slides Cpb are topically designed to provide an attractive backdrop to any subject. Use them to look like a presentation pro.
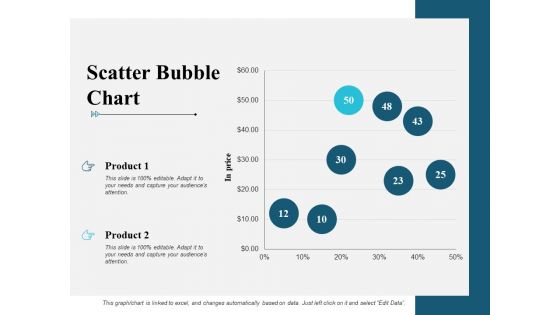
Scatter Bubble Chart Graph Ppt PowerPoint Presentation Infographic Template Maker
This is a scatter bubble chart graph ppt powerpoint presentation infographic template maker. This is a two stage process. The stages in this process are finance, marketing, management, investment, analysis.
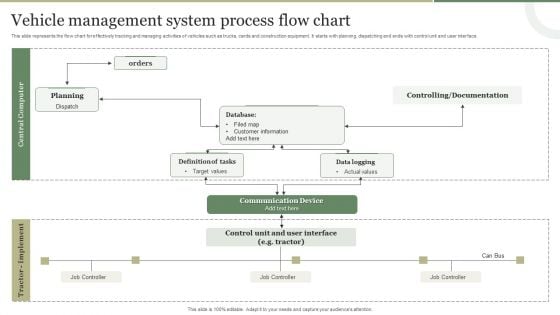
Vehicle Management System Process Flow Chart Introduction PDF
This slide represents the flow chart for effectively tracking and managing activities of vehicles such as trucks, cards and construction equipment. It starts with planning, dispatching end ends with control unit and user interface. Showcasing this set of slides titled Vehicle Management System Process Flow Chart Introduction PDF. The topics addressed in these templates are Central Computer, Communication Device, Data Logging. All the content presented in this PPT design is completely editable. Download it and make adjustments in color, background, font etc. as per your unique business setting.
Business Organizational Chart Examples 3d Men Pressenting Success PowerPoint Slides
We present our business organizational chart examples 3d men pressenting success PowerPoint Slides.Present our Communication PowerPoint Templates because Our PowerPoint Templates and Slides ensures Effective communication. They help you put across your views with precision and clarity. Download and present our Business PowerPoint Templates because Our PowerPoint Templates and Slides will let your ideas bloom. Create a bed of roses for your audience. Use our Shapes PowerPoint Templates because Our PowerPoint Templates and Slides will Embellish your thoughts. They will help you illustrate the brilliance of your ideas. Download and present our People PowerPoint Templates because It can Bubble and burst with your ideas. Present our Leadership PowerPoint Templates because Our PowerPoint Templates and Slides will effectively help you save your valuable time. They are readymade to fit into any presentation structure. Use these PowerPoint slides for presentations relating to 3d, Background, Blank, Board, Business, Character, Chart, Communication, Computer, Concept, Consultant, Cooperation, Cute, Dialogue, Discussion, Easel, Empty, Expert, Expertise, Figure, Flipchart, Graphic, Group, Guy, Human, Icon, Idea, Illustration, Leader, Leadership, Manager, Meeting, Men, People, Person, Plan, Pointing, Present, Presentation, Puppet, Speaker, Speech, Teamwork, Whiteboard. The prominent colors used in the PowerPoint template are Red, White, Blue. Presenters tell us our business organizational chart examples 3d men pressenting success PowerPoint Slides are visually appealing. PowerPoint presentation experts tell us our Chart PowerPoint templates and PPT Slides are designed by professionals Professionals tell us our business organizational chart examples 3d men pressenting success PowerPoint Slides will make you look like a winner. People tell us our Chart PowerPoint templates and PPT Slides are designed by a team of presentation professionals. The feedback we get is that our business organizational chart examples 3d men pressenting success PowerPoint Slides are designed by professionals Customers tell us our Chart PowerPoint templates and PPT Slides will get their audience's attention. Correct wrongs with our Business Organizational Chart Examples 3d Men Pressenting Success PowerPoint Slides. Download without worries with our money back guaranteee.
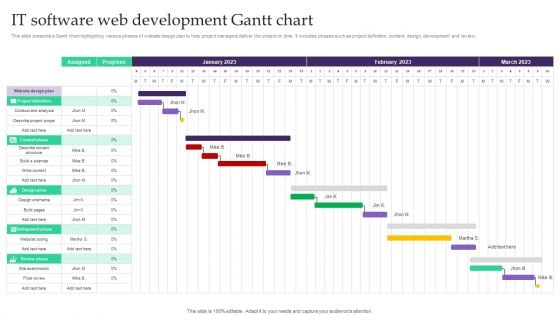
IT Software Web Development Gantt Chart Topics PDF
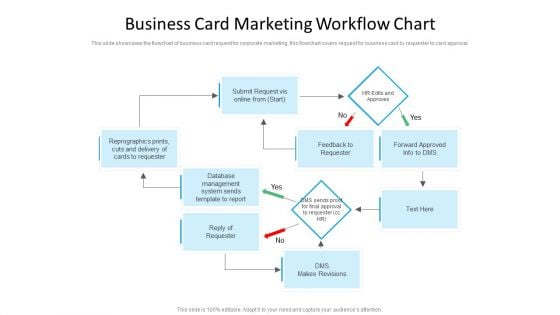
Business Card Marketing Workflow Chart Ppt Portfolio Aids PDF
This slide showcases the flowchart of business card request for corporate marketing, this flowchart covers request for business card by requester to card approval. Deliver an awe-inspiring pitch with this creative business card marketing workflow chart ppt portfolio aids pdf bundle. Topics like business card marketing workflow chart can be discussed with this completely editable template. It is available for immediate download depending on the needs and requirements of the user.
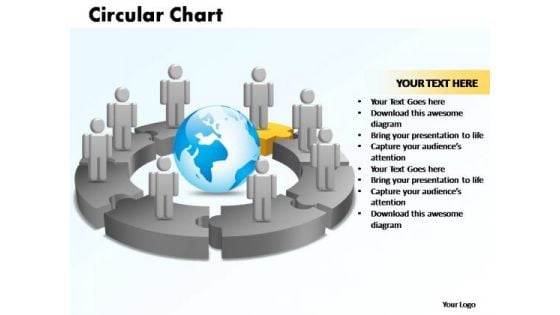
PowerPoint Designs Circular Chart With Globe Ppt Template
PowerPoint Designs Circular Chart With Globe PPT Template-The Circle of Life - a concept emmbedded in our minds and hence easy to comprehend. Life and Business is made up of processes comprising stages that flow from one to another. An excellent graphic to attract the attention of and understanding by your audience to improve earnings.-PowerPoint Designs Circular Chart With Globe PPT Template Bid farewell to ifs and buts. With our PowerPoint Designs Circular Chart With Globe Ppt Template you will be assured and decisive.

Our Market Research Plan Gantt Chart Powerpoint Slide Backgrounds
This is a our market research plan gantt chart powerpoint slide backgrounds. This is a nine stage process. The stages in this process are jan, feb, mar, apr, may.
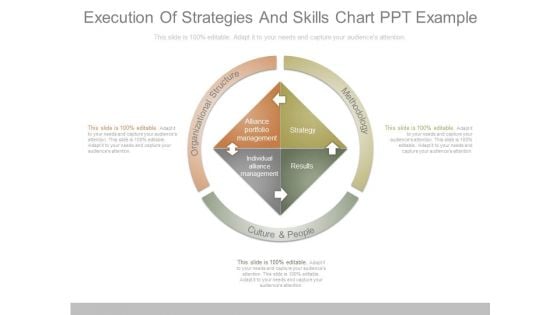
Execution Of Strategies And Skills Chart Ppt Example
This is a execution of strategies and skills chart ppt example. This is a three stage process. The stages in this process are methodology, culture and people, organizational structure, alliance portfolio management, strategy, individual alliance management, results.
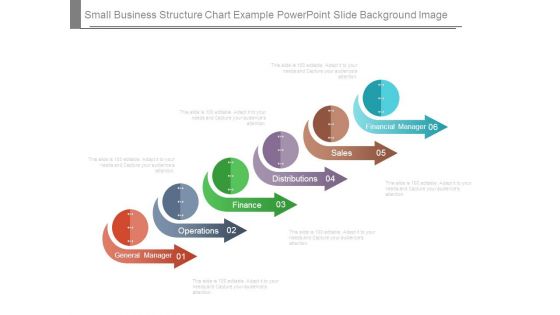
Small Business Structure Chart Example Powerpoint Slide Background Image
This is a small business structure chart example powerpoint slide background image. This is a six stage process. The stages in this process are financial manager, sales, distributions, finance, operations, general manager.
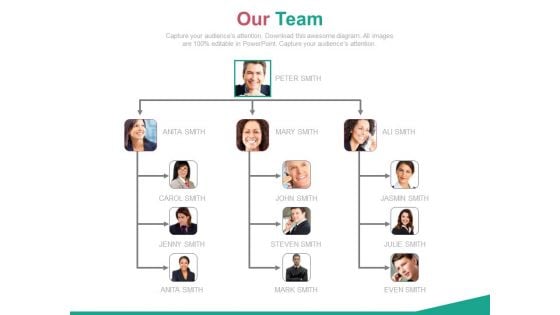
Organizational Chart For Business Intelligence Team Powerpoint Slides
Our above PowerPoint template displays an organizational chart with team pictures. This PPT slide may be used to display working of business intelligence team. You may download this PPT slide to present topics like team strategy and success.
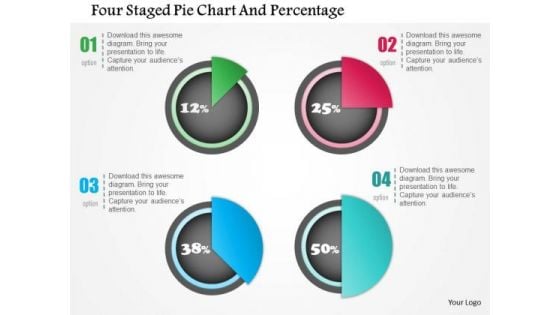
Business Diagram Four Staged Pie Chart And Percentage Presentation Template
Four staged pie chart and percentage values has been used to design this power point template. This PPT contains the concept of financial result analysis. Use this PPT for business and marketing related presentations.
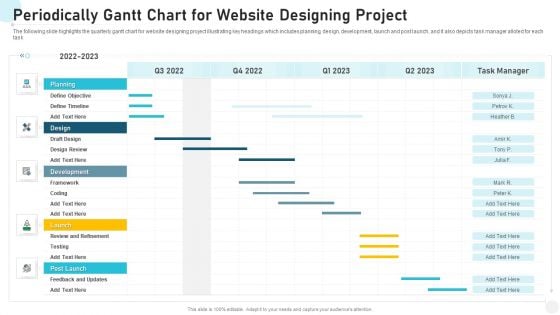
Periodically Gantt Chart For Website Designing Project Portrait PDF
The following slide highlights the quarterly gantt chart for website designing project illustrating key headings which includes planning, design, development, launch and post launch, and it also depicts task manager alloted for each task Showcasing this set of slides titled periodically gantt chart for website designing project portrait pdf. The topics addressed in these templates are periodically gantt chart for website designing project. All the content presented in this PPT design is completely editable. Download it and make adjustments in color, background, font etc. as per your unique business setting.
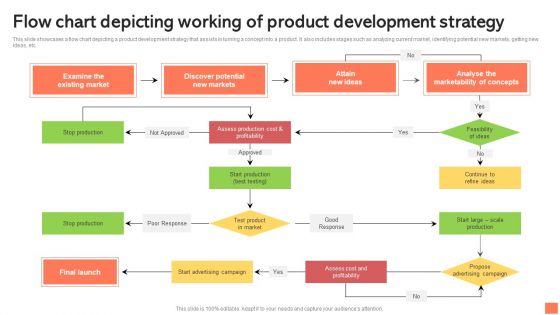
Flow Chart Depicting Working Of Product Development Strategy Sample PDF
This slide showcases a flow chart depicting a product development strategy that assists in turning a concept into a product. It also includes stages such as analyzing current market, identifying potential new markets, getting new ideas, etc. Showcasing this set of slides titled Flow Chart Depicting Working Of Product Development Strategy Sample PDF. The topics addressed in these templates are Existing Market, Profitability, Production Cost. All the content presented in this PPT design is completely editable. Download it and make adjustments in color, background, font etc. as per your unique business setting.
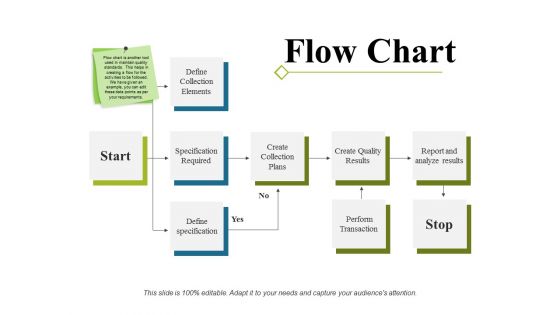
Flow Chart Ppt PowerPoint Presentation File Layout Ideas
This is a flow chart ppt powerpoint presentation file layout ideas. This is a four stage process. The stages in this process are define collection elements, specification required, define specification, create collection plans, create quality results, perform transaction.
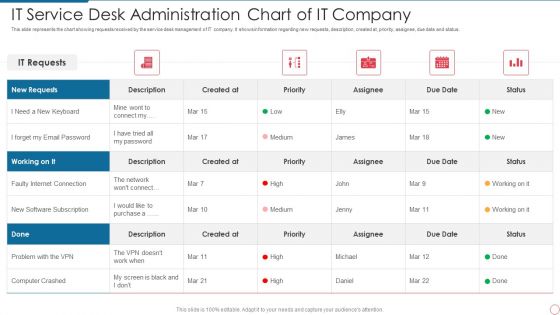
IT Service Desk Administration Chart Of IT Company Infographics PDF
This slide represents the chart showing requests received by the service desk management of IT company. It shows information regarding new requests, description, created at, priority, assignee, due date and status. Showcasing this set of slides titled IT Service Desk Administration Chart Of IT Company Infographics PDF. The topics addressed in these templates are It Service Desk Administration Chart Of It Company. All the content presented in this PPT design is completely editable. Download it and make adjustments in color, background, font etc. as per your unique business setting.
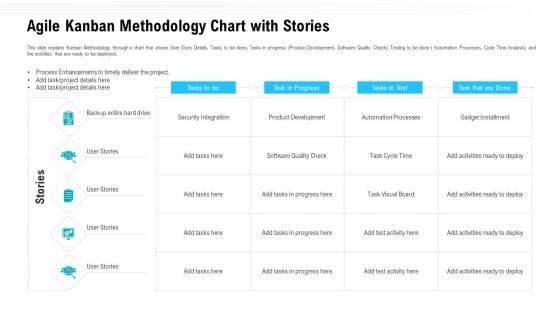
Agile Kanban Methodology Chart With Stories Ppt Model Show PDF
This slide explains Kanban Methodology through a chart that shows User Story Details, Tasks to be done, Tasks in progress Product Development, Software Quality Check, Testing to be done Automation Processes, Cycle Time Analysis and the activities that are ready to be deployed. Deliver an awe inspiring pitch with this creative agile kanban methodology chart with stories ppt model show pdf bundle. Topics like product development, process enhancements to timely deliver the project, agile kanban methodology chart with stories can be discussed with this completely editable template. It is available for immediate download depending on the needs and requirements of the user.
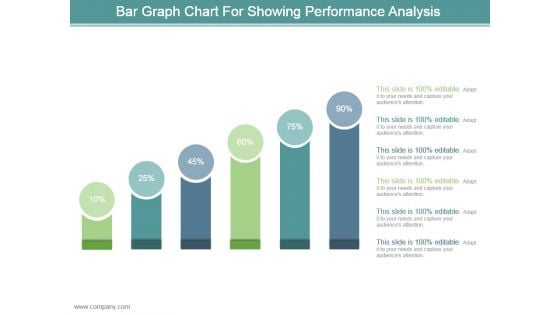
Bar Graph Chart For Showing Performance Analysis Ppt Design
This is a bar graph chart for showing performance analysis ppt design. This is a six stage process. The stages in this process are business, marketing, process, success, presentation.
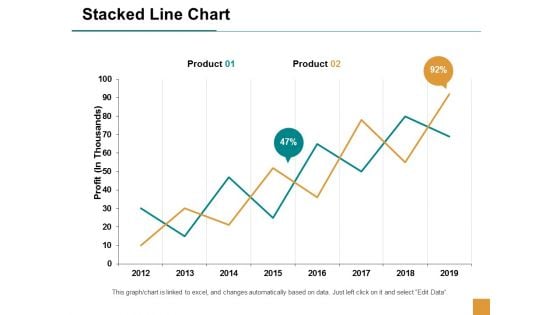
Stacked Line Chart Finance Ppt Powerpoint Presentation Outline Themes
This is a stacked line chart finance ppt powerpoint presentation outline themes. This is a two stage process. The stages in this process are finance, marketing, management, investment, analysis.
Product Marketing Department Team Organizational Chart Icon Professional PDF
Persuade your audience using this Product Marketing Department Team Organizational Chart Icon Professional PDF. This PPT design covers three stages, thus making it a great tool to use. It also caters to a variety of topics including Team Organizational Chart Icon, Product Marketing Department. Download this PPT design now to present a convincing pitch that not only emphasizes the topic but also showcases your presentation skills.
Confidence Chart Ppt PowerPoint Presentation Icon Background Cpb Pdf
Presenting this set of slides with name confidence chart ppt powerpoint presentation icon background cpb pdf. This is an editable Powerpoint five stages graphic that deals with topics like confidence chart to help convey your message better graphically. This product is a premium product available for immediate download and is 100 percent editable in Powerpoint. Download this now and use it in your presentations to impress your audience.
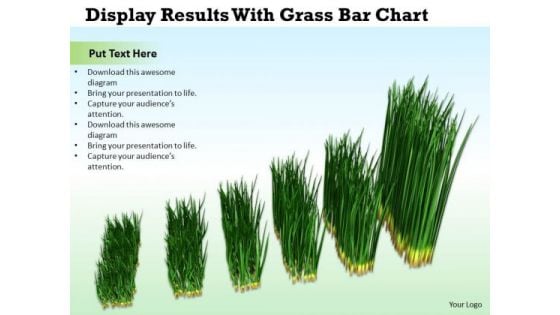
Business And Strategy Display Results With Grass Bar Chart Images
Analyze Ailments On Our business and strategy display results with grass bar chart images Powerpoint Templates. Bring Out The Thinking Doctor In You. Dock Your Thoughts With Our Agriculture Powerpoint Templates. They Will Launch Them Into Orbit.
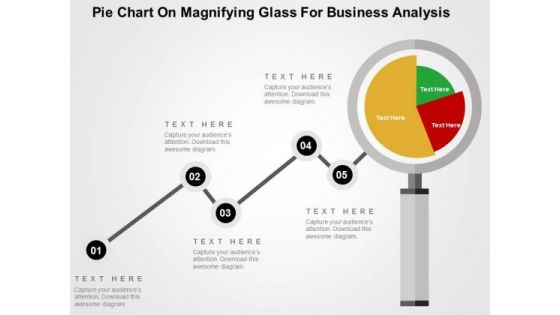
Pie Chart On Magnifying Glass For Business Analysis PowerPoint Template
Visually support your presentation with our above template showing pie chart on magnifying glass. This slide has been professionally designed to emphasize the concept of market research and analysis. Deliver amazing presentations to mesmerize your audience.
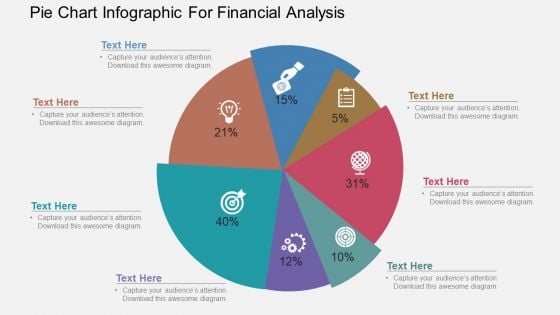
Pie Chart Infographic For Financial Analysis Powerpoint Template
Our above PowerPoint template has been designed with pie chart infographic. This slide is suitable to present financial analysis. Use this business diagram to present your work in a more smart and precise manner.
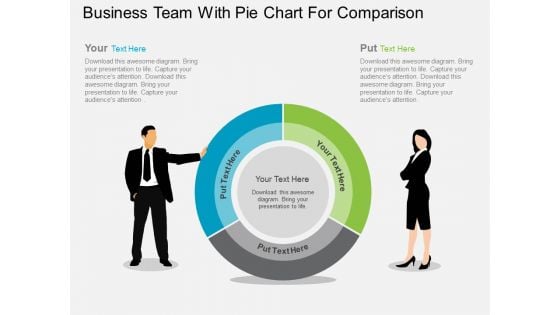
Business Team With Pie Chart For Comparison Powerpoint Template
This business slide contains graphics of pie chart with team members. This PowerPoint template is suitable to present comparison of teams performances. Use this business diagram to present your work in a more smart and precise manner.

PowerPoint Design Slides Chart Rectangular Jigsaw Puzzle Ppt Designs
PowerPoint Design Slides Chart Rectangular Jigsaw Puzzle PPT Designs- It is all there in bits and pieces. Individual components well researched and understood in their place. Now you need to get it all together to form the complete picture and reach the goal. You have the ideas and plans on how to go about it. Use this template to illustrate your method, piece by piece, and interlock the whole process in the minds of your audience.-PowerPoint Design Slides Chart Rectangular Jigsaw Puzzle PPT Designs Electrify your audience with our PowerPoint Design Slides Chart Rectangular Jigsaw Puzzle Ppt Designs. Just download, type and present.
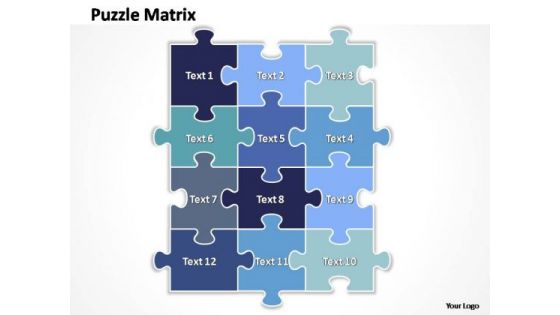
PowerPoint Slide Layout Chart Rectangular Jigsaw Puzzle Ppt Template
PowerPoint Slide layout Chart Rectangular Jigsaw Puzzle PPT Template- It is all there in bits and pieces. Individual components well researched and understood in their place. Now you need to get it all together to form the complete picture and reach the goal. You have the ideas and plans on how to go about it. Use this template to illustrate your method, piece by piece, and interlock the whole process in the minds of your audience.-PowerPoint Slide layout Chart Rectangular Jigsaw Puzzle PPT Template Address eco-clubs with our PowerPoint Slide Layout Chart Rectangular Jigsaw Puzzle Ppt Template. Advocate curbing of carbon emissions.
Cost Benefit Analysis Chart With Icons Powerpoint Layout
This is a cost benefit analysis chart with icons powerpoint layout. This is a two stage process. The stages in this process are balance scale, compare, business, marketing, management.
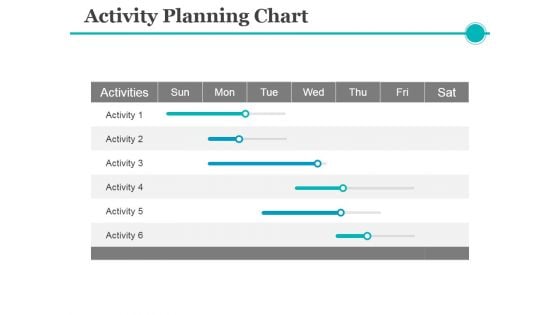
Activity Planning Chart Ppt PowerPoint Presentation Visual Aids Model
This is a activity planning chart ppt powerpoint presentation visual aids model. This is a six stage process. The stages in this process are activities, business, management, table, planning.
Combo Chart Marketing Analysis Ppt Powerpoint Presentation Pictures Icons
This is a combo chart marketing analysis ppt powerpoint presentation pictures icons. This is a three stage process. The stages in this process are finance, marketing, management, investment, analysis.
Clustered Bar Chart Finance Ppt Powerpoint Presentation Icon Graphics Template
This is a clustered bar chart finance ppt powerpoint presentation icon graphics template. This is a four stage process. The stages in this process are finance, marketing, management, investment, analysis.
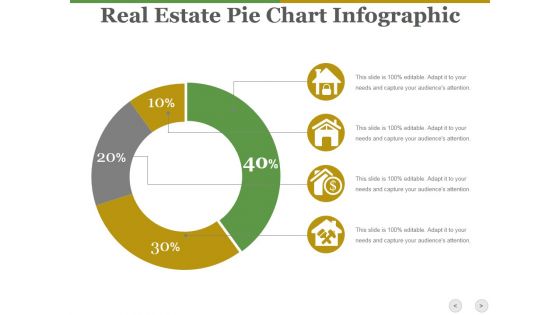
Real Estate Pie Chart Infographic Ppt PowerPoint Presentation Show Diagrams
This is a real estate pie chart infographic ppt powerpoint presentation show diagrams. This is a four stage process. The stages in this process are business, icons, marketing, strategy, process.
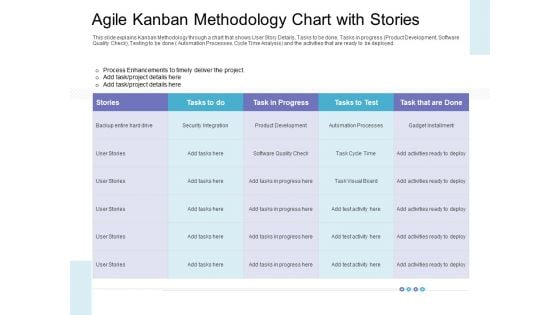
Agile Kanban Methodology Chart With Stories Formats PDF
This slide explains Kanban Methodology through a chart that shows User Story Details, Tasks to be done, Tasks in progress Product Development, Software Quality Check, Testing to be done Automation Processes, Cycle Time Analysis and the activities that are ready to be deployed. Deliver an awe-inspiring pitch with this creative agile kanban methodology chart with stories formats pdf bundle. Topics like agile kanban methodology chart with stories can be discussed with this completely editable template. It is available for immediate download depending on the needs and requirements of the user.
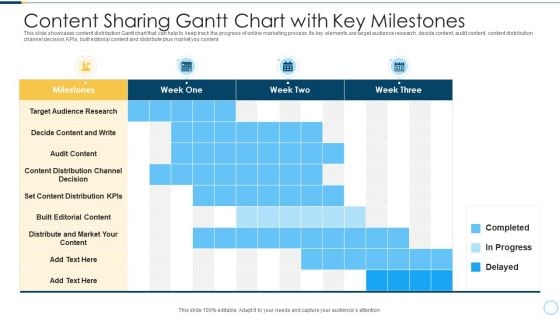
Content Sharing Gantt Chart With Key Milestones Elements PDF
This slide showcases content distribution Gantt chart that can help to keep track the progress of online marketing process. Its key elements are target audience research, decide content, audit content, content distribution channel decision, KPIs, built editorial content and distribute plus market you content Showcasing this set of slides titled content sharing gantt chart with key milestones elements pdf. The topics addressed in these templates are content sharing gantt chart with key milestones. All the content presented in this PPT design is completely editable. Download it and make adjustments in color, background, font etc. as per your unique business setting.


 Continue with Email

 Home
Home


