Snapshot
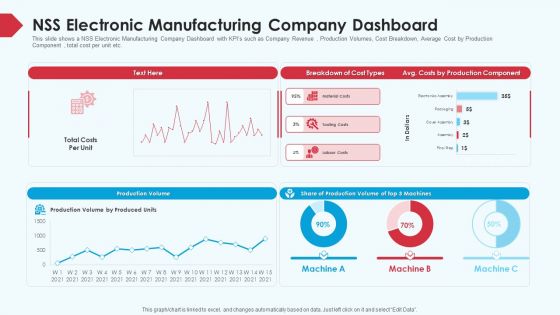
Skill Shortage In A Production Firm Case Study Solution NSS Electronic Manufacturing Company Dashboard Summary PDF
This slide shows a NSS Electronic Manufacturing Company Dashboard with KPIs such as Company Revenue , Production Volumes, Cost Breakdown, Average Cost by Production Component , total cost per unit etc. Deliver and pitch your topic in the best possible manner with this skill shortage in a production firm case study solution NSS electronic manufacturing company dashboard summary pdf. Use them to share invaluable insights on costs by production component, production volume, NSS electronic manufacturing company dashboard and impress your audience. This template can be altered and modified as per your expectations. So, grab it now.
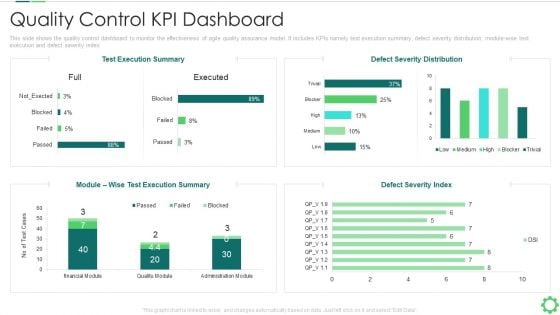
Agile Quality Control Framework IT Quality Control KPI Dashboard Template PDF
This slide shows the quality control dashboard to monitor the effectiveness of agile quality assurance model. It includes KPIs namely test execution summary, defect severity distribution, module wise text execution and defect severity index. Deliver and pitch your topic in the best possible manner with this agile quality control framework it quality control kpi dashboard template pdf. Use them to share invaluable insights on quality control kpi dashboard and impress your audience. This template can be altered and modified as per your expectations. So, grab it now.
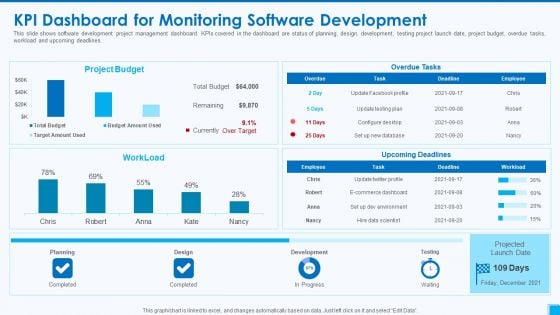
Devops Tools And Configuration IT Kpi Dashboard For Monitoring Software Development Slides PDF
This slide shows software development project management dashboard. KPIs covered in the dashboard are status of planning, design, development, testing project launch date, project budget, overdue tasks, workload and upcoming deadlines. Deliver and pitch your topic in the best possible manner with this devops tools and configuration it kpi dashboard for monitoring software development slides pdf. Use them to share invaluable insights on project budget, planning, design, development and impress your audience. This template can be altered and modified as per your expectations. So, grab it now.
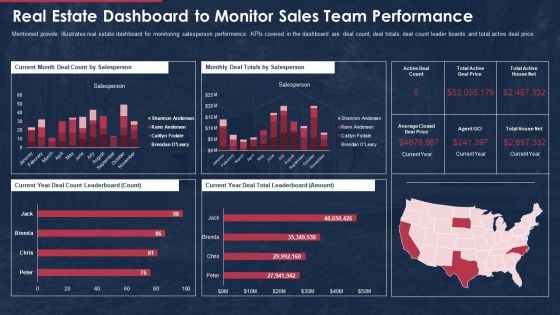
Building Promotional Campaign Real Estate Sales Real Estate Dashboard To Monitor Sales Team Performance Guidelines PDF
This slide portrays property management dashboard with KPIs namely, average days on market, properties for sale, properties for rent, sales vs. target and sales by region. Deliver and pitch your topic in the best possible manner with this building promotional campaign real estate sales real estate dashboard to monitor sales team performance guidelines pdf. Use them to share invaluable insights on property management kpi dashboard and impress your audience. This template can be altered and modified as per your expectations. So, grab it now.
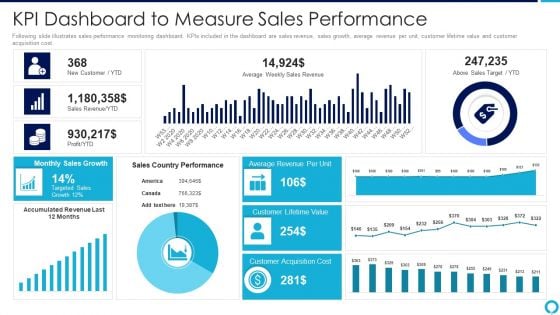
Partnership Management Strategies Kpi Dashboard To Measure Sales Performance Introduction PDF
Following slide illustrates sales performance monitoring dashboard. KPIs included in the dashboard are sales revenue, sales growth, average revenue per unit, customer lifetime value and customer acquisition cost.Deliver and pitch your topic in the best possible manner with this partnership management strategies kpi dashboard to measure sales performance introduction pdf Use them to share invaluable insights on average revenue, monthly sales growth, customer acquisition cost and impress your audience. This template can be altered and modified as per your expectations. So, grab it now.
Agile QA Procedure Dashboard For Tracking The Agile Quality Assurance Process Effectiveness Clipart PDF
This slide illustrates the KPI dashboard used for tracking the effectiveness of agile quality assurance model. KPIs covered in the dashboard are release and quality compliance, test functions and defects. Deliver and pitch your topic in the best possible manner with this agenda for agile qa procedure introduction pdf. Use them to share invaluable insights on dashboard for tracking the agile quality assurance process effectiveness and impress your audience. This template can be altered and modified as per your expectations. So, grab it now.
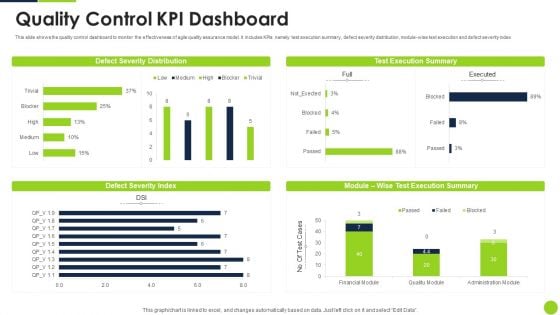
Agile Methodology Quality Control Quality Control KPI Dashboard Ppt Infographic Template Layout Ideas PDF
This slide shows the quality control dashboard to monitor the effectiveness of agile quality assurance model. It includes KPIs namely test execution summary, defect severity distribution, module-wise text execution and defect severity index Deliver an awe inspiring pitch with this creative agile methodology quality control quality control kpi dashboard ppt infographic template layout ideas pdf bundle. Topics like quality control kpi dashboard can be discussed with this completely editable template. It is available for immediate download depending on the needs and requirements of the user.
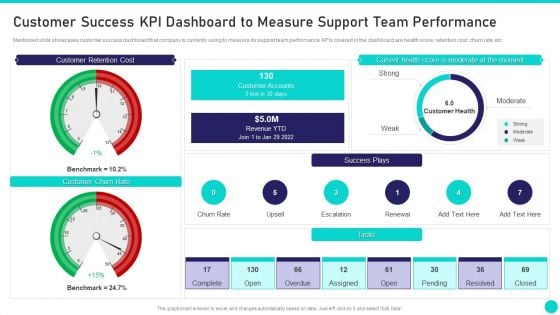
Client Achievements Playbook Customer Success KPI Dashboard To Measure Support Brochure PDF
Mentioned slide showcases customer success dashboard that company is currently using to measure its support team performance. KPIs covered in the dashboard are health score, retention cost, churn rate etc. Deliver an awe inspiring pitch with this creative client achievements playbook customer success kpi dashboard to measure support brochure pdf bundle. Topics like customer retention cost, current health score, customer churn rate, customer accounts, customer health can be discussed with this completely editable template. It is available for immediate download depending on the needs and requirements of the user.

Cryptocurrency Investment Playbook Dashboard To Effectively Track Bitcoin Performance Rules PDF
The following dashboard highlights key parameters that can be used by the organization to track the performance of their Bitcoin investment, it enlists major KPIs such as price of Bitcoin, transaction chart and its historical performance.Deliver and pitch your topic in the best possible manner with this cryptocurrency investment playbook dashboard to effectively track bitcoin performance rules pdf Use them to share invaluable insights on dashboard to effectively track bitcoin performance and impress your audience. This template can be altered and modified as per your expectations. So, grab it now.
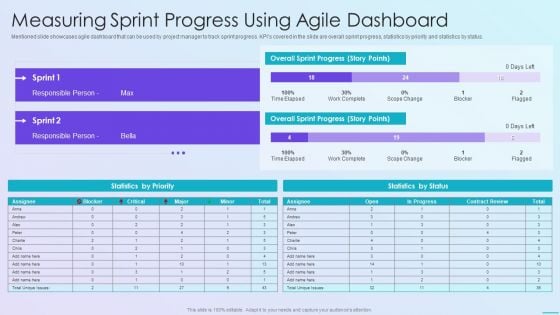
Playbook For Application Developers Measuring Sprint Progress Using Agile Dashboard Mockup PDF
Mentioned slide showcases agile dashboard that can be used by project manager to track sprint progress. KPIs covered in the slide are overall sprint progress, statistics by priority and statistics by status.Deliver and pitch your topic in the best possible manner with this Playbook for application developers measuring sprint progress using agile dashboard mockup pdf. Use them to share invaluable insights on measuring sprint progress using agile dashboard and impress your audience. This template can be altered and modified as per your expectations. So, grab it now.
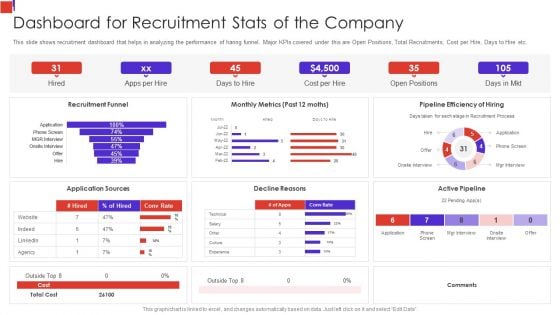
Outline Of Employee Recruitment Dashboard For Recruitment Stats Of The Company Formats PDF
This slide shows recruitment dashboard that helps in analyzing the performance of haring funnel. Major KPIs covered under this are Open Positions, Total Recruitments, Cost per Hire, Days to Hire etc.Deliver and pitch your topic in the best possible manner with this Outline Of Employee Recruitment Dashboard For Recruitment Stats Of The Company Formats PDF Use them to share invaluable insights on Dashboard For Recruitment, Stats Of The Company, Decline Reasons and impress your audience. This template can be altered and modified as per your expectations. So, grab it now.
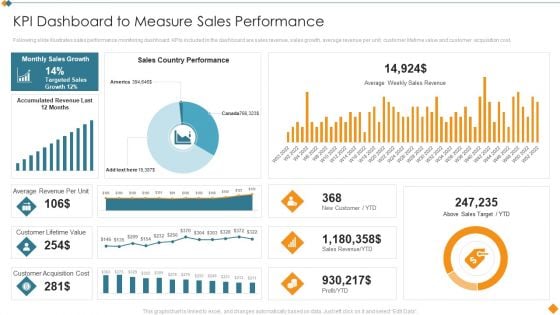
Maintaining Partner Relationships KPI Dashboard To Measure Sales Performance Rules PDF
Following slide illustrates sales performance monitoring dashboard. KPIs included in the dashboard are sales revenue, sales growth, average revenue per unit, customer lifetime value and customer acquisition cost. Deliver and pitch your topic in the best possible manner with this Maintaining Partner Relationships KPI Dashboard To Measure Sales Performance Rules PDF. Use them to share invaluable insights on Sales Country Performance, Above Sales Target, YTD, Customer Lifetime Value, Customer Acquisition Cost and impress your audience. This template can be altered and modified as per your expectations. So, grab it now.
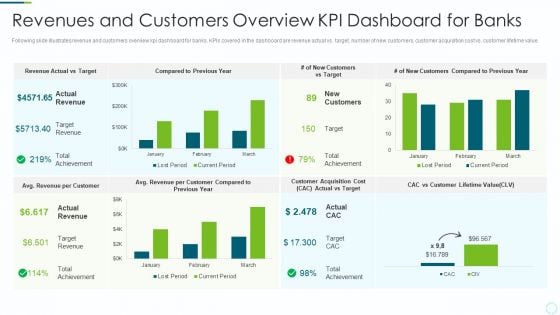
Implementing BPM Techniques Revenues And Customers Overview KPI Dashboard For Banks Microsoft PDF
Following slide illustrates revenue and customers overview kpi dashboard for banks. KPIs covered in the dashboard are revenue actual vs. target, number of new customers, customer acquisition cost vs. customer lifetime value. Deliver an awe inspiring pitch with this creative Implementing BPM Techniques Revenues And Customers Overview KPI Dashboard For Banks Microsoft PDF bundle. Topics like Target Revenue, Customers Compared, Customer Lifetime can be discussed with this completely editable template. It is available for immediate download depending on the needs and requirements of the user.
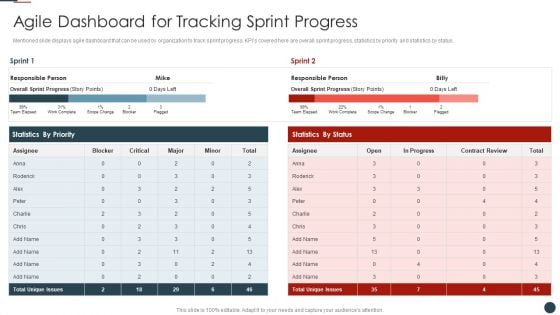
Implementing Agile Software Development Methodology For Cost Cutting IT Agile Dashboard Clipart PDF
Mentioned slide displays agile dashboard that can be used by organization to track sprint progress. KPIs covered here are overall sprint progress, statistics by priority and statistics by status.Deliver and pitch your topic in the best possible manner with this Implementing Agile Software Development Methodology For Cost Cutting IT Agile Dashboard Clipart PDF Use them to share invaluable insights on Agile Dashboard, Tracking Sprint, Progress and impress your audience. This template can be altered and modified as per your expectations. So, grab it now.
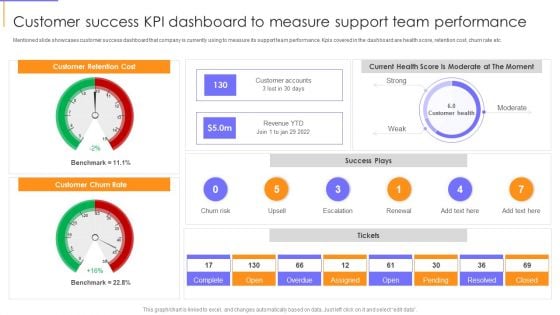
Guide To Client Success Customer Success KPI Dashboard To Measure Support Team Performance Topics PDF
Mentioned slide showcases customer success dashboard that company is currently using to measure its support team performance. Kpis covered in the dashboard are health score, retention cost, churn rate etc. Deliver an awe inspiring pitch with this creative Guide To Client Success Customer Success KPI Dashboard To Measure Support Team Performance Topics PDF bundle. Topics like Customer Churn Rate, Customer Retention Cost, Revenue can be discussed with this completely editable template. It is available for immediate download depending on the needs and requirements of the user.
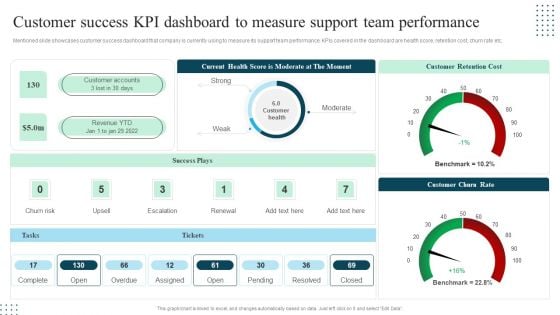
Client Success Playbook Customer Success KPI Dashboard To Measure Support Team Background PDF
Mentioned slide showcases customer success dashboard that company is currently using to measure its support team performance. KPIs covered in the dashboard are health score, retention cost, churn rate etc. Deliver an awe inspiring pitch with this creative Client Success Playbook Customer Success KPI Dashboard To Measure Support Team Background PDF bundle. Topics like Customer Retention Cost, Customer Churn Rate, Success Plays can be discussed with this completely editable template. It is available for immediate download depending on the needs and requirements of the user.
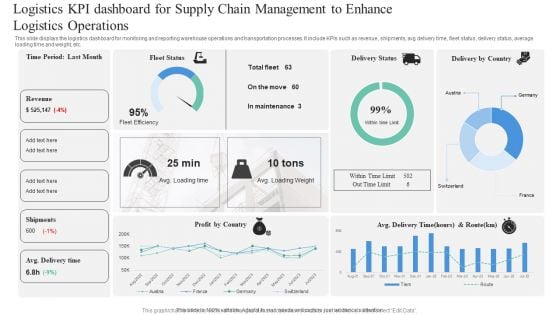
Logistics KPI Dashboard For Supply Chain Management To Enhance Logistics Operations Professional PDF
This slide displays the logistics dashboard for monitoring and reporting warehouse operations and transportation processes. It include KPIs such as revenue, shipments, avg delivery time, fleet status, delivery status, average loading time and weight, etc. Pitch your topic with ease and precision using this Logistics KPI Dashboard For Supply Chain Management To Enhance Logistics Operations Professional PDF. This layout presents information on Logistics KPI, Dashboard For Supply Chain, Management To Enhance, Logistics Operations. It is also available for immediate download and adjustment. So, changes can be made in the color, design, graphics or any other component to create a unique layout.
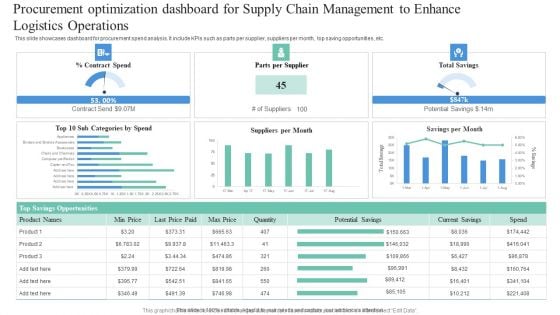
Procurement Optimization Dashboard For Supply Chain Management To Enhance Logistics Operations Elements PDF
This slide showcases dashboard for procurement spend analysis. It include KPIs such as parts per supplier, suppliers per month, top saving opportunities, etc. Pitch your topic with ease and precision using this Procurement Optimization Dashboard For Supply Chain Management To Enhance Logistics Operations Elements PDF. This layout presents information on Procurement Optimization Dashboard, Supply Chain Management, Enhance Logistic Operations. It is also available for immediate download and adjustment. So, changes can be made in the color, design, graphics or any other component to create a unique layout.
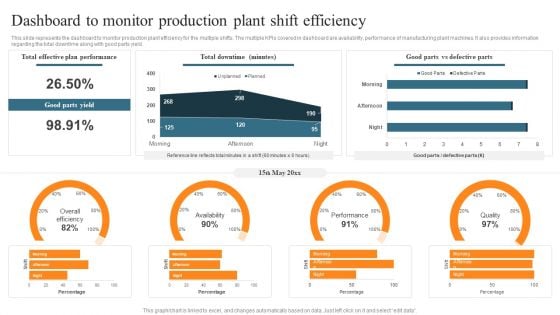
Leveraging Predictive Maintenance To Enhance Production Process Dashboard To Monitor Production Plant Shift Efficiency Structure PDF
This slide represents the dashboard to monitor production plant efficiency for the multiple shifts. The multiple KPIs covered in dashboard are availability, performance of manufacturing plant machines. It also provides information regarding the total downtime along with good parts yield. There are so many reasons you need a Leveraging Predictive Maintenance To Enhance Production Process Dashboard To Monitor Production Plant Shift Efficiency Structure PDF. The first reason is you cant spend time making everything from scratch, Thus, Slidegeeks has made presentation templates for you too. You can easily download these templates from our website easily.
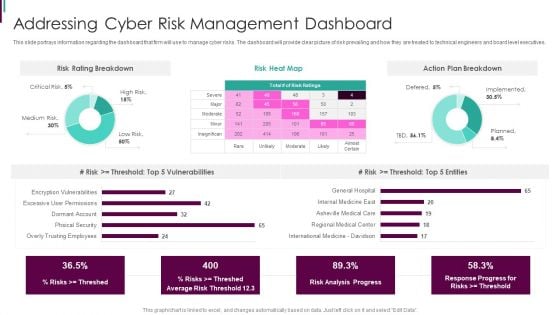
Developing Business Analytics Framework Addressing Cyber Risk Management Dashboard Graphics PDF
This slide portrays information regarding the dashboard that firm will use to manage cyber risks. The dashboard will provide clear picture of risk prevailing and how they are treated to technical engineers and board level executives.Deliver and pitch your topic in the best possible manner with this Developing Business Analytics Framework Addressing Cyber Risk Management Dashboard Graphics PDF Use them to share invaluable insights on Risk Breakdown, Action Breakdown, Vulnerabilities and impress your audience. This template can be altered and modified as per your expectations. So, grab it now.
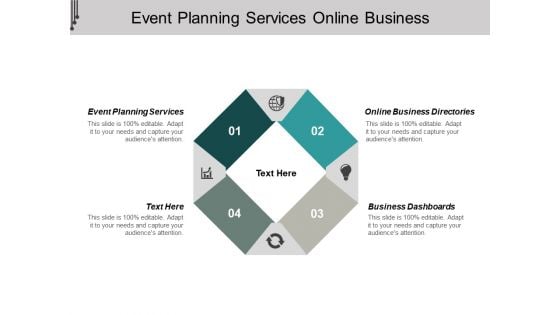
Event Planning Services Online Business Directories Business Dashboards Ppt PowerPoint Presentation File Background Images
This is a event planning services online business directories business dashboards ppt powerpoint presentation file background images. This is a four stage process. The stages in this process are event planning services, online business directories, business dashboards.

Manufacturing Quality Assurance And Control Measures Dashboard To Evaluate Manufacturing Quality Infographics PDF
This slide showcases the KPIs that would help a business organization to evaluate improvements in the new production planning and control system. It includes total production, defective production, production rate, average cycle duration, etc. This modern and well arranged Manufacturing Quality Assurance And Control Measures Dashboard To Evaluate Manufacturing Quality Infographics PDF provides lots of creative possibilities. It is very simple to customize and edit with the Powerpoint Software. Just drag and drop your pictures into the shapes. All facets of this template can be edited with Powerpoint, no extra software is necessary. Add your own material, put your images in the places assigned for them, adjust the colors, and then you can show your slides to the world, with an animated slide included.
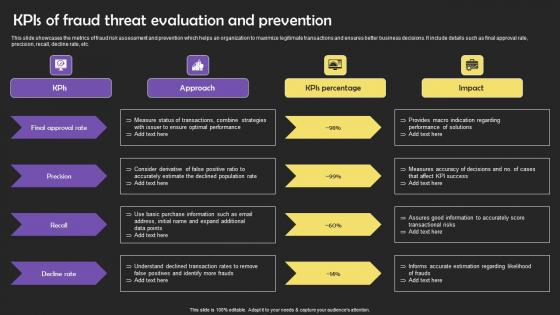
KPIS Of Fraud Threat Evaluation And Prevention Formats Pdf
This slide showcases the metrics of fraud risk assessment and prevention which helps an organization to maximize legitimate transactions and ensures better business decisions. It include details such as final approval rate, precision, recall, decline rate, etc. Pitch your topic with ease and precision using this KPIS Of Fraud Threat Evaluation And Prevention Formats Pdf This layout presents information on Final Approval Rate, Optimal Performance, Decline Rate It is also available for immediate download and adjustment. So, changes can be made in the color, design, graphics or any other component to create a unique layout. This slide showcases the metrics of fraud risk assessment and prevention which helps an organization to maximize legitimate transactions and ensures better business decisions. It include details such as final approval rate, precision, recall, decline rate, etc.
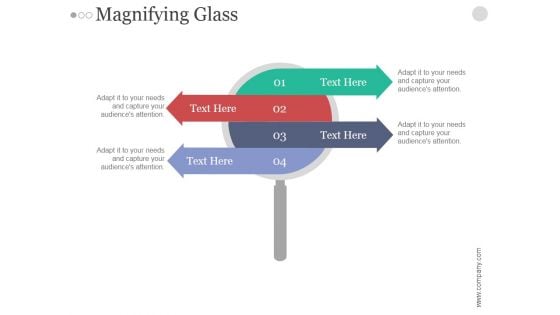
Magnifying Glass Ppt PowerPoint Presentation Styles
This is a magnifying glass ppt powerpoint presentation styles. This is a four stage process. The stages in this process are arrows, magnifier, marketing, analysis, search, business, management.
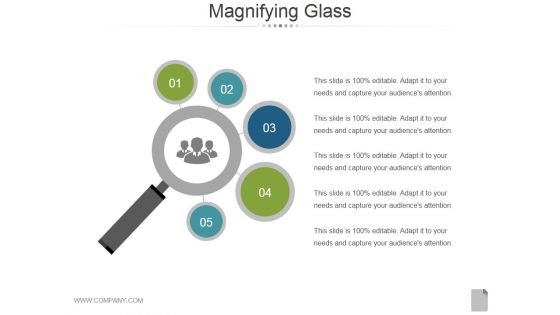
Magnifying Glass Ppt PowerPoint Presentation Rules
This is a magnifying glass ppt powerpoint presentation rules. This is a five stage process. The stages in this process are magnifier glass, search, analysis, marketing, success.
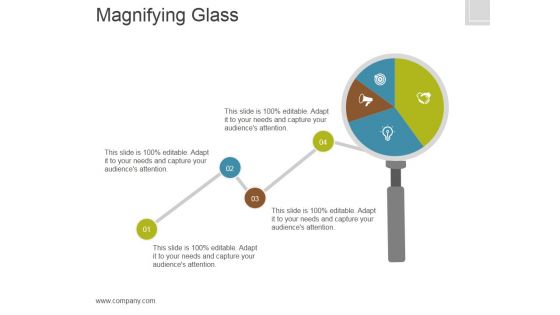
Magnifying Glass Ppt PowerPoint Presentation Professional
This is a magnifying glass ppt powerpoint presentation professional. This is a four stage process. The stages in this process are icons, process, business, marketing, analysis.
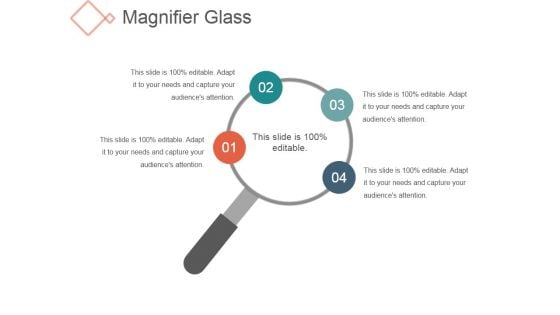
Magnifier Glass Ppt PowerPoint Presentation Layout
This is a magnifier glass ppt powerpoint presentation layout. This is a four stage process. The stages in this process are magnifier glass, research, marketing, business, analysis.

Magnifying Glass Ppt PowerPoint Presentation Styles Structure
This is a magnifying glass ppt powerpoint presentation styles structure. This is a three stage process. The stages in this process are magnifier glass, search, marketing, analysis, business.
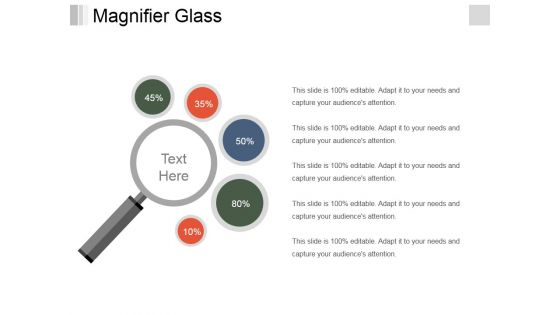
Magnifier Glass Ppt PowerPoint Presentation Outline Smartart
This is a magnifier glass ppt powerpoint presentation outline smartart. This is a one stage process. The stages in this process are magnifier, search, marketing, analysis, business.

Magnifying Glass Ppt PowerPoint Presentation Professional Deck
This is a magnifying glass ppt powerpoint presentation professional deck. This is a one stage process. The stages in this process are business, strategy, analysis, pretention, magnifying glass.

Case Study Ppt PowerPoint Presentation Slides Diagrams
This is a case study ppt powerpoint presentation slides diagrams. This is a one stage process. The stages in this process are magnify, search, technology, study, analysis.
Magnifying Glass Ppt PowerPoint Presentation Slides Styles
This is a magnifying glass ppt powerpoint presentation slides styles. This is a one stage process. The stages in this process are magnifier glass, search, marketing, analysis, business.
Analysis For Strategic Account Plan Icon Ppt Example SS
This slide mentions key features and advantages of using power bi tool. The purpose of this slide is to transform the business data into meaningful data in form of interactive charts, graphs, reports and dashboards. It helps organization to find insights and embed them in the application or website for accessing data on go. Boost your pitch with our creative Analysis For Strategic Account Plan Icon Ppt Example SS Deliver an awe-inspiring pitch that will mesmerize everyone. Using these presentation templates you will surely catch everyones attention. You can browse the ppts collection on our website. We have researchers who are experts at creating the right content for the templates. So you do not have to invest time in any additional work. Just grab the template now and use them. This slide mentions key features and advantages of using power bi tool. The purpose of this slide is to transform the business data into meaningful data in form of interactive charts, graphs, reports and dashboards. It helps organization to find insights and embed them in the application or website for accessing data on go.
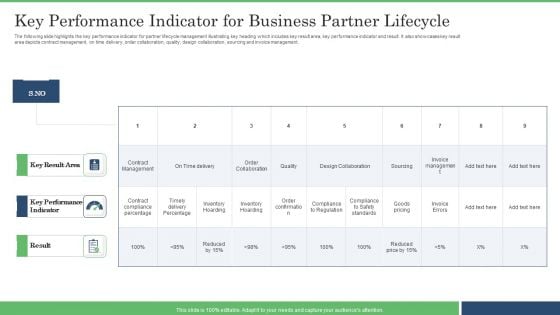
Key Performance Indicator For Business Partner Lifecycle Brochure PDF
The following slide highlights the key performance indicator for partner lifecycle management illustrating key heading which includes key result area, key performance indicator and result. It also showcases key result area depicts contract management, on time delivery, order collaboration, quality, design collaboration, sourcing and invoice management. Showcasing this set of slides titled Key Performance Indicator For Business Partner Lifecycle Brochure PDF. The topics addressed in these templates are Key Performance Indicator, Inventory Hoarding, Design Collaboration. All the content presented in this PPT design is completely editable. Download it and make adjustments in color, background, font etc. as per your unique business setting.
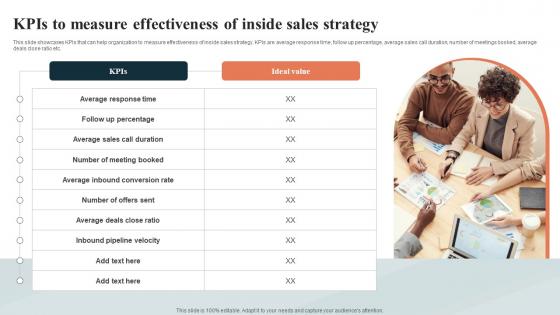
Telesales Strategy For Targeting Kpis To Measure Effectiveness Of Inside Sales Strategy SS V
This slide showcases KPIs that can help organization to measure effectiveness of inside sales strategy. KPIs are average response time, follow up percentage, average sales call duration, number of meetings booked, average deals close ratio etc. This Telesales Strategy For Targeting Kpis To Measure Effectiveness Of Inside Sales Strategy SS V is perfect for any presentation, be it in front of clients or colleagues. It is a versatile and stylish solution for organizing your meetings. The Telesales Strategy For Targeting Kpis To Measure Effectiveness Of Inside Sales Strategy SS V features a modern design for your presentation meetings. The adjustable and customizable slides provide unlimited possibilities for acing up your presentation. Slidegeeks has done all the homework before launching the product for you. So, do not wait, grab the presentation templates today This slide showcases KPIs that can help organization to measure effectiveness of inside sales strategy. KPIs are average response time, follow up percentage, average sales call duration, number of meetings booked, average deals close ratio etc.
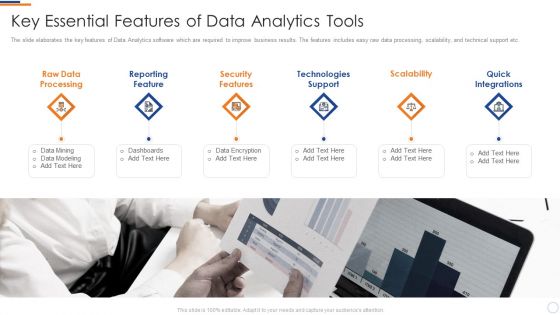
Business Intelligence And Big Key Essential Features Of Data Analytics Tools Topics PDF
The slide elaborates the key features of Data Analytics software which are required to improve business results. The features includes easy raw data processing, scalability, and technical support etc. This is a business intelligence and big key essential features of data analytics tools topics pdf template with various stages. Focus and dispense information on six stages using this creative set, that comes with editable features. It contains large content boxes to add your information on topics like raw data processing, reporting feature, security features, technologies support, scalability quick integrations. You can also showcase facts, figures, and other relevant content using this PPT layout. Grab it now.
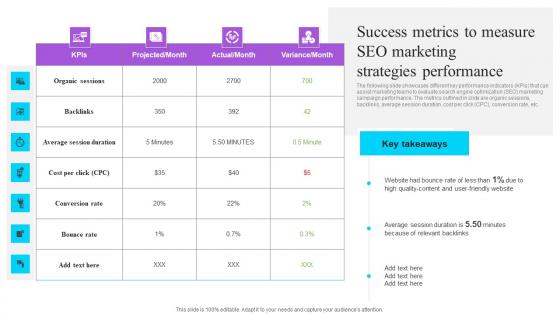
Success Metrics To Measure Seo Marketing Strategies Performance Effective GTM Techniques Brochure PDF
The following slide showcases different key performance indicators KPIs that can assist marketing teams to evaluate search engine optimization SEO marketing campaign performance. The metrics outlined in slide are organic sessions, backlinks, average session duration, cost per click CPC, conversion rate, etc. Do you have an important presentation coming up Are you looking for something that will make your presentation stand out from the rest Look no further than Success Metrics To Measure Seo Marketing Strategies Performance Effective GTM Techniques Brochure PDF. With our professional designs, you can trust that your presentation will pop and make delivering it a smooth process. And with Slidegeeks, you can trust that your presentation will be unique and memorable. So why wait Grab Success Metrics To Measure Seo Marketing Strategies Performance Effective GTM Techniques Brochure PDF today and make your presentation stand out from the rest The following slide showcases different key performance indicators KPIs that can assist marketing teams to evaluate search engine optimization SEO marketing campaign performance. The metrics outlined in slide are organic sessions, backlinks, average session duration, cost per click CPC, conversion rate, etc.
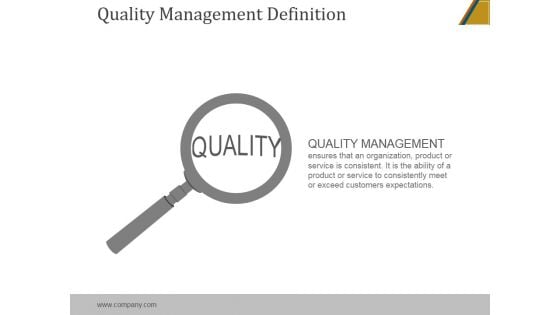
Quality Management Definition Ppt PowerPoint Presentation Clipart
This is a quality management definition ppt powerpoint presentation clipart. This is a one stage process. The stages in this process are quality management, magnifier, search, marketing, analysis, business.
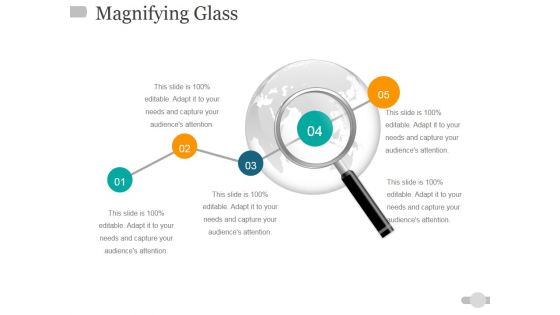
Magnifying Glass Ppt PowerPoint Presentation Ideas Design Ideas
This is a magnifying glass ppt powerpoint presentation ideas design ideas. This is a five stage process. The stages in this process are magnifying glass, analysis, success, strategy, process.

Product Analytics Implementation For Enhanced Business Insights Data Analytics V
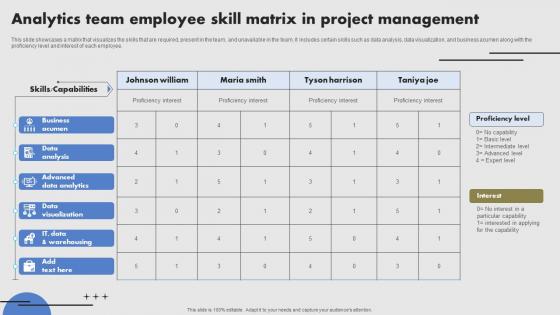
Analytics Team Employee Skill Matrix In Project Management Infographics Pdf
This slide showcases a matrix that visualizes the skills that are required, present in the team, and unavailable in the team. It includes certain skills such as data analysis, data visualization, and business acumen along with the proficiency level and interest of each employee. Showcasing this set of slides titled Analytics Team Employee Skill Matrix In Project Management Infographics Pdf. The topics addressed in these templates are Data Analysis, Advanced Data Analytics. All the content presented in this PPT design is completely editable. Download it and make adjustments in color, background, font etc. as per your unique business setting. This slide showcases a matrix that visualizes the skills that are required, present in the team, and unavailable in the team. It includes certain skills such as data analysis, data visualization, and business acumen along with the proficiency level and interest of each employee.
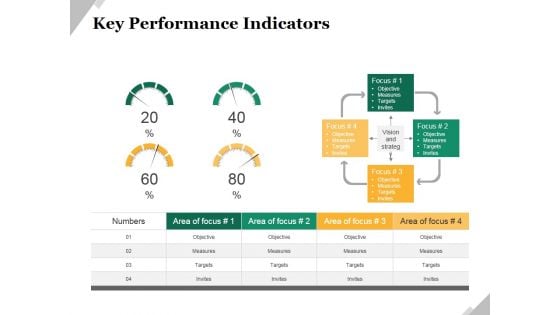
Key Performance Indicators Template 2 Ppt PowerPoint Presentation Model Example
This is a key performance indicators template 2 ppt powerpoint presentation model example. This is a four stage process. The stages in this process are objective, measures, targets, invites, indicators.

Strategic Marketing For Hair And Beauty Salon To Increase Dashboard Monitoring Sales Slides PDF
This slide presents a dashboard tracking revenue and sales by products and services. It includes KPIs such as revenue by service and products, units sold, monthly revenue. Make sure to capture your audiences attention in your business displays with our gratis customizable Strategic Marketing For Hair And Beauty Salon To Increase Dashboard Monitoring Sales Slides PDF. These are great for business strategies, office conferences, capital raising or task suggestions. If you desire to acquire more customers for your tech business and ensure they stay satisfied, create your own sales presentation with these plain slides.
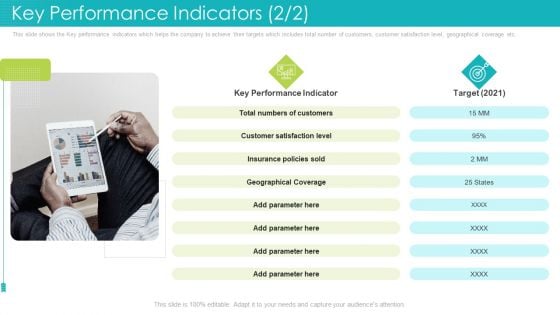
Key Performance Indicators Satisfaction Level Ppt File Deck PDF
This slide shows the Key performance indicators which helps the company to achieve their targets which includes total number of customers, customer satisfaction level, geographical coverage etc. Deliver an awe inspiring pitch with this creative key performance indicators satisfaction level ppt file deck pdf bundle. Topics like key performance indicator, customer satisfaction level, geographical coverage, target can be discussed with this completely editable template. It is available for immediate download depending on the needs and requirements of the user.
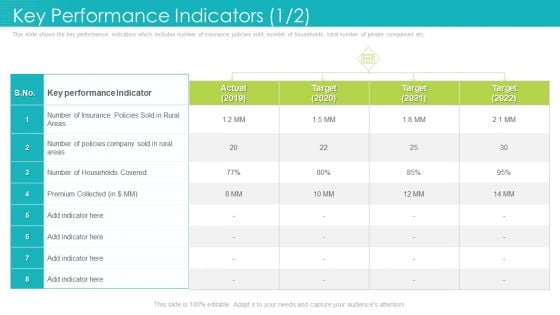
Key Performance Indicators Target Ppt File Graphics Download PDF
This slide shows the key performance indicators which includes number of insurance policies sold, number of households, total number of private companies etc. Deliver and pitch your topic in the best possible manner with this key performance indicators target ppt file graphics download pdf. Use them to share invaluable insights on key performance indicators, 2019 to 2022 and impress your audience. This template can be altered and modified as per your expectations. So, grab it now.
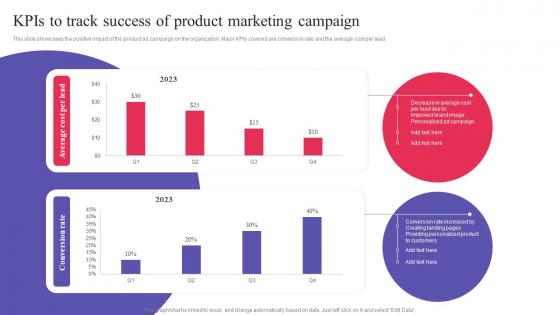
KPIs To Track Success Of Product Marketing Digital Promotional Campaign Demonstration Pdf
This slide showcases the positive impact of the product ad campaign on the organization. Major KPIs covered are conversion rate and the average cost per lead. Welcome to our selection of the KPIs To Track Success Of Product Marketing Digital Promotional Campaign Demonstration Pdf. These are designed to help you showcase your creativity and bring your sphere to life. Planning and Innovation are essential for any business that is just starting out. This collection contains the designs that you need for your everyday presentations. All of our PowerPoints are 100 percent editable, so you can customize them to suit your needs. This multi-purpose template can be used in various situations. Grab these presentation templates today. This slide showcases the positive impact of the product ad campaign on the organization. Major KPIs covered are conversion rate and the average cost per lead.
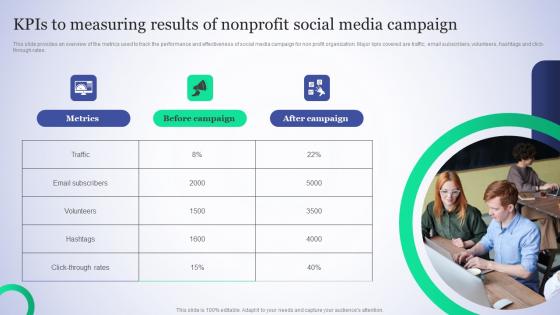
Kpis To Measuring Results Of Nonprofit Charitable Social Media Advertising Elements Pdf
This slide provides an overview of the metrics used to track the performance and effectiveness of social media campaign for non profit organization. Major kpis covered are traffic, email subscribers, volunteers, hashtags and click-through rates. Want to ace your presentation in front of a live audience Our Kpis To Measuring Results Of Nonprofit Charitable Social Media Advertising Elements Pdf can help you do that by engaging all the users towards you. Slidegeeks experts have put their efforts and expertise into creating these impeccable powerpoint presentations so that you can communicate your ideas clearly. Moreover, all the templates are customizable, and easy-to-edit and downloadable. Use these for both personal and commercial use. This slide provides an overview of the metrics used to track the performance and effectiveness of social media campaign for non profit organization. Major kpis covered are traffic, email subscribers, volunteers, hashtags and click-through rates.
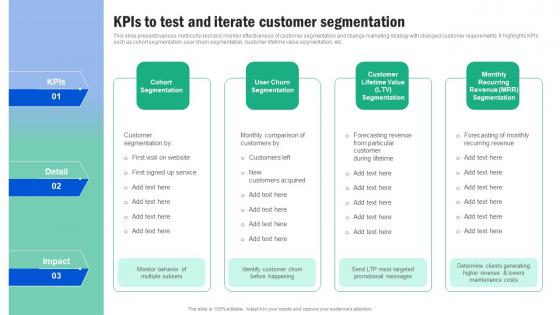
Kpis To Test And Iterate Customer Segmentation Guide For Segmenting And Formulating Summary Pdf
This slide presents various metrics for test and monitor effectiveness of customer segmentation and change marketing strategy with changed customer requirements. It highlights KPIs such as cohort segmentation, user churn segmentation, customer lifetime value segmentation, etc Slidegeeks is one of the best resources for PowerPoint templates. You can download easily and regulate Kpis To Test And Iterate Customer Segmentation Guide For Segmenting And Formulating Summary Pdf for your personal presentations from our wonderful collection. A few clicks is all it takes to discover and get the most relevant and appropriate templates. Use our Templates to add a unique zing and appeal to your presentation and meetings. All the slides are easy to edit and you can use them even for advertisement purposes. This slide presents various metrics for test and monitor effectiveness of customer segmentation and change marketing strategy with changed customer requirements. It highlights KPIs such as cohort segmentation, user churn segmentation, customer lifetime value segmentation, etc
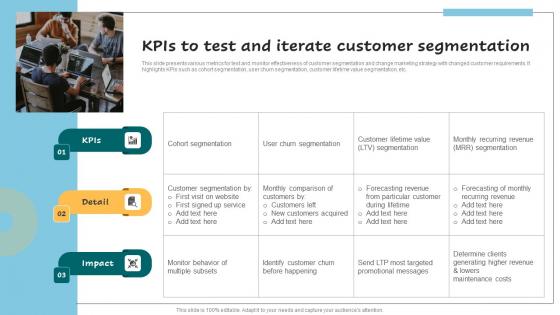
KPIs To Test And Iterate Customer Segmentation Successful Guide For Market Segmentation Graphics Pdf
This slide presents various metrics for test and monitor effectiveness of customer segmentation and change marketing strategy with changed customer requirements. It highlights KPIs such as cohort segmentation, user churn segmentation, customer lifetime value segmentation, etc. Find a pre-designed and impeccable KPIs To Test And Iterate Customer Segmentation Successful Guide For Market Segmentation Graphics Pdf. The templates can ace your presentation without additional effort. You can download these easy-to-edit presentation templates to make your presentation stand out from others. So, what are you waiting for Download the template from Slidegeeks today and give a unique touch to your presentation. This slide presents various metrics for test and monitor effectiveness of customer segmentation and change marketing strategy with changed customer requirements. It highlights KPIs such as cohort segmentation, user churn segmentation, customer lifetime value segmentation, etc.

Different KPIS To Measure Effectiveness Of Customer Customer Service Training Ppt Template
This slide mentions the various metrics used to measure the impacts of customer services training. Various KPIs included are CSAT score, average response time, FCR rate and CES score Are you in need of a template that can accommodate all of your creative concepts This one is crafted professionally and can be altered to fit any style. Use it with Google Slides or PowerPoint. Include striking photographs, symbols, depictions, and other visuals. Fill, move around, or remove text boxes as desired. Test out color palettes and font mixtures. Edit and save your work, or work with colleagues. Download Different KPIS To Measure Effectiveness Of Customer Customer Service Training Ppt Template and observe how to make your presentation outstanding. Give an impeccable presentation to your group and make your presentation unforgettable. This slide mentions the various metrics used to measure the impacts of customer services training. Various KPIs included are CSAT score, average response time, FCR rate and CES score
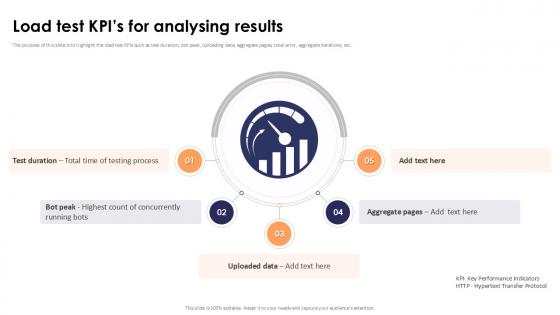
Load Test Kpis For Analysing Results Stress Testing For Robust Ppt Presentation
The purpose of this slide is to highlight the load test KPIs such as test duration, bot peak, uploading data, aggregate pages, total error, aggregate iterations, etc. Present like a pro with Load Test Kpis For Analysing Results Stress Testing For Robust Ppt Presentation Create beautiful presentations together with your team, using our easy-to-use presentation slides. Share your ideas in real-time and make changes on the fly by downloading our templates. So whether you are in the office, on the go, or in a remote location, you can stay in sync with your team and present your ideas with confidence. With Slidegeeks presentation got a whole lot easier. Grab these presentations today. The purpose of this slide is to highlight the load test KPIs such as test duration, bot peak, uploading data, aggregate pages, total error, aggregate iterations, etc.
KPIs And Metrics To Measure Pharmaceutical Drug Of Pharmaceutical Company Icons PDF
Mentioned slide showcases various key performance indicators KPIs which can be used to measure the development of pharmaceutical companies in different years. The key metrics are productivity, competency, quality of care and financial. Showcasing this set of slides titled KPIs And Metrics To Measure Pharmaceutical Drug Of Pharmaceutical Company Icons PDF. The topics addressed in these templates are Productivity, Competency, Quality Of Care. All the content presented in this PPT design is completely editable. Download it and make adjustments in color, background, font etc. as per your unique business setting.
Key Performance Indicators For Business Powerpoint Slide Background Designs
This is a key performance indicators for business powerpoint slide background designs. This is a five stage process. The stages in this process are kpi.

Company Key Performance Indicators Table Sample Of Ppt
This is a company key performance indicators table sample of ppt. This is a ten stage process. The stages in this process are business, marketing, management.
Key Performance Indicators For Analysis Powerpoint Slide Backgrounds
This is a key performance indicators for analysis powerpoint slide backgrounds. This is a nine stage process. The stages in this process are business, marketing, management.
Key Performance Indicators For Company Success Powerpoint Slide Background Designs
This is a key performance indicators for company success powerpoint slide background designs. This is a five stage process. The stages in this process are kpi.
Financial Key Performance Indicators Table Powerpoint Slide Deck
This is a financial key performance indicators table powerpoint slide deck. This is a six stage process. The stages in this process are business, strategy, marketing, success, table.

Key Performance Indicators Template 3 Ppt PowerPoint Presentation Samples
This is a key performance indicators template 3 ppt powerpoint presentation samples. This is a four stage process. The stages in this process are objective, measures, targets, invites.
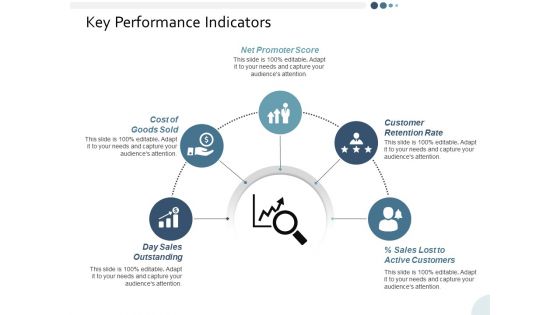
Key Performance Indicators Ppt PowerPoint Presentation Gallery Gridlines
This is a key performance indicators ppt powerpoint presentation gallery gridlines. This is a five stage process. The stages in this process are business, management, strategy, analysis, icons.
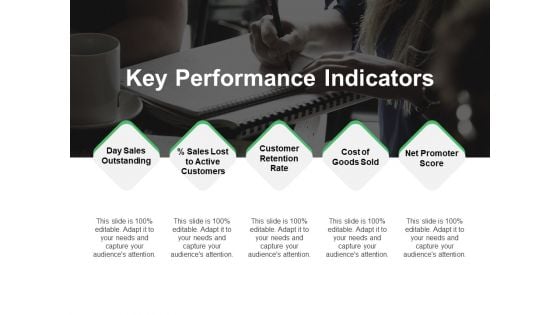
Key Performance Indicators Ppt PowerPoint Presentation Ideas Professional
This is a key performance indicators ppt powerpoint presentation ideas professional. This is a five stage process. The stages in this process are marketing, business, management, planning, strategy.


 Continue with Email

 Home
Home


