Snapshot
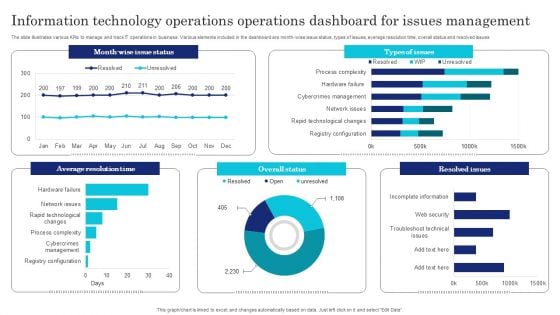
Information Technology Operations Operations Dashboard For Issues Management Infographics PDF
The slide illustrates various KPIs to manage and track IT operations in business. Various elements included in the dashboard are month-wise issue status, types of issues, average resolution time, overall status and resolved issues. Showcasing this set of slides titled Information Technology Operations Operations Dashboard For Issues Management Infographics PDF. The topics addressed in these templates are Information Technology Operations, Operations Dashboard, Issues Management. All the content presented in this PPT design is completely editable. Download it and make adjustments in color, background, font etc. as per your unique business setting.
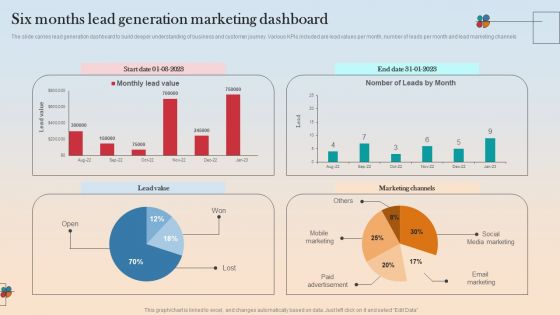
Six Months Lead Generation Marketing Dashboard Inspiration PDF
The slide carries lead generation dashboard to build deeper understanding of business and customer journey. Various KPIs included are lead values per month, number of leads per month and lead marketing channels. Showcasing this set of slides titled Six Months Lead Generation Marketing Dashboard Inspiration PDF. The topics addressed in these templates are Six Months Lead Generation, Marketing Dashboard. All the content presented in this PPT design is completely editable. Download it and make adjustments in color, background, font etc. as per your unique business setting.
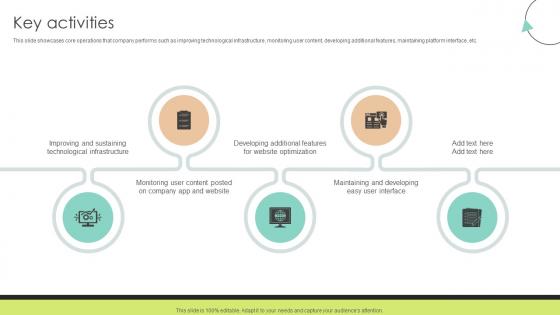
Key Activities Community Networking Platform Business Model
This slide showcases core operations that company performs such as improving technological infrastructure, monitoring user content, developing additional features, maintaining platform interface, etc. Get a simple yet stunning designed Key Activities Community Networking Platform Business Model. It is the best one to establish the tone in your meetings. It is an excellent way to make your presentations highly effective. So, download this PPT today from Slidegeeks and see the positive impacts. Our easy-to-edit Key Activities Community Networking Platform Business Model can be your go-to option for all upcoming conferences and meetings. So, what are you waiting for Grab this template today. This slide showcases core operations that company performs such as improving technological infrastructure, monitoring user content, developing additional features, maintaining platform interface, etc.
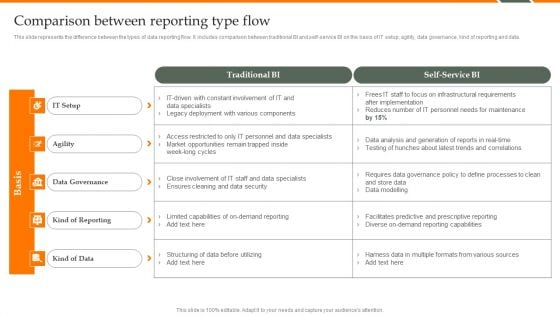
Human Resource Analytics Comparison Between Reporting Type Flow Demonstration PDF
This slide represents the difference between the types of data reporting flow. It includes comparison between traditional BI and self-service BI on the basis of IT setup, agility, data governance, kind of reporting and data. If your project calls for a presentation, then Slidegeeks is your go-to partner because we have professionally designed, easy-to-edit templates that are perfect for any presentation. After downloading, you can easily edit Human Resource Analytics Comparison Between Reporting Type Flow Demonstration PDF and make the changes accordingly. You can rearrange slides or fill them with different images. Check out all the handy templates.
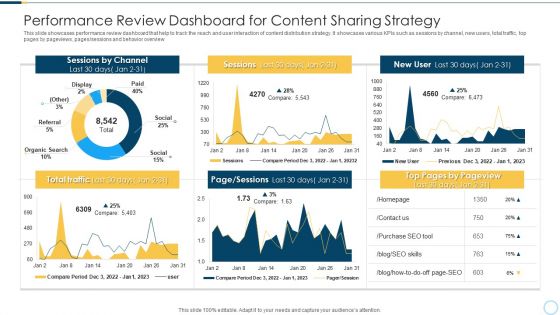
Performance Review Dashboard For Content Sharing Strategy Designs PDF
This slide showcases performance review dashboard that help to track the reach and user interaction of content distribution strategy. It showcases various KPIs such as sessions by channel, new users, total traffic, top pages by pageviews, pages or sessions and behavior overview Showcasing this set of slides titled performance review dashboard for content sharing strategy designs pdf. The topics addressed in these templates are performance review dashboard for content sharing strategy. All the content presented in this PPT design is completely editable. Download it and make adjustments in color, background, font etc. as per your unique business setting.
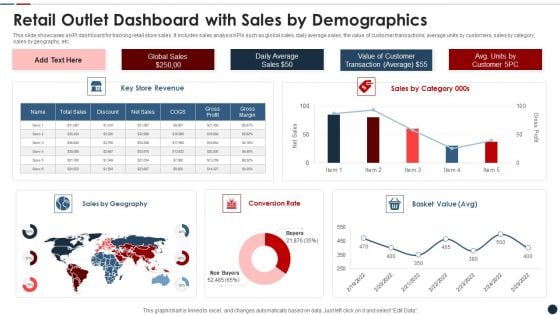
Retail Outlet Dashboard With Sales By Demographics Slides PDF
This slide showcases a KPI dashboard for tracking retail store sales. It includes sales analysis KPIs such as global sales, daily average sales, the value of customer transactions, average units by customers, sales by category, sales by geography, etc. Showcasing this set of slides titled retail outlet dashboard with sales by demographics slides pdf The topics addressed in these templates are Retail outlet dashboard with sales by demographics All the content presented in this PPT design is completely editable. Download it and make adjustments in color, background, font etc. as per your unique business setting.
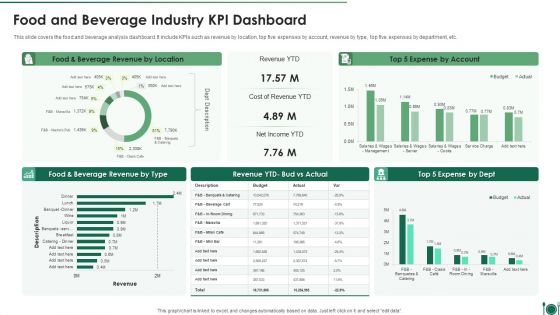
Food And Beverage Industry Kpi Dashboard Professional PDF
This slide covers the food and beverage analysis dashboard. It include KPIs such as revenue by location, top five expenses by account, revenue by type, top five expenses by department, etc.Showcasing this set of slides titled Food And Beverage Industry Kpi Dashboard Professional PDF. The topics addressed in these templates are Food And Beverage Industry KPI Dashboard. All the content presented in this PPT design is completely editable. Download it and make adjustments in color, background, font etc. as per your unique business setting
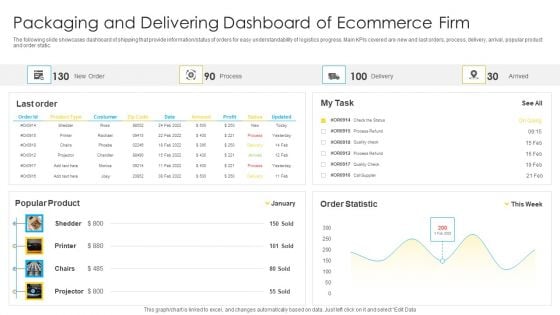
Packaging And Delivering Dashboard Of Ecommerce Firm Slides PDF
The following slide showcases dashboard of shipping that provide information or status of orders for easy understandability of logistics progress. Main KPIs covered are new and last orders, process, delivery, arrival, popular product and order static. Showcasing this set of slides titled Packaging And Delivering Dashboard Of Ecommerce Firm Slides PDF. The topics addressed in these templates are Packaging And Delivering, Dashboard Ecommerce Firm. All the content presented in this PPT design is completely editable. Download it and make adjustments in color, background, font etc. as per your unique business setting.
New Staff Onboarding Process KPI Tracking Dashboard Inspiration PDF
This slide showcase the KPI dashboard for tracking new hire onboarding completion progress. It includes KPIs such as onboarding completion status, employees per office, progress chart, hires starting in current and next week. Showcasing this set of slides titled New Staff Onboarding Process KPI Tracking Dashboard Inspiration PDF. The topics addressed in these templates are New Staff Onboarding Process, KPI Tracking Dashboard. All the content presented in this PPT design is completely editable. Download it and make adjustments in color, background, font etc. as per your unique business setting.
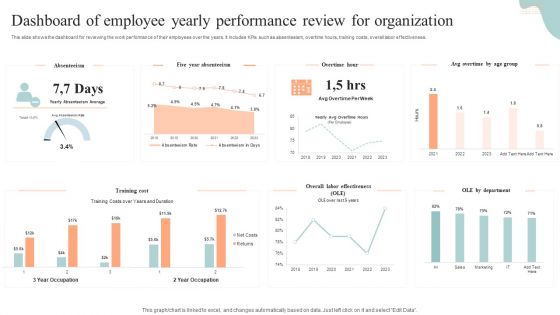
Dashboard Of Employee Yearly Performance Review For Organization Mockup PDF
This slide shows the dashboard for reviewing the work performance of their employees over the years. It includes KPIs such as absenteeism, overtime hours, training costs, overall labor effectiveness. Showcasing this set of slides titled Dashboard Of Employee Yearly Performance Review For Organization Mockup PDF. The topics addressed in these templates are Dashboard Of Employee, Yearly Performance, Review For Organization. All the content presented in this PPT design is completely editable. Download it and make adjustments in color, background, font etc. as per your unique business setting.
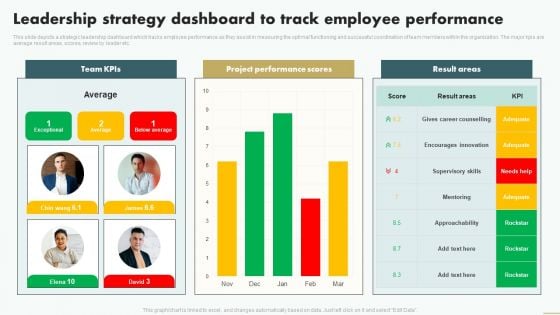
Leadership Strategy Dashboard To Track Employee Performance Brochure PDF
This slide depicts a strategic leadership dashboard which tracks employee performance as they assist in measuring the optimal functioning and successful coordination of team members within the organization. The major kpis are average result areas, scores, review by leader etc. Showcasing this set of slides titled Leadership Strategy Dashboard To Track Employee Performance Brochure PDF. The topics addressed in these templates are Leadership Strategy Dashboard, Track Employee Performance. All the content presented in this PPT design is completely editable. Download it and make adjustments in color, background, font etc. as per your unique business setting.
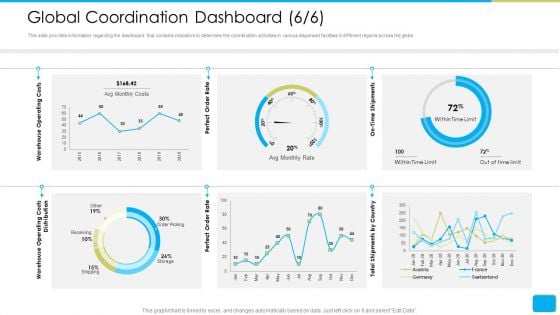
Cross Border Integration In Multinational Corporation Global Coordination Dashboard Costs Topics PDF
This slide provides information regarding the dashboard that contains indicators to determine the coordination activities in various dispersed facilities in different regions across the globe. Deliver and pitch your topic in the best possible manner with this cross border integration in multinational corporation global coordination dashboard costs topics pdf. Use them to share invaluable insights on perfect order rate, on time shipments, total shipments country, warehouse operating costs distribution, warehouse operating costs and impress your audience. This template can be altered and modified as per your expectations. So, grab it now.
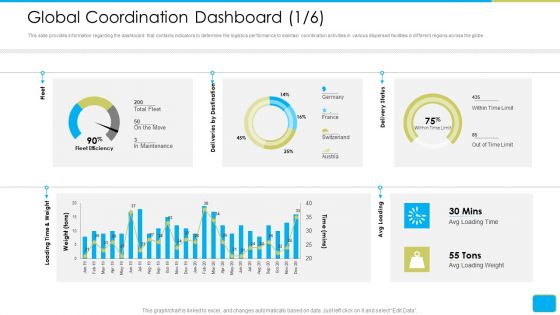
Cross Border Integration In Multinational Corporation Global Coordination Dashboard Download PDF
This slide provides information regarding the dashboard that contains indicators to determine the logistics performance to maintain coordination activities in various dispersed facilities in different regions across the globe. Deliver an awe-inspiring pitch with this creative cross border integration in multinational corporation global coordination dashboard download pdf bundle. Topics like loading time and weight, delivery status, avg loading, avg loading time, avg loading weight, time limit can be discussed with this completely editable template. It is available for immediate download depending on the needs and requirements of the user.
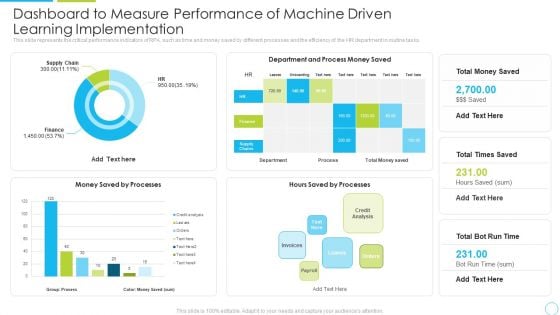
Dashboard To Measure Performance Of Machine Driven Learning Implementation Ppt Gallery Gridlines PDF
This slide represents the critical performance indicators of RPA, such as time and money saved by different processes and the efficiency of the HR department in routine tasks. Deliver an awe inspiring pitch with this creative dashboard to measure performance of machine driven learning implementation ppt gallery gridlines pdf bundle. Topics like dashboard to measure performance of machine driven learning implementation can be discussed with this completely editable template. It is available for immediate download depending on the needs and requirements of the user.
Dashboard For Tracking Employee Satisfaction Rate Ppt PowerPoint Presentation File Backgrounds PDF
This slide covers KPI dashboard to measure employee satisfaction due to effective internal communication. It includes indicators such as net promoter score, retention rate, absenteeism etc. From laying roadmaps to briefing everything in detail, our templates are perfect for you. You can set the stage with your presentation slides. All you have to do is download these easy to edit and customizable templates. Dashboard For Tracking Employee Satisfaction Rate Ppt PowerPoint Presentation File Backgrounds PDF will help you deliver an outstanding performance that everyone would remember and praise you for. Do download this presentation today.
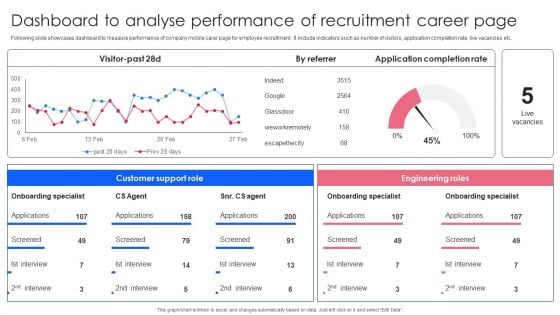
Effective Guide To Build Strong Online Hiring Strategy Dashboard To Analyse Performance Of Recruitment Download PDF
Following slide showcases dashboard to measure performance of company mobile carer page for employee recruitment . It include indicators such as number of visitors, application completion rate, live vacancies etc. Boost your pitch with our creative Effective Guide To Build Strong Online Hiring Strategy Dashboard To Analyse Performance Of Recruitment Download PDF. Deliver an awe-inspiring pitch that will mesmerize everyone. Using these presentation templates you will surely catch everyones attention. You can browse the ppts collection on our website. We have researchers who are experts at creating the right content for the templates. So you do not have to invest time in any additional work. Just grab the template now and use them.
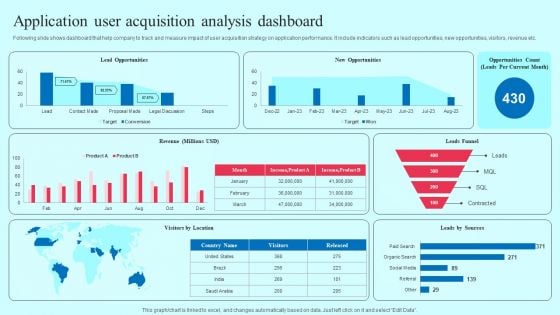
Smartphone Application User Acquisition Techniques Application User Acquisition Analysis Dashboard Information PDF
Following slide shows dashboard that help company to track and measure impact of user acquisition strategy on application performance. It include indicators such as lead opportunities, new opportunities, visitors, revenue etc. Boost your pitch with our creative Smartphone Application User Acquisition Techniques Application User Acquisition Analysis Dashboard Information PDF. Deliver an awe inspiring pitch that will mesmerize everyone. Using these presentation templates you will surely catch everyones attention. You can browse the ppts collection on our website. We have researchers who are experts at creating the right content for the templates. So you do not have to invest time in any additional work. Just grab the template now and use them.
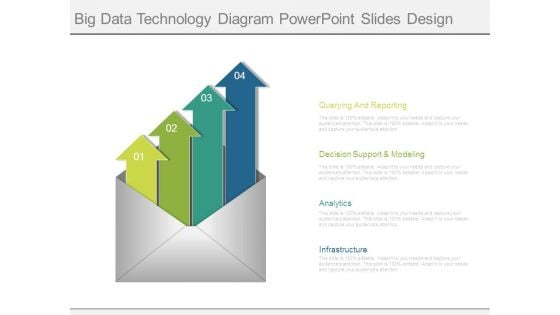
Big Data Technology Diagram Powerpoint Slides Design
This is a big data technology diagram powerpoint slides design. This is a four stage process. The stages in this process are querying and reporting, decision support and modeling, analytics, infrastructure.

Internal Promotion Strategy To Enhance Brand Awareness KPI Dashboard To Track PR Marketing Performance Ideas PDF
This slide shows dashboard which can be used by organizations to measure the results of public relation strategy. It includes metrics such as media coverage rate, social media engagement rate, share of voice and brand mentions. This modern and well arranged Internal Promotion Strategy To Enhance Brand Awareness KPI Dashboard To Track PR Marketing Performance Ideas PDF provides lots of creative possibilities. It is very simple to customize and edit with the Powerpoint Software. Just drag and drop your pictures into the shapes. All facets of this template can be edited with Powerpoint no extra software is necessary. Add your own material, put your images in the places assigned for them, adjust the colors, and then you can show your slides to the world, with an animated slide included.
Business KPI Dashboard Ppt PowerPoint Presentation Styles Deck Cpb
This is a business kpi dashboard ppt powerpoint presentation styles deck cpb. This is a four stage process. The stages in this process are business kpi dashboard.
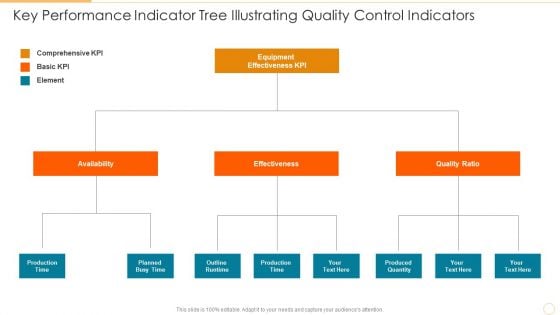
Key Performance Indicator Tree Illustrating Quality Control Indicators Information PDF
Presenting key performance indicator tree illustrating quality control indicators information pdf to dispense important information. This template comprises three stages. It also presents valuable insights into the topics including availability, effectiveness, quality ratio. This is a completely customizable PowerPoint theme that can be put to use immediately. So, download it and address the topic impactfully.
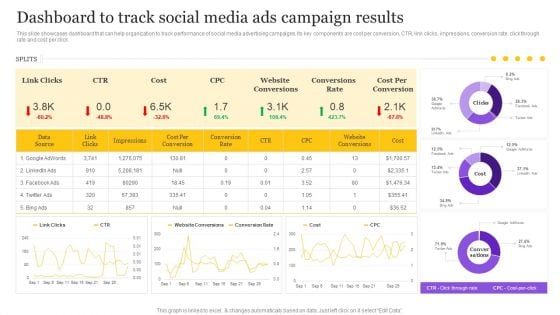
Digital Marketing Strategy Dashboard To Track Social Media Ads Campaign Results Introduction PDF
This slide showcases dashboard that can help organization to track performance of social media advertising campaigns. Its key components are cost per conversion, CTR, link clicks, impressions, conversion rate, click through rate and cost per click. The Digital Marketing Strategy Dashboard To Track Social Media Ads Campaign Results Introduction PDF is a compilation of the most recent design trends as a series of slides. It is suitable for any subject or industry presentation, containing attractive visuals and photo spots for businesses to clearly express their messages. This template contains a variety of slides for the user to input data, such as structures to contrast two elements, bullet points, and slides for written information. Slidegeeks is prepared to create an impression.

Real Time Content Marketing Result Dashboard Ppt Infographic Template Example PDF
The following slide depicts real time content marketing KPI dashboard to monitor traffic flow and manage promotional efforts. It includes elements such as visitors by channel, conversion rate, search, direct, sessions, average time engaged etc. The Real Time Content Marketing Result Dashboard Ppt Infographic Template Example PDF is a compilation of the most recent design trends as a series of slides. It is suitable for any subject or industry presentation, containing attractive visuals and photo spots for businesses to clearly express their messages. This template contains a variety of slides for the user to input data, such as structures to contrast two elements, bullet points, and slides for written information. Slidegeeks is prepared to create an impression.
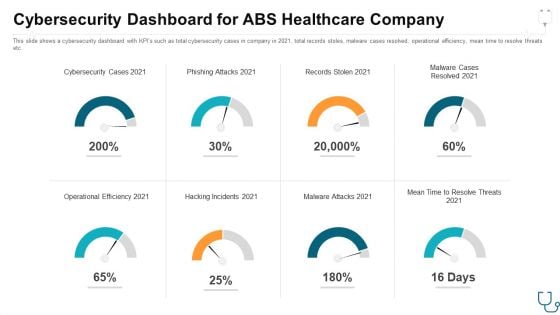
Cybersecurity Dashboard For Abs Healthcare Company Ppt Slides Gridlines PDF
This slide shows a cybersecurity dashboard with KPIs such as total cybersecurity cases in company in 2021, total records stoles, malware cases resolved, operational efficiency, mean time to resolve threats etc. Deliver and pitch your topic in the best possible manner with this cybersecurity dashboard for abs healthcare company ppt slides gridlines pdf. Use them to share invaluable insights on cybersecurity dashboard for abs healthcare company and impress your audience. This template can be altered and modified as per your expectations. So, grab it now.
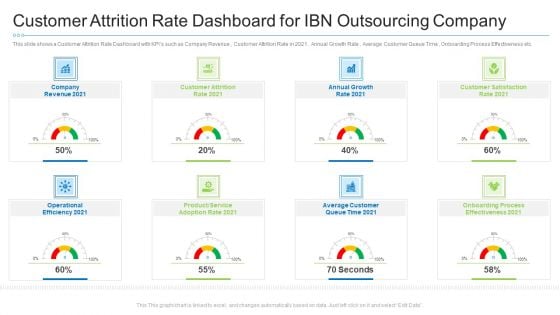
Customer Attrition Rate Dashboard For Ibn Outsourcing Company Information PDF
This slide shows a Customer Attrition Rate Dashboard with KPIs such as Company Revenue , Customer Attrition Rate in 2021 , Annual Growth Rate , Average Customer Queue Time , Onboarding Process Effectiveness etc. Deliver and pitch your topic in the best possible manner with this customer attrition rate dashboard for ibn outsourcing company information pdf. Use them to share invaluable insights on customer attrition rate dashboard for ibn outsourcing company and impress your audience. This template can be altered and modified as per your expectations. So, grab it now.
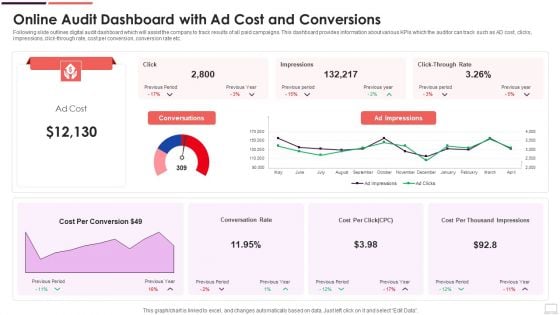
Online Audit Dashboard With Ad Cost And Conversions Themes PDF
Following slide outlines digital audit dashboard which will assist the company to track results of all paid campaigns. This dashboard provides information about various KPIs which the auditor can track such as AD cost, clicks, impressions, click through rate, cost per conversion, conversion rate etc. Pitch your topic with ease and precision using this Online Audit Dashboard With Ad Cost And Conversions Themes PDF. This layout presents information on Conversations, Impressions, Cost. It is also available for immediate download and adjustment. So, changes can be made in the color, design, graphics or any other component to create a unique layout.

Consumer Risk Assessment Dashboard Reporting Ppt Layouts Ideas PDF
This slide showcases the customer risk assessment dashboard with major kpis. It includes reporting risks summary, risk mitigation, risk profile, and detail. It also reflects the risk score and score distribution across different areas and activities. Pitch your topic with ease and precision using this Consumer Risk Assessment Dashboard Reporting Ppt Layouts Ideas PDF. This layout presents information on Risk Summary, Customer Risk Dashboard, Risk Profile. It is also available for immediate download and adjustment. So, changes can be made in the color, design, graphics or any other component to create a unique layout.
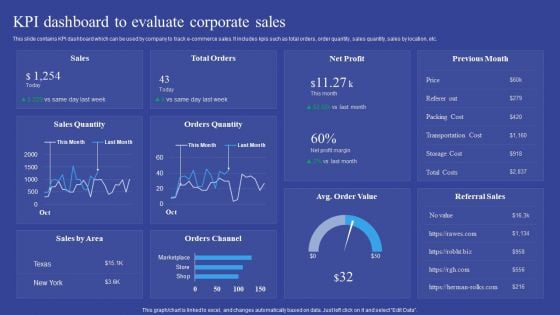
KPI Dashboard To Evaluate Corporate Sales Introduction PDF
This slide contains KPI dashboard which can be used by company to track e-commerce sales. It includes kpis such as total orders, order quantity, sales quantity, sales by location, etc. Pitch your topic with ease and precision using this KPI Dashboard To Evaluate Corporate Sales Introduction PDF. This layout presents information on KPI Dashboard, Evaluate Corporate Sales. It is also available for immediate download and adjustment. So, changes can be made in the color, design, graphics or any other component to create a unique layout.
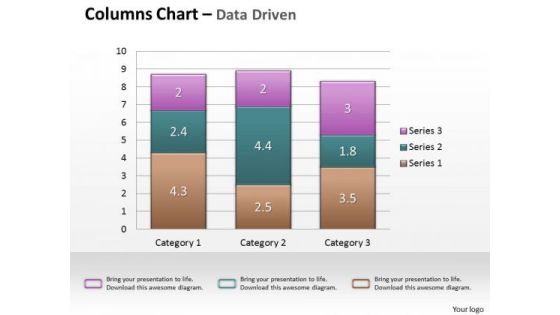
Data Analysis In Excel Column Chart For Business Analytics PowerPoint Templates
Our data analysis in excel column chart for business analytics Powerpoint Templates Heighten Concentration. Your Audience Will Be On The Edge.
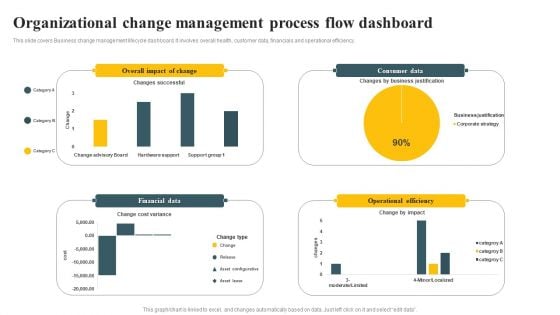
Organizational Change Management Process Flow Dashboard Ppt PowerPoint Presentation Diagram PDF
This slide covers Business change management lifecycle dashboard. It involves overall health, customer data, financials and operational efficiency. Pitch your topic with ease and precision using this Organizational Change Management Process Flow Dashboard Ppt PowerPoint Presentation Diagram PDF. This layout presents information on Financial Data, Operational Efficiency, Consumer Data. It is also available for immediate download and adjustment. So, changes can be made in the color, design, graphics or any other component to create a unique layout.
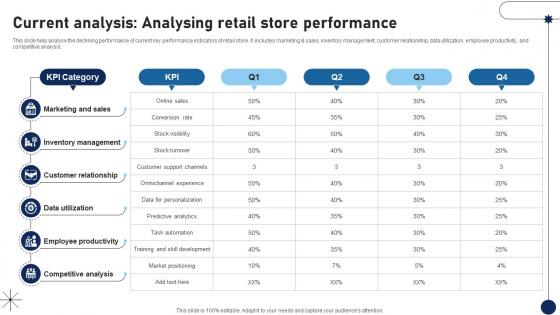
Current Analysis Analysing Retail Store Performance DT SS V
This slide help analyse the declining performance of current key performance indicators of retail store. It includes marketing and sales, inventory management, customer relationship, data utilization, employee productivity, and competitive analysis.Whether you have daily or monthly meetings, a brilliant presentation is necessary. Current Analysis Analysing Retail Store Performance DT SS V can be your best option for delivering a presentation. Represent everything in detail using Current Analysis Analysing Retail Store Performance DT SS V and make yourself stand out in meetings. The template is versatile and follows a structure that will cater to your requirements. All the templates prepared by Slidegeeks are easy to download and edit. Our research experts have taken care of the corporate themes as well. So, give it a try and see the results. This slide help analyse the declining performance of current key performance indicators of retail store. It includes marketing and sales, inventory management, customer relationship, data utilization, employee productivity, and competitive analysis.
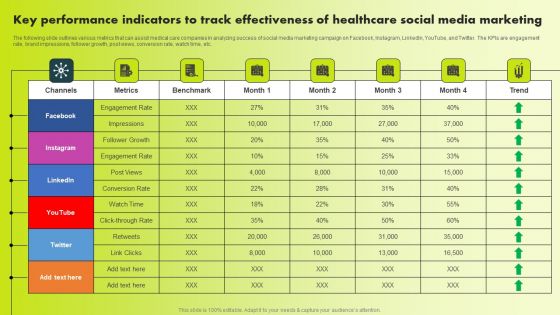
Key Performance Indicators To Track Effectiveness Of Healthcare Social Media Marketing Elements PDF
The following slide outlines various metrics that can assist medical care companies in analyzing success of social media marketing campaign on Facebook, Instagram, LinkedIn, YouTube, and Twitter. The KPIs are engagement rate, brand impressions, follower growth, post views, conversion rate, watch time, etc. Slidegeeks is here to make your presentations a breeze with Key Performance Indicators To Track Effectiveness Of Healthcare Social Media Marketing Elements PDF With our easy-to-use and customizable templates, you can focus on delivering your ideas rather than worrying about formatting. With a variety of designs to choose from, you are sure to find one that suits your needs. And with animations and unique photos, illustrations, and fonts, you can make your presentation pop. So whether you are giving a sales pitch or presenting to the board, make sure to check out Slidegeeks first
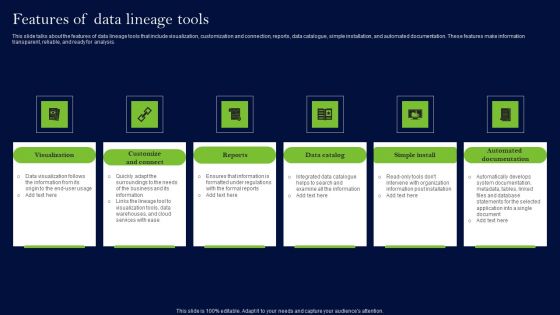
Data Lineage Methods Features Of Data Lineage Tools Sample PDF
This slide talks about the features of data lineage tools that include visualization, customization and connection, reports, data catalogue, simple installation, and automated documentation. These features make information transparent, reliable, and ready for analysis. Slidegeeks is here to make your presentations a breeze with Data Lineage Methods Features Of Data Lineage Tools Sample PDF With our easy-to-use and customizable templates, you can focus on delivering your ideas rather than worrying about formatting. With a variety of designs to choose from, you are sure to find one that suits your needs. And with animations and unique photos, illustrations, and fonts, you can make your presentation pop. So whether you are giving a sales pitch or presenting to the board, make sure to check out Slidegeeks first
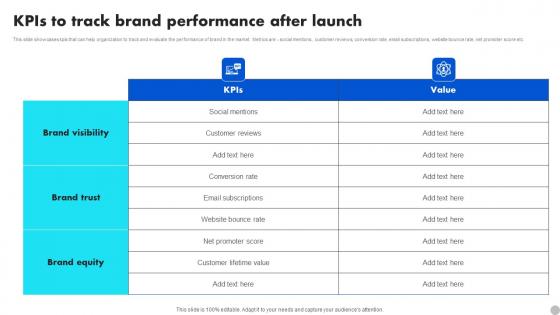
KPIS To Track Brand Performance After Launch Brand Diversification Approach Elements Pdf
This slide showcases kpis that can help organization to track and evaluate the performance of brand in the market. Metrics are social mentions, customer reviews, conversion rate, email subscriptions, website bounce rate, net promoter score etc. The KPIS To Track Brand Performance After Launch Brand Diversification Approach Elements Pdf is a compilation of the most recent design trends as a series of slides. It is suitable for any subject or industry presentation, containing attractive visuals and photo spots for businesses to clearly express their messages. This template contains a variety of slides for the user to input data, such as structures to contrast two elements, bullet points, and slides for written information. Slidegeeks is prepared to create an impression. This slide showcases kpis that can help organization to track and evaluate the performance of brand in the market. Metrics are social mentions, customer reviews, conversion rate, email subscriptions, website bounce rate, net promoter score etc.
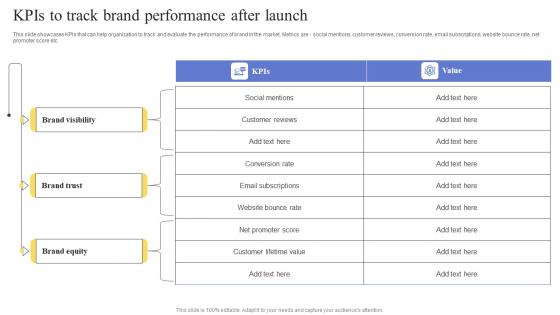
KPIS To Track Brand Performance After Launch Maximizing Revenue Using Demonstration Pdf
This slide showcases KPIs that can help organization to track and evaluate the performance of brand in the market. Metrics are - social mentions, customer reviews, conversion rate, email subscriptions, website bounce rate, net promoter score etc. The KPIS To Track Brand Performance After Launch Maximizing Revenue Using Demonstration Pdf is a compilation of the most recent design trends as a series of slides. It is suitable for any subject or industry presentation, containing attractive visuals and photo spots for businesses to clearly express their messages. This template contains a variety of slides for the user to input data, such as structures to contrast two elements, bullet points, and slides for written information. Slidegeeks is prepared to create an impression. This slide showcases KPIs that can help organization to track and evaluate the performance of brand in the market. Metrics are - social mentions, customer reviews, conversion rate, email subscriptions, website bounce rate, net promoter score etc.
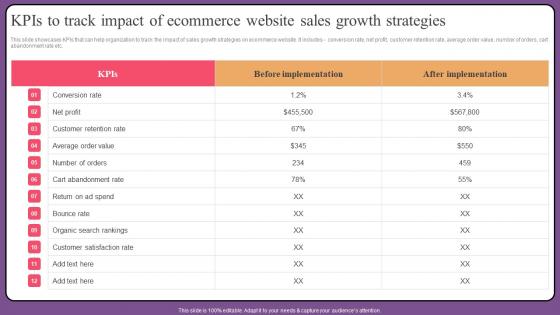
KPIs To Track Impact Of Ecommerce Website Sales Growth Strategies Rules Pdf
This slide showcases KPIs that can help organization to track the impact of sales growth strategies on ecommerce website. It includes conversion rate, net profit, customer retention rate, average order value, number of orders, cart abandonment rate etc. The KPIs To Track Impact Of Ecommerce Website Sales Growth Strategies Rules Pdf is a compilation of the most recent design trends as a series of slides. It is suitable for any subject or industry presentation, containing attractive visuals and photo spots for businesses to clearly express their messages. This template contains a variety of slides for the user to input data, such as structures to contrast two elements, bullet points, and slides for written information. Slidegeeks is prepared to create an impression. This slide showcases KPIs that can help organization to track the impact of sales growth strategies on ecommerce website. It includes conversion rate, net profit, customer retention rate, average order value, number of orders, cart abandonment rate etc.
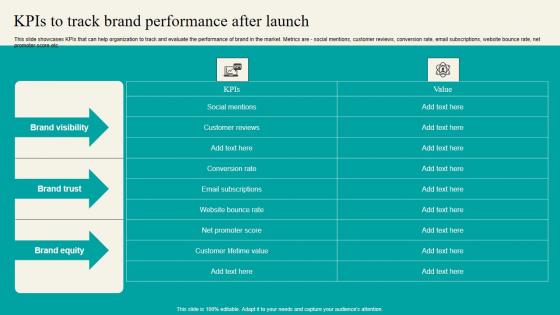
Kpis To Track Brand Performance After Launch Strategic Marketing Plan Summary PDF
This slide showcases KPIs that can help organization to track and evaluate the performance of brand in the market. Metrics are - social mentions, customer reviews, conversion rate, email subscriptions, website bounce rate, net promoter score etc. The Kpis To Track Brand Performance After Launch Strategic Marketing Plan Summary PDF is a compilation of the most recent design trends as a series of slides. It is suitable for any subject or industry presentation, containing attractive visuals and photo spots for businesses to clearly express their messages. This template contains a variety of slides for the user to input data, such as structures to contrast two elements, bullet points, and slides for written information. Slidegeeks is prepared to create an impression. This slide showcases KPIs that can help organization to track and evaluate the performance of brand in the market. Metrics are - social mentions, customer reviews, conversion rate, email subscriptions, website bounce rate, net promoter score etc.

University Marketing Guide Set Kpis To Monitor And Review Marketing Performance Strategy SS V
The following slide depicts some KPIs to analyse university marketing performance and determine deviations. It includes elements such as enrolments, retention rate, student satisfaction, cost per acquisition, revenue per student etc. Slidegeeks is here to make your presentations a breeze with University Marketing Guide Set Kpis To Monitor And Review Marketing Performance Strategy SS V With our easy-to-use and customizable templates, you can focus on delivering your ideas rather than worrying about formatting. With a variety of designs to choose from, you are sure to find one that suits your needs. And with animations and unique photos, illustrations, and fonts, you can make your presentation pop. So whether you are giving a sales pitch or presenting to the board, make sure to check out Slidegeeks first The following slide depicts some KPIs to analyse university marketing performance and determine deviations. It includes elements such as enrolments, retention rate, student satisfaction, cost per acquisition, revenue per student etc.
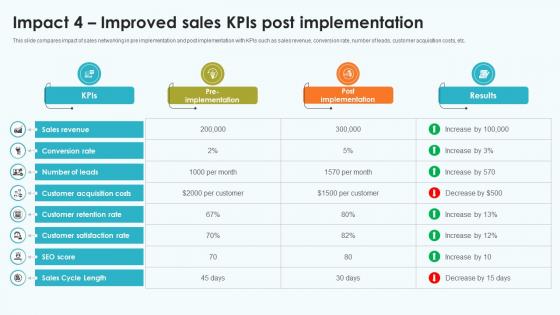
Elevating Sales Networks Impact 4 Improved Sales Kpis Post Implementation SA SS V
This slide compares impact of sales networking in pre implementation and post implementation with KPIs such as sales revenue, conversion rate, number of leads, customer acquisition costs, etc. The Elevating Sales Networks Impact 4 Improved Sales Kpis Post Implementation SA SS V is a compilation of the most recent design trends as a series of slides. It is suitable for any subject or industry presentation, containing attractive visuals and photo spots for businesses to clearly express their messages. This template contains a variety of slides for the user to input data, such as structures to contrast two elements, bullet points, and slides for written information. Slidegeeks is prepared to create an impression. This slide compares impact of sales networking in pre implementation and post implementation with KPIs such as sales revenue, conversion rate, number of leads, customer acquisition costs, etc.
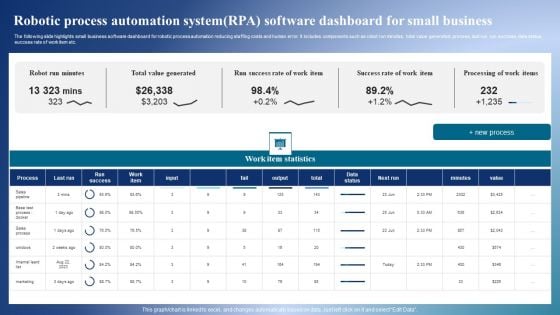
Robotic Process Automation Systemrpa Software Dashboard For Small Business Sample PDF
The following slide highlights small business software dashboard for robotic process automation reducing staffing costs and human error. It includes components such as robot run minutes, total value generated, process, last run, run success, data status, success rate of work item etc. Pitch your topic with ease and precision using this Robotic Process Automation Systemrpa Software Dashboard For Small Business Sample PDF. This layout presents information on Work Item Statistics, Business, Total Value Generated. It is also available for immediate download and adjustment. So, changes can be made in the color, design, graphics or any other component to create a unique layout.
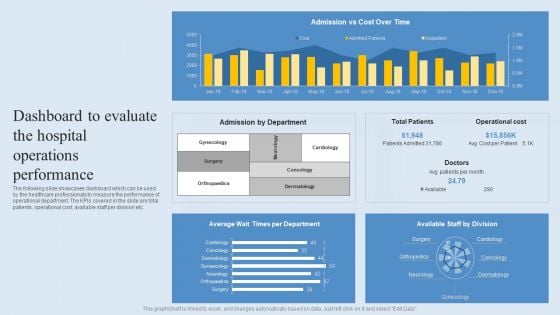
Dashboard To Evaluate The Hospital Operations Performance Diagrams PDF
The following slide showcases dashboard which can be used by the healthcare professionals to measure the performance of operational department. The KPIs covered in the slide are total patients, operational cost, available staff per division etc. Make sure to capture your audiences attention in your business displays with our gratis customizable Dashboard To Evaluate The Hospital Operations Performance Diagrams PDF. These are great for business strategies, office conferences, capital raising or task suggestions. If you desire to acquire more customers for your tech business and ensure they stay satisfied, create your own sales presentation with these plain slides.
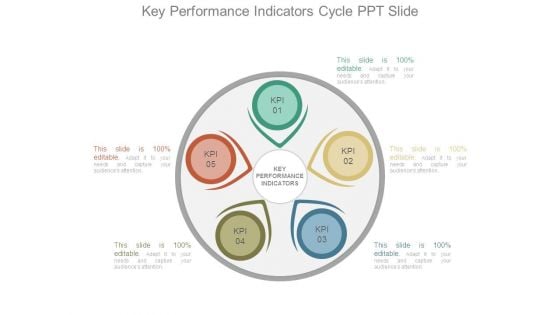
Key Performance Indicators Cycle Ppt Slide
This is a key performance indicators cycle ppt slide. This is a five stage process. The stages in this process are key performance indicators, kpi.
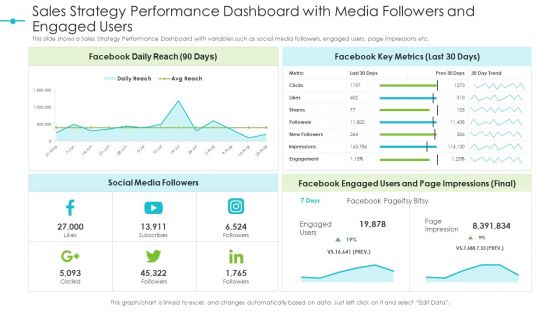
Tools For Improving Sales Plan Effectiveness Sales Strategy Performance Dashboard With Media Followers And Engaged Users Topics PDF
This slide shows a Sales Strategy Performance Dashboard with variables such as social media followers, engaged users, page impressions etc. Deliver an awe inspiring pitch with this creative tools for improving sales plan effectiveness sales strategy performance dashboard with media followers and engaged users topics pdf bundle. Topics like facebook daily reach, facebook key metrics, facebook engaged users and page impressions, social media followers can be discussed with this completely editable template. It is available for immediate download depending on the needs and requirements of the user.
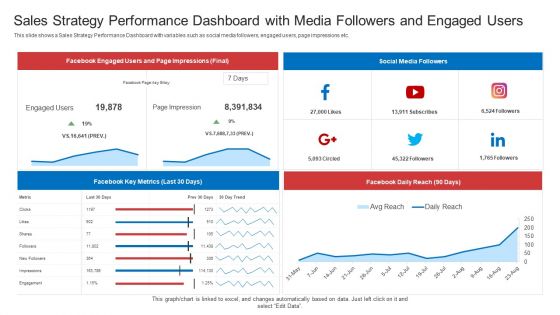
Strategic Plan To Increase Sales Volume And Revenue Sales Strategy Performance Dashboard With Media Followers And Engaged Users Topics PDF
This slide shows a Sales Strategy Performance Dashboard with variables such as social media followers, engaged users, page impressions etc. Deliver an awe inspiring pitch with this creative strategic plan to increase sales volume and revenue sales strategy performance dashboard with media followers and engaged users topics pdf bundle. Topics like facebook daily reach, facebook key metrics, facebook engaged users and page impressions, social media followers can be discussed with this completely editable template. It is available for immediate download depending on the needs and requirements of the user.
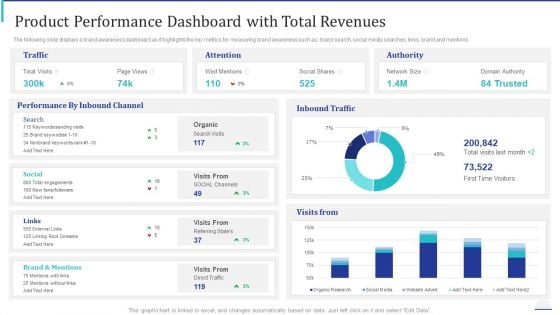
How Make Impactful Product Marketing Message Build Product Differentiation Product Performance Dashboard With Total Revenues Information PDF
The following slide displays a brand awareness dashboard as it highlights the key metrics for measuring brand awareness such as brand search, social media searches, links, brand and mentions. Deliver and pitch your topic in the best possible manner with this how make impactful product marketing message build product differentiation product performance dashboard with total revenues information pdf. Use them to share invaluable insights on social, organic, performance, traffic and impress your audience. This template can be altered and modified as per your expectations. So, grab it now.
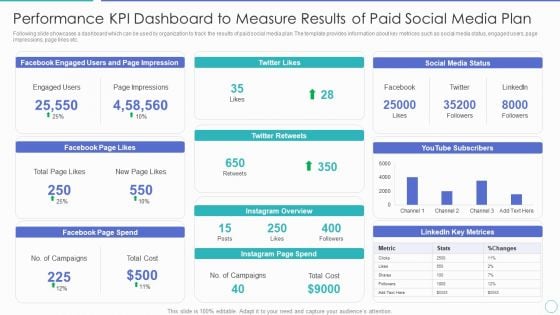
Performance KPI Dashboard To Measure Results Of Paid Social Media Plan Ppt PowerPoint Presentation Gallery Format Ideas PDF
Following slide showcases a dashboard which can be used by organization to track the results of paid social media plan. The template provides information about key metrices such as social media status, engaged users, page impressions, page likes etc. Pitch your topic with ease and precision using this performance kpi dashboard to measure results of paid social media plan ppt powerpoint presentation gallery format ideas pdf. This layout presents information on social media status, instagram page spend, facebook page spend, facebook page likes. It is also available for immediate download and adjustment. So, changes can be made in the color, design, graphics or any other component to create a unique layout.
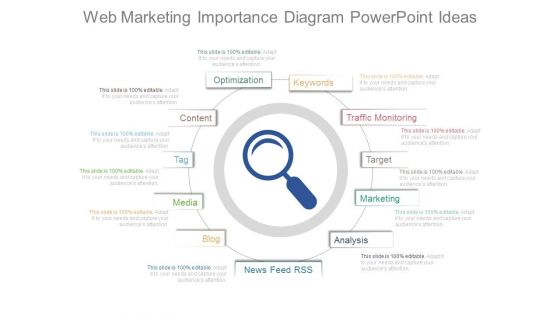
Web Marketing Importance Diagram Powerpoint Ideas
This is a web marketing importance diagram powerpoint ideas. This is a eleven stage process. The stages in this process are optimization, content, tag, media, blog, news feed rss, analysis, marketing, target, traffic monitoring, keywords.

Magnifying Glass Ppt PowerPoint Presentation Infographic Template Background
This is a magnifying glass ppt powerpoint presentation infographic template background. This is a one stage process. The stages in this process are magnifying glass, search, marketing, analysis, business.
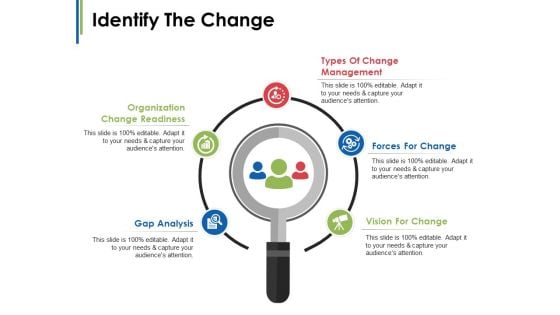
Identify The Change Ppt PowerPoint Presentation Model Introduction
This is a identify the change ppt powerpoint presentation model introduction. This is a five stage process. The stages in this process are organization change readiness, gap analysis, types of change management, forces for change, vision for change.
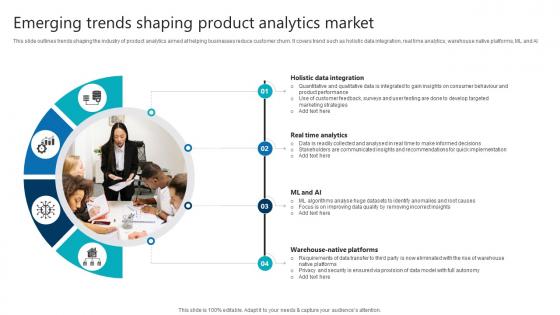
Emerging Trends Shaping Product Analytics Market Product Analytics Implementation Data Analytics V
This slide outlines trends shaping the industry of product analytics aimed at helping businesses reduce customer churn. It covers trend such as holistic data integration, real time analytics, warehouse native platforms, ML and AI Formulating a presentation can take up a lot of effort and time, so the content and message should always be the primary focus. The visuals of the PowerPoint can enhance the presenters message, so our Emerging Trends Shaping Product Analytics Market Product Analytics Implementation Data Analytics V was created to help save time. Instead of worrying about the design, the presenter can concentrate on the message while our designers work on creating the ideal templates for whatever situation is needed. Slidegeeks has experts for everything from amazing designs to valuable content, we have put everything into Emerging Trends Shaping Product Analytics Market Product Analytics Implementation Data Analytics V. This slide outlines trends shaping the industry of product analytics aimed at helping businesses reduce customer churn. It covers trend such as holistic data integration, real time analytics, warehouse native platforms, ML and AI
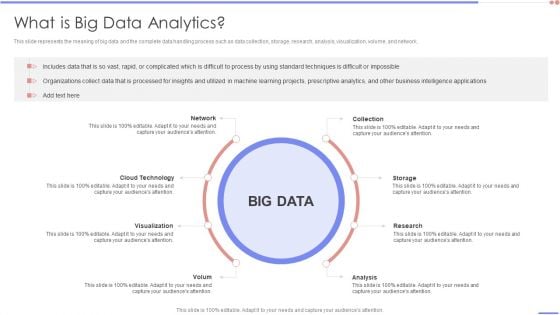
Data Analytics Management What Is Big Data Analytics Slides PDF
This slide represents the meaning of big data and the complete data handling process such as data collection, storage, research, analysis, visualization, volume, and network.This is a Data Analytics Management What Is Big Data Analytics Slides PDF template with various stages. Focus and dispense information on one stage using this creative set, that comes with editable features. It contains large content boxes to add your information on topics like Standard Techniques, Difficult Impossible, Intelligence. You can also showcase facts, figures, and other relevant content using this PPT layout. Grab it now.
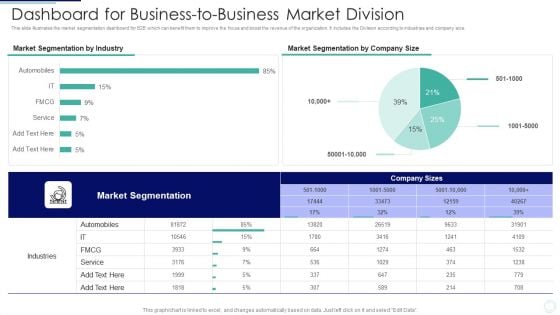
Dashboard For Business To Business Market Division Inspiration PDF
This slide illustrates the market segmentation dashboard for B2B which can benefit them to improve the focus and boost the revenue of the organization. It includes the Division according to industries and company size. Showcasing this set of slides titled Dashboard For Business To Business Market Division Inspiration PDF. The topics addressed in these templates are Industries, Service, Automobiles. All the content presented in this PPT design is completely editable. Download it and make adjustments in color, background, font etc. as per your unique business setting.
Optimizing Consumer Lead Nurturing Procedure Lead Generation Dashboard For Tracking Introduction PDF
This slide covers the KPI dashboard for tracking lead conversion rates. It includes metrics such as visitors, average session rate, per visit, bounce rate, page views, etc. Create an editable Optimizing Consumer Lead Nurturing Procedure Lead Generation Dashboard For Tracking Introduction PDF that communicates your idea and engages your audience. Whether youre presenting a business or an educational presentation, pre designed presentation templates help save time. Optimizing Consumer Lead Nurturing Procedure Lead Generation Dashboard For Tracking Introduction PDF is highly customizable and very easy to edit, covering many different styles from creative to business presentations. Slidegeeks has creative team members who have crafted amazing templates. So, go and get them without any delay.
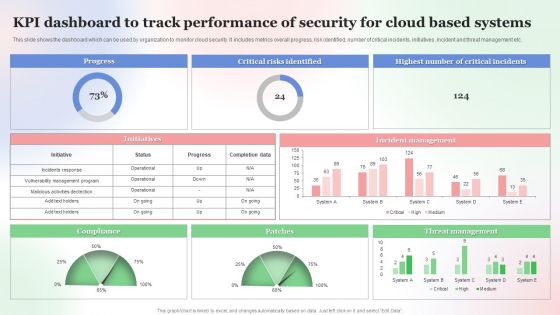
KPI Dashboard To Track Performance Of Security For Cloud Based Systems Clipart PDF
This slide shows the dashboard which can be used by organization to monitor cloud security. It includes metrics overall progress, risk identified, number of critical incidents, initiatives, incident and threat management etc. Showcasing this set of slides titled KPI Dashboard To Track Performance Of Security For Cloud Based Systems Clipart PDF. The topics addressed in these templates are Kpi Dashboard To Track, Performance Of Security, Cloud Based Systems . All the content presented in this PPT design is completely editable. Download it and make adjustments in color, background, font etc. as per your unique business setting.
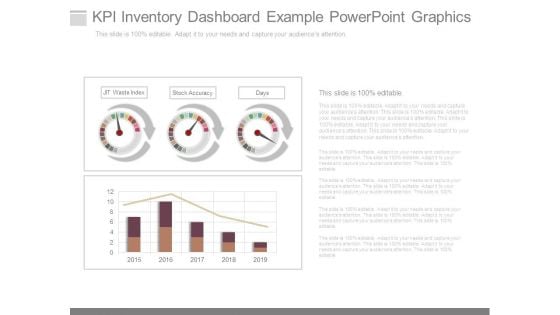
Kpi Inventory Dashboard Example Powerpoint Graphics
This is a kpi inventory dashboard example powerpoint graphics. This is a three stage process. The stages in this process are jit waste index, stock accuracy, days.
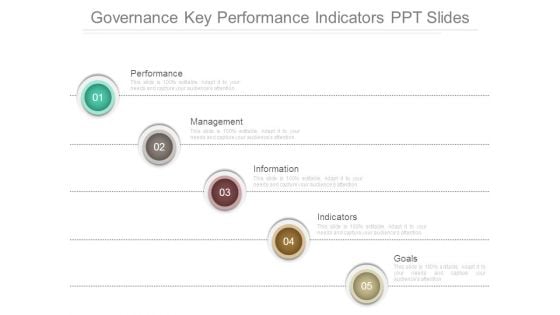
Governance Key Performance Indicators Ppt Slides
This is a governance key performance indicators ppt slides. This is a five stage process. The stages in this process are performance, management, information, indicators, goals.
Professional Scrum Master Training IT Risk Monitoring Dashboard For Software Development Projects Icons PDF
Following slide displays risk monitoring KPI dashboard that can be used by a firm to track multiple risk events. Metrics covered in the dashboard are residual risk by period and category by total risk rating. Deliver an awe inspiring pitch with this creative professional scrum master training it risk monitoring dashboard for software development projects icons pdf bundle. Topics like financial risk, people risk, governance risk, competitive risk, system or technology can be discussed with this completely editable template. It is available for immediate download depending on the needs and requirements of the user.
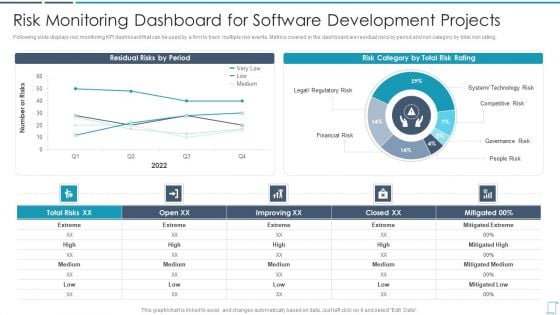
Professional Scrum Master Certification Training Program IT Risk Monitoring Dashboard Background PDF
Following slide displays risk monitoring KPI dashboard that can be used by a firm to track multiple risk events. Metrics covered in the dashboard are residual risks by period and risk category by total risk rating.Deliver an awe inspiring pitch with this creative professional scrum master certification training program it risk monitoring dashboard background pdf bundle. Topics like competitive risk, governance risk, people risk can be discussed with this completely editable template. It is available for immediate download depending on the needs and requirements of the user.
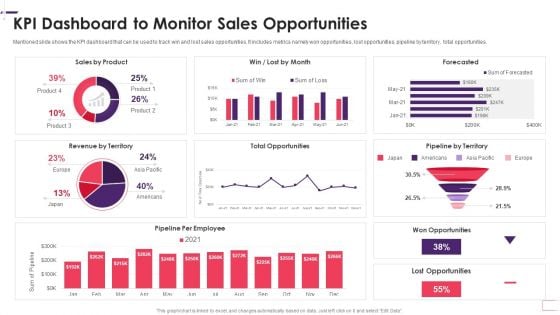
Enhancing Stp Strategies For A Successful Market Promotion Kpi Dashboard To Monitor Diagrams PDF
Mentioned slide shows the KPI dashboard that can be used to track win and lost sales opportunities. It includes metrics namely won opportunities, lost opportunities, pipeline by territory, total opportunities. Deliver and pitch your topic in the best possible manner with this enhancing stp strategies for a successful market promotion kpi dashboard to monitor diagrams pdf. Use them to share invaluable insights on kpi dashboard to monitor sales opportunities and impress your audience. This template can be altered and modified as per your expectations. So, grab it now.
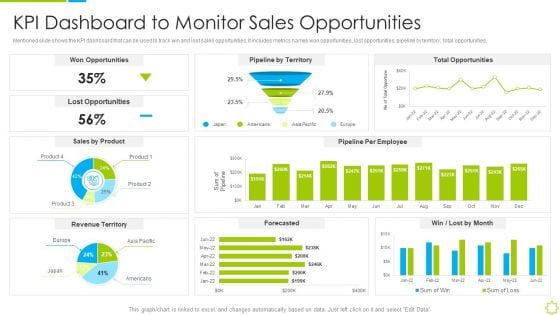
Launch New Sales Enablement Program Lead Generation KPI Dashboard To Monitor Sales Topics PDF
Mentioned slide shows the KPI dashboard that can be used to track win and lost sales opportunities. It includes metrics namely won opportunities, lost opportunities, pipeline by territory, total opportunities. Deliver and pitch your topic in the best possible manner with this launch new sales enablement program lead generation kpi dashboard to monitor sales topics pdf. Use them to share invaluable insights on kpi dashboard to monitor sales opportunities and impress your audience. This template can be altered and modified as per your expectations. So, grab it now.


 Continue with Email

 Home
Home


