Snapshot
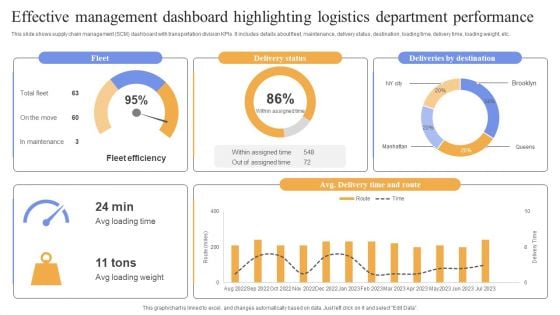
Effective Management Dashboard Highlighting Logistics Department Performance Topics PDF
This slide shows supply chain management SCM dashboard with transportation division KPIs. It includes details about fleet, maintenance, delivery status, destination, loading time, delivery time, loading weight, etc. Pitch your topic with ease and precision using this Effective Management Dashboard Highlighting Logistics Department Performance Topics PDF. This layout presents information on Fleet, Delivery Status, Deliveries Destination. It is also available for immediate download and adjustment. So, changes can be made in the color, design, graphics or any other component to create a unique layout.
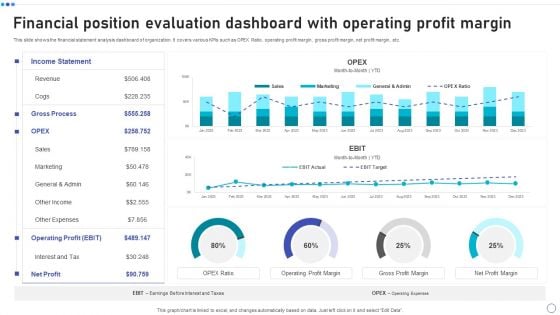
Financial Position Evaluation Dashboard With Operating Profit Margin Elements PDF
This slide shows the financial statement analysis dashboard of organization. It covers various KPIs such as OPEX Ratio, operating profit margin, gross profit margin, net profit margin, etc. Pitch your topic with ease and precision using this Financial Position Evaluation Dashboard With Operating Profit Margin Elements PDF. This layout presents information on Income Statement, Revenue, Operating Profit, Net Profit. It is also available for immediate download and adjustment. So, changes can be made in the color, design, graphics or any other component to create a unique layout.
Leads Tracking Dashboard With Conversion Funnel Ideas PDF
This slide showcases dashboard that can help organization to identify the total number of customers acquired from the sales and marketing qualified lead. It also showcases financial KPIs that are cost per lead, cost per customer, customer lifetine value and return on marketing investment. Pitch your topic with ease and precision using this Leads Tracking Dashboard With Conversion Funnel Ideas PDF. This layout presents information on Audience, Prospects, Conversion Funnel. It is also available for immediate download and adjustment. So, changes can be made in the color, design, graphics or any other component to create a unique layout.
Facebook Ad Campaign Performance Tracking Dashboard Microsoft PDF
This slide represents the KPI dashboard to effectively measure and monitor performance of Facebook marketing campaign conducted by the organization to enhance customer engagement. It includes details related to KPIs such as ad impressions, ad reach etc. From laying roadmaps to briefing everything in detail, our templates are perfect for you. You can set the stage with your presentation slides. All you have to do is download these easy-to-edit and customizable templates. Facebook Ad Campaign Performance Tracking Dashboard Microsoft PDF will help you deliver an outstanding performance that everyone would remember and praise you for. Do download this presentation today.
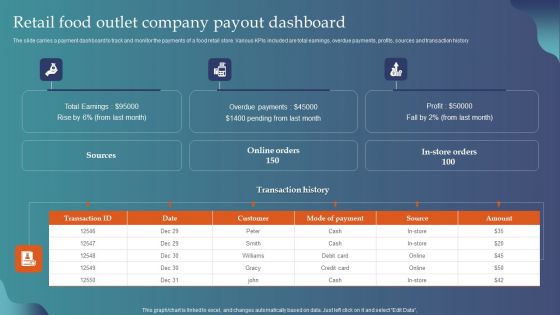
Retail Food Outlet Company Payout Dashboard Ppt Ideas Aids PDF
The slide carries a payment dashboard to track and monitor the payments of a food retail store. Various KPIs included are total earnings, overdue payments, profits, sources and transaction history. Pitch your topic with ease and precision using this Retail Food Outlet Company Payout Dashboard Ppt Ideas Aids PDF. This layout presents information on Total Earnings, Overdue Payments, Profit. It is also available for immediate download and adjustment. So, changes can be made in the color, design, graphics or any other component to create a unique layout.
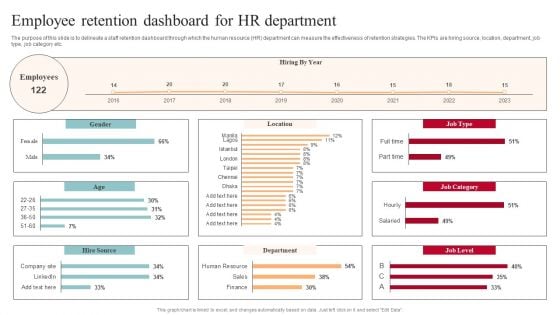
Employee Retention Dashboard For Hr Department Sample PDF
The purpose of this slide is to delineate a staff retention dashboard through which the human resource HR department can measure the effectiveness of retention strategies. The KPIs are hiring source, location, department, job type, job category etc. Boost your pitch with our creative Employee Retention Dashboard For Hr Department Sample PDF. Deliver an awe-inspiring pitch that will mesmerize everyone. Using these presentation templates you will surely catch everyones attention. You can browse the ppts collection on our website. We have researchers who are experts at creating the right content for the templates. So you do not have to invest time in any additional work. Just grab the template now and use them.
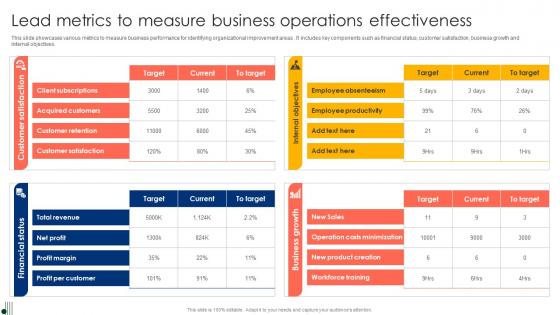
Lead Metrics To Measure Business Operations Effectiveness Ppt Styles Graphics Pdf
This slide showcases various metrics to measure business performance for identifying organizational improvement areas. It includes key components such as financial status, customer satisfaction, business growth and internal objectives. Pitch your topic with ease and precision using this Lead Metrics To Measure Business Operations Effectiveness Ppt Styles Graphics Pdf. This layout presents information on Financial Status, Customer Satisfaction, Business Growth. It is also available for immediate download and adjustment. So, changes can be made in the color, design, graphics or any other component to create a unique layout. This slide showcases various metrics to measure business performance for identifying organizational improvement areas. It includes key components such as financial status, customer satisfaction, business growth and internal objectives.
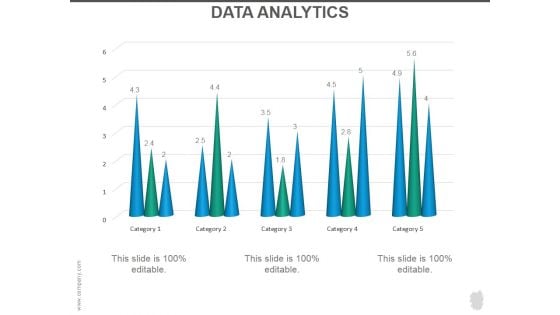
Data Analytics Ppt PowerPoint Presentation Graphics
This is a data analytics ppt powerpoint presentation graphics. This is a five stage process. The stages in this process are data analysis, business, marketing, success, graph.
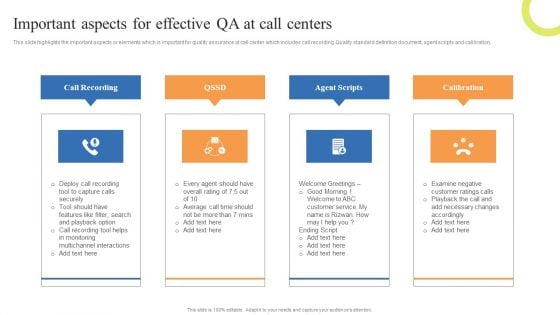
Customer Support Center Important Aspects For Effective QA At Call Centers Pictures PDF
This slide highlights the important aspects or elements which is important for quality assurance at call center which includes call recording. Quality standard definition document, agent scripts and calibration. Crafting an eye-catching presentation has never been more straightforward. Let your presentation shine with this tasteful yet straightforward Customer Support Center Important Aspects For Effective QA At Call Centers Pictures PDF template. It offers a minimalistic and classy look that is great for making a statement. The colors have been employed intelligently to add a bit of playfulness while still remaining professional. Construct the ideal Customer Support Center Important Aspects For Effective QA At Call Centers Pictures PDF that effortlessly grabs the attention of your audience Begin now and be certain to wow your customers.
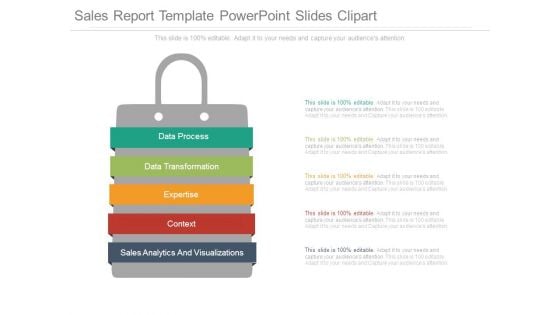
Sales Report Template Powerpoint Slides Clipart
This is a sales report template powerpoint slides clipart. This is a five stage process. The stages in this process are data process, data transformation, expertise, context, sales analytics and visualizations.
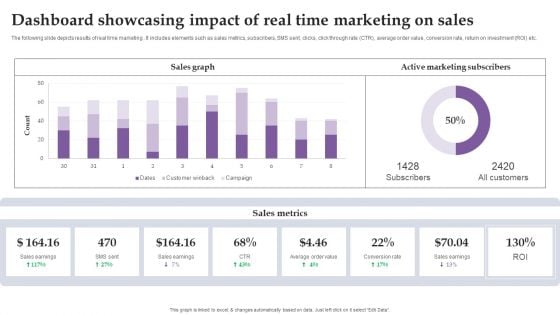
Dashboard Showcasing Impact Of Real Time Marketing On Sales Ppt Gallery Design Templates PDF
The following slide depicts results of real time marketing . It includes elements such as sales metrics, subscribers, SMS sent, clicks, click through rate CTR, average order value, conversion rate, return on investment ROI etc. This modern and well-arranged Dashboard Showcasing Impact Of Real Time Marketing On Sales Ppt Gallery Design Templates PDF provides lots of creative possibilities. It is very simple to customize and edit with the Powerpoint Software. Just drag and drop your pictures into the shapes. All facets of this template can be edited with Powerpoint, no extra software is necessary. Add your own material, put your images in the places assigned for them, adjust the colors, and then you can show your slides to the world, with an animated slide included.
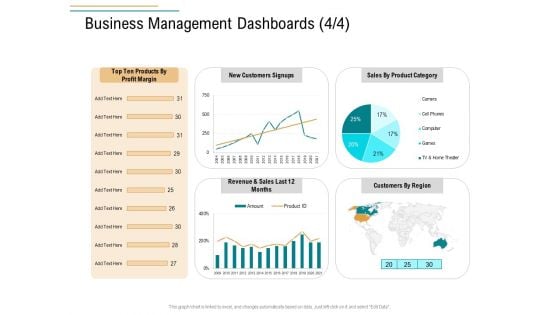
Business Operations Assessment Business Management Dashboards Product Ppt Ideas PDF
Deliver and pitch your topic in the best possible manner with this business operations assessment business management dashboards product ppt ideas pdf. Use them to share invaluable insights on top ten products by profit margin, revenue and sales last 12 months, customers by region, new customers signups, sales by product category and impress your audience. This template can be altered and modified as per your expectations. So, grab it now.
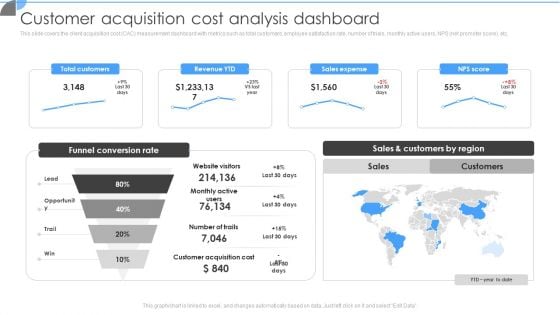
Customer Acquisition Approaches To Enhance Organization Growth Customer Acquisition Cost Analysis Dashboard Slides PDF
This slide covers the client acquisition cost CAC measurement dashboard with metrics such as total customers, employee satisfaction rate, number of trials, monthly active users, NPS net promoter score, etc. Make sure to capture your audiences attention in your business displays with our gratis customizable Customer Acquisition Approaches To Enhance Organization Growth Customer Acquisition Cost Analysis Dashboard Slides PDF. These are great for business strategies, office conferences, capital raising or task suggestions. If you desire to acquire more customers for your tech business and ensure they stay satisfied, create your own sales presentation with these plain slides.
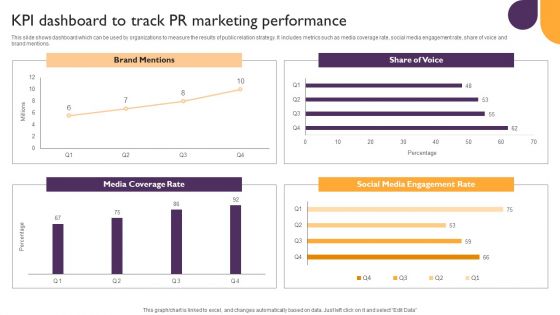
Public Relations Guide To Enhance Brand Credibility KPI Dashboard To Track PR Marketing Performance Diagrams PDF
This slide shows dashboard which can be used by organizations to measure the results of public relation strategy. It includes metrics such as media coverage rate, social media engagement rate, share of voice and brand mentions. Make sure to capture your audiences attention in your business displays with our gratis customizable Public Relations Guide To Enhance Brand Credibility KPI Dashboard To Track PR Marketing Performance Diagrams PDF. These are great for business strategies, office conferences, capital raising or task suggestions. If you desire to acquire more customers for your tech business and ensure they stay satisfied, create your own sales presentation with these plain slides.
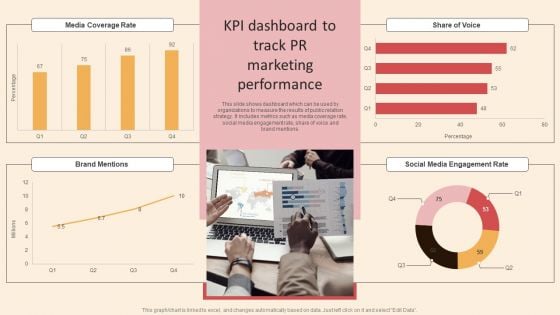
Online PR Techniques To Boost Brands Online Visibility KPI Dashboard To Track PR Marketing Summary PDF
This slide shows dashboard which can be used by organizations to measure the results of public relation strategy. It includes metrics such as media coverage rate, social media engagement rate, share of voice and brand mentions. Make sure to capture your audiences attention in your business displays with our gratis customizable Online PR Techniques To Boost Brands Online Visibility KPI Dashboard To Track PR Marketing Summary PDF. These are great for business strategies, office conferences, capital raising or task suggestions. If you desire to acquire more customers for your tech business and ensure they stay satisfied, create your own sales presentation with these plain slides.
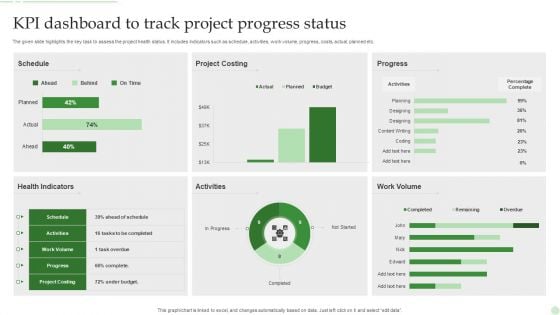
KPI Dashboard To Track Project Progress Status Ppt PowerPoint Presentation Gallery Maker PDF
The given slide highlights the key task to assess the project health status. It includes indicators such as schedule, activities, work volume, progress, costs, actual, planned etc. Showcasing this set of slides titled KPI Dashboard To Track Project Progress Status Ppt PowerPoint Presentation Gallery Maker PDF. The topics addressed in these templates are Schedule, Project Costing, Progress, Activities. All the content presented in this PPT design is completely editable. Download it and make adjustments in color, background, font etc. as per your unique business setting.
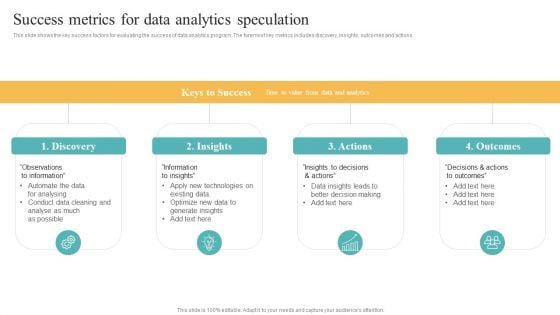
Transformation Toolkit Competitive Intelligence Information Analysis Success Metrics For Data Analytics Speculation Diagrams PDF
This slide shows the key success factors for evaluating the success of data analytics program. The foremost key metrics includes discovery, insights, outcomes and actions. Do you have to make sure that everyone on your team knows about any specific topic I yes, then you should give Transformation Toolkit Competitive Intelligence Information Analysis Success Metrics For Data Analytics Speculation Diagrams PDF a try. Our experts have put a lot of knowledge and effort into creating this impeccable Transformation Toolkit Competitive Intelligence Information Analysis Success Metrics For Data Analytics Speculation Diagrams PDF. You can use this template for your upcoming presentations, as the slides are perfect to represent even the tiniest detail. You can download these templates from the Slidegeeks website and these are easy to edit. So grab these today.
Effective Company Event Communication Plan Dashboard For Tracking Event Gross Revenue Portrait PDF
This slide covers metrics for analyzing gross revenue generated throughout the event. It includes a graphical and tabular representation of revenue generated via promo codes and tracking links. Deliver an awe inspiring pitch with this creative Effective Company Event Communication Plan Dashboard For Tracking Event Gross Revenue Portrait PDF bundle. Topics like Gross Revenue, Promo Codes, Tracking Links can be discussed with this completely editable template. It is available for immediate download depending on the needs and requirements of the user.
Effective Company Event Communication Tactics Dashboard For Tracking Event Gross Revenue Introduction PDF
This slide covers metrics for analyzing gross revenue generated throughout the event. It includes a graphical and tabular representation of revenue generated via promo codes and tracking links. Deliver an awe inspiring pitch with this creative Effective Company Event Communication Tactics Dashboard For Tracking Event Gross Revenue Introduction PDF bundle. Topics like Discount Claimed, Gross Revenue, Codes Tracking can be discussed with this completely editable template. It is available for immediate download depending on the needs and requirements of the user.
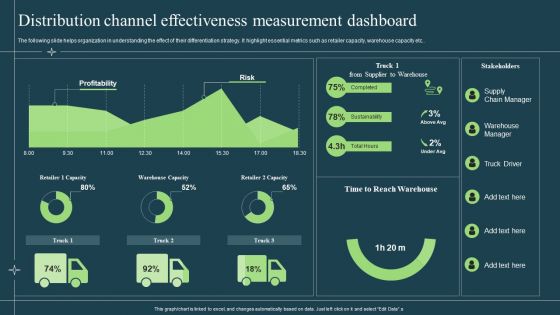
Differentiation Techniques Ways To Surpass Competitors Distribution Channel Effectiveness Measurement Dashboard Ideas PDF
The following slide helps organization in understanding the effect of their differentiation strategy. It highlight essential metrics such as retailer capacity, warehouse capacity etc. Deliver an awe inspiring pitch with this creative Differentiation Techniques Ways To Surpass Competitors Distribution Channel Effectiveness Measurement Dashboard Ideas PDF bundle. Topics like Profitability, Risk, Retailer can be discussed with this completely editable template. It is available for immediate download depending on the needs and requirements of the user.
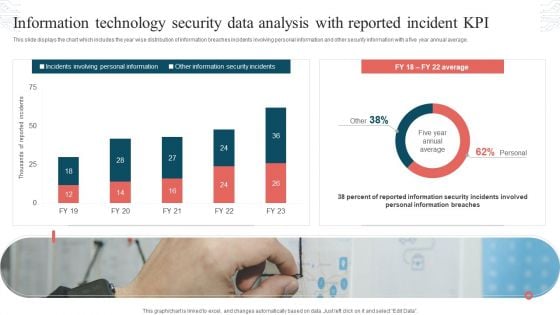
Information Technology Security Data Analysis With Reported Incident KPI Download PDF
This slide displays the chart which includes the year wise distribution of information breaches incidents involving personal information and other security information with a five year annual average. Showcasing this set of slides titled Information Technology Security Data Analysis With Reported Incident KPI Download PDF. The topics addressed in these templates are Incidents Involving, Personal Information, Other Information, Security Incidents. All the content presented in this PPT design is completely editable. Download it and make adjustments in color, background, font etc. as per your unique business setting.
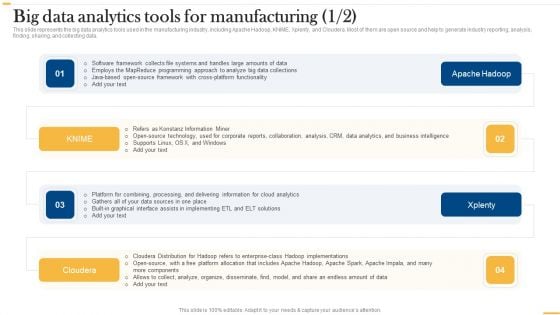
Deploying AI To Enhance Big Data Analytics Tools For Manufacturing Brochure PDF
This slide represents the big data analytics tools used in the manufacturing industry, including Apache Hadoop, KNIME, Xplenty, and Cloudera. Most of them are open source and help to generate industry reporting, analysis, finding, sharing, and collecting data. Get a simple yet stunning designed Deploying AI To Enhance Big Data Analytics Tools For Manufacturing Brochure PDF. It is the best one to establish the tone in your meetings. It is an excellent way to make your presentations highly effective. So, download this PPT today from Slidegeeks and see the positive impacts. Our easy-to-edit Deploying AI To Enhance Big Data Analytics Tools For Manufacturing Brochure PDF can be your go-to option for all upcoming conferences and meetings. So, what are you waiting for Grab this template today.

Agenda Product Analytics Implementation For Enhanced Business Insights Data Analytics V
Find a pre-designed and impeccable Agenda Product Analytics Implementation For Enhanced Business Insights Data Analytics V. The templates can ace your presentation without additional effort. You can download these easy-to-edit presentation templates to make your presentation stand out from others. So, what are you waiting for Download the template from Slidegeeks today and give a unique touch to your presentation. Our Agenda Product Analytics Implementation For Enhanced Business Insights Data Analytics V are topically designed to provide an attractive backdrop to any subject. Use them to look like a presentation pro.
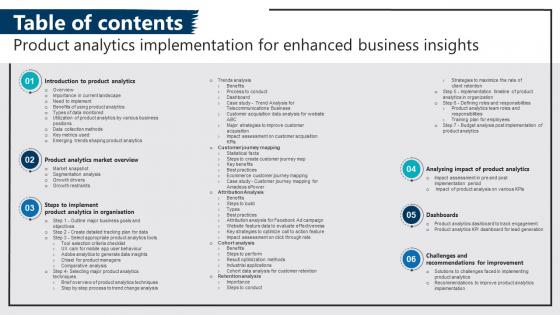
Table Of Contents Product Analytics Implementation For Enhanced Business Insights Data Analytics V
The best PPT templates are a great way to save time, energy, and resources. Slidegeeks have 100 percent editable powerpoint slides making them incredibly versatile. With these quality presentation templates, you can create a captivating and memorable presentation by combining visually appealing slides and effectively communicating your message. Download Table Of Contents Product Analytics Implementation For Enhanced Business Insights Data Analytics V from Slidegeeks and deliver a wonderful presentation. Our Table Of Contents Product Analytics Implementation For Enhanced Business Insights Data Analytics V are topically designed to provide an attractive backdrop to any subject. Use them to look like a presentation pro.
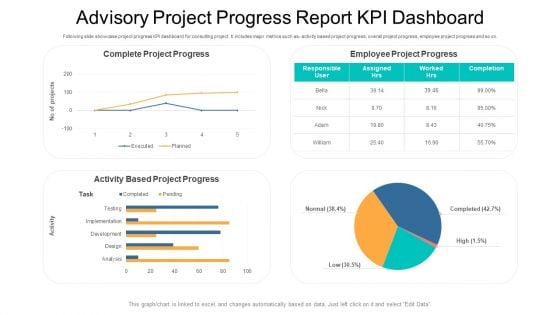
Advisory Project Progress Report KPI Dashboard Ppt PowerPoint Presentation File Gridlines PDF
Following slide showcase project progress KPI dashboard for consulting project. It includes major metrics such as- activity based project progress, overall project progress, employee project progress and so on. Showcasing this set of slides titled advisory project progress report kpi dashboard ppt powerpoint presentation file gridlines pdf. The topics addressed in these templates are complete project progress, activity based project progress, employee project progress. All the content presented in this PPT design is completely editable. Download it and make adjustments in color, background, font etc. as per your unique business setting.
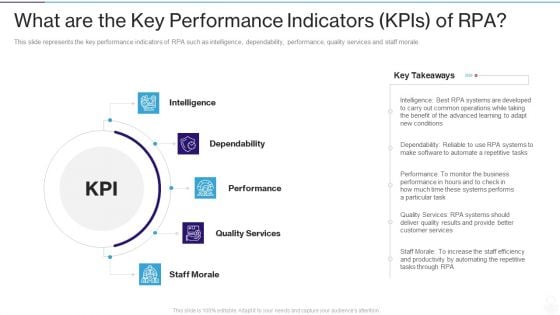
RPA IT What Are The Key Performance Indicators Kpis Of RPA Ppt Professional Design Templates PDF
This slide represents the key performance indicators of RPA such as intelligence, dependability, performance, quality services and staff morale. This is a rpa it what are the key performance indicators kpis of rpa ppt professional design templates pdf template with various stages. Focus and dispense information on five stages using this creative set, that comes with editable features. It contains large content boxes to add your information on topics like staff morale, quality services, performance, dependability, intelligence. You can also showcase facts, figures, and other relevant content using this PPT layout. Grab it now.
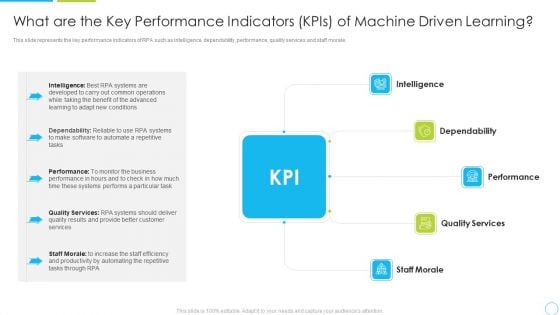
What Are The Key Performance Indicators Kpis Of Machine Driven Learning Ppt Styles Slideshow PDF
This slide represents the key performance indicators of RPA such as intelligence, dependability, performance, quality services and staff morale. This is a what are the key performance indicators kpis of machine driven learning ppt styles slideshow pdf template with various stages. Focus and dispense information on five stages using this creative set, that comes with editable features. It contains large content boxes to add your information on topics like dependability, intelligence, performance, quality services, staff morale. You can also showcase facts, figures, and other relevant content using this PPT layout. Grab it now.
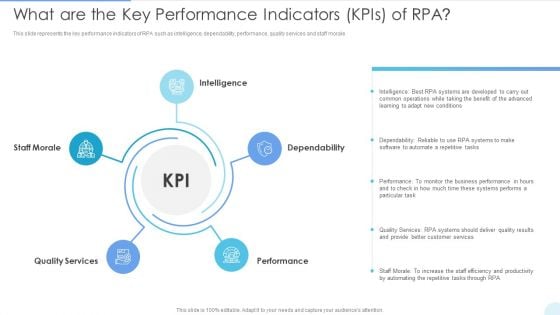
What Are The Key Performance Indicators Kpis Of RPA Structure PDF
This slide represents the key performance indicators of RPA such as intelligence, dependability, performance, quality services and staff morale. This is a What Are The Key Performance Indicators Kpis Of RPA Structure PDF template with various stages. Focus and dispense information on five stages using this creative set, that comes with editable features. It contains large content boxes to add your information on topics like Dependability, Performance, Quality Services. You can also showcase facts, figures, and other relevant content using this PPT layout. Grab it now.
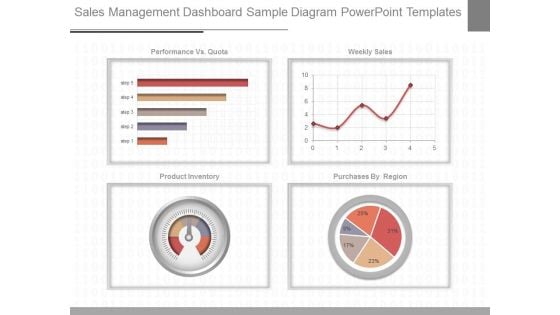
Sales Management Dashboard Sample Diagram Powerpoint Templates
This is a sales management dashboard sample diagram powerpoint templates. This is a four stage process. The stages in this process are performance vs quota, weekly sales, product inventory, purchases by region, step.
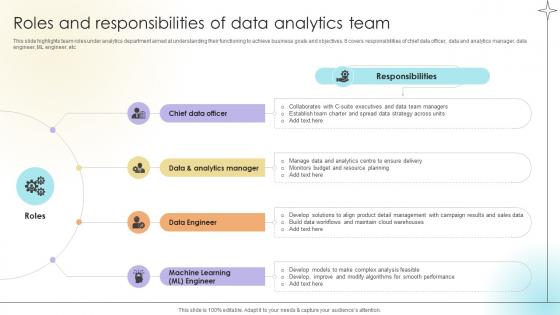
Roles And Responsibilities Of Data Analytics Team Data Analytics SS V
This slide highlights team roles under analytics department aimed at understanding their functioning to achieve business goals and objectives. It covers responsibilities of chief data officer, data and analytics manager, data engineer, ML engineer, etc.This Roles And Responsibilities Of Data Analytics Team Data Analytics SS V from Slidegeeks makes it easy to present information on your topic with precision. It provides customization options, so you can make changes to the colors, design, graphics, or any other component to create a unique layout. It is also available for immediate download, so you can begin using it right away. Slidegeeks has done good research to ensure that you have everything you need to make your presentation stand out. Make a name out there for a brilliant performance. This slide highlights team roles under analytics department aimed at understanding their functioning to achieve business goals and objectives. It covers responsibilities of chief data officer, data and analytics manager, data engineer, ML engineer, etc.
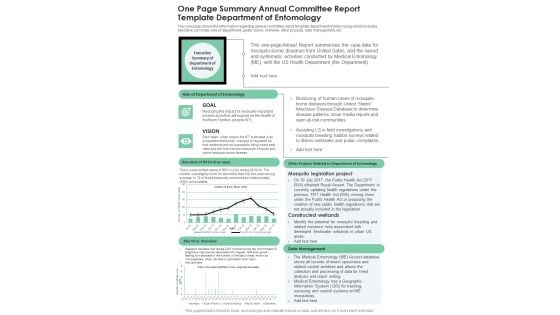
One Page Summary Annual Committee Report Template Department Of Entomology One Pager Documents
This one page shows the information regarding annual committee report template department of entomology which includes executive summary, role of department, goals, vision, overview, other projects, data management, etc. Presenting you a fantastic One Page Summary Annual Committee Report Template Department Of Entomology One Pager Documents. This piece is crafted on hours of research and professional design efforts to ensure you have the best resource. It is completely editable and its design allow you to rehash its elements to suit your needs. Get this One Page Summary Annual Committee Report Template Department Of Entomology One Pager Documents A4 One-pager now.
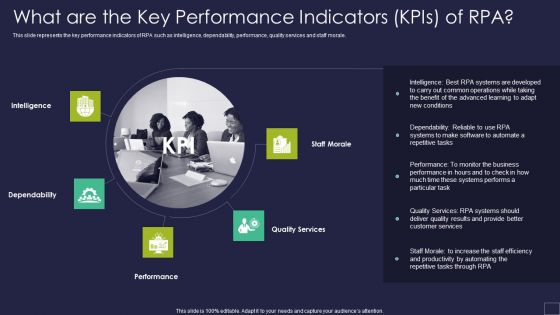
What Are The Key Performance Indicators Kpis Of RPA Robotic Process Automation Technology Graphics PDF
This slide represents the key performance indicators of RPA such as intelligence, dependability, performance, quality services and staff morale.This is a What Are The Key Performance Indicators Kpis Of RPA Robotic Process Automation Technology Graphics PDF template with various stages. Focus and dispense information on five stages using this creative set, that comes with editable features. It contains large content boxes to add your information on topics like Dependability, Intelligence, Quality Services. You can also showcase facts, figures, and other relevant content using this PPT layout. Grab it now.
KPI Dashboard For Organizational Debt Management Ppt Professional Icons PDF
This slide shows the KPI dashboard for debt management which can be used by an organization to track debt performance. It includes KPIs such as current bank balance, amount due, creditors, etc. Showcasing this set of slides titled KPI Dashboard For Organizational Debt Management Ppt Professional Icons PDF. The topics addressed in these templates are Total Amount Due, Current Bank Balance, Invoiced vs Paid. All the content presented in this PPT design is completely editable. Download it and make adjustments in color, background, font etc. as per your unique business setting.
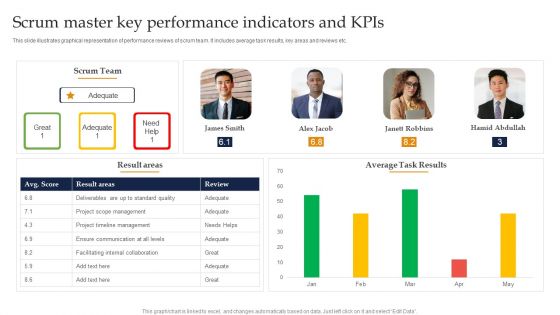
Scrum Master Key Performance Indicators And Kpis Ppt Gallery Files PDF
This slide illustrates graphical representation of performance reviews of scrum team. It includes average task results, key areas and reviews etc. Showcasing this set of slides titled Scrum Master Key Performance Indicators And Kpis Ppt Gallery Files PDF. The topics addressed in these templates are Scrum Team, Average Task Results, Project Timeline Management. All the content presented in this PPT design is completely editable. Download it and make adjustments in color, background, font etc. as per your unique business setting.
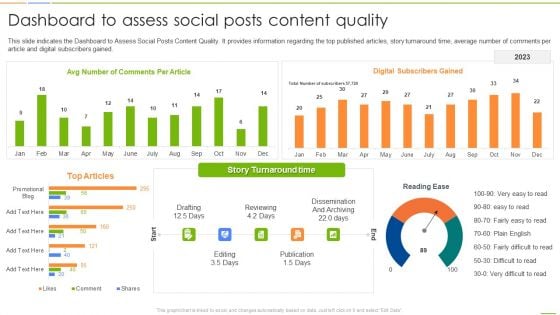
Social Media Channels Auditing Dashboard To Assess Social Posts Content Quality Sample PDF
This slide indicates the Dashboard to Assess Social Posts Content Quality. It provides information regarding the top published articles, story turnaround time, average number of comments per article and digital subscribers gained. Get a simple yet stunning designed Social Media Channels Auditing Dashboard To Assess Social Posts Content Quality Sample PDF. It is the best one to establish the tone in your meetings. It is an excellent way to make your presentations highly effective. So, download this PPT today from Slidegeeks and see the positive impacts. Our easy-to-edit Social Media Channels Auditing Dashboard To Assess Social Posts Content Quality Sample PDF can be your go-to option for all upcoming conferences and meetings. So, what are you waiting for Grab this template today.
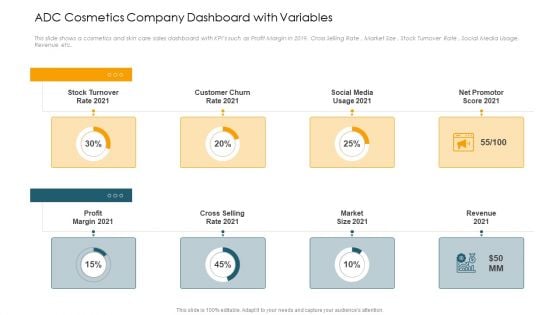
ADC Cosmetics Company Dashboard With Variables Ppt Backgrounds PDF
This slide shows a cosmetics and skin care sales dashboard with KPIs such as Profit Margin in 2019, Cross Selling Rate , Market Size , Stock Turnover Rate , Social Media Usage, Revenue etc.Presenting adc cosmetics company dashboard with variables ppt backgrounds pdf. to provide visual cues and insights. Share and navigate important information on eight stages that need your due attention. This template can be used to pitch topics like stock turnover rate 2021, social media usage 2021, net promotor score 2021. In addtion, this PPT design contains high resolution images, graphics, etc, that are easily editable and available for immediate download.
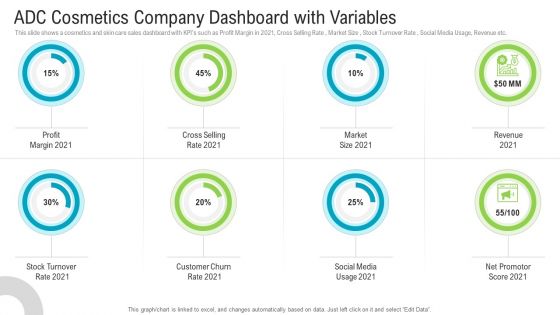
ADC Cosmetics Company Dashboard With Variables Summary PDF
This slide shows a cosmetics and skin care sales dashboard with KPIs such as Profit Margin in 2021, Cross Selling Rate , Market Size , Stock Turnover Rate , Social Media Usage, Revenue etc. Presenting adc cosmetics company dashboard with variables summary pdf to provide visual cues and insights. Share and navigate important information on eight stages that need your due attention. This template can be used to pitch topics like profit margin, cross selling rate, market size, revenue, stock turnover rate. In addtion, this PPT design contains high resolution images, graphics, etc, that are easily editable and available for immediate download.
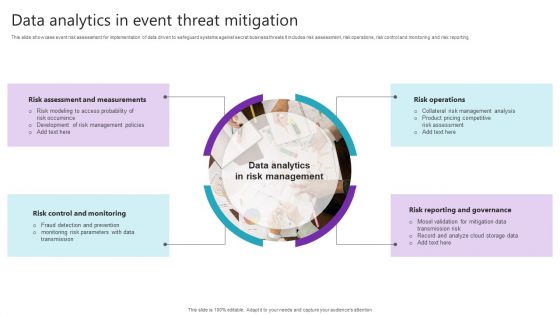
Data Analytics In Event Threat Mitigation Inspiration PDF
This slide showcase event risk assessment for implementation of data driven to safeguard systems against secret business threats It includes risk assessment, risk operations, risk control and monitoring and risk reporting. Persuade your audience using this Data Analytics In Event Threat Mitigation Inspiration PDF. This PPT design covers Four stages, thus making it a great tool to use. It also caters to a variety of topics including Risk Assessment And Measurements, Risk Operations, Risk Control Monitoring. Download this PPT design now to present a convincing pitch that not only emphasizes the topic but also showcases your presentation skills.
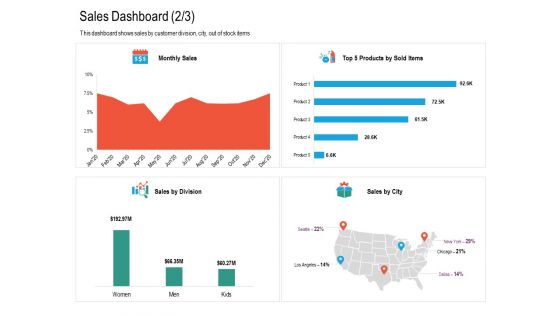
Upselling Strategies For Business Sales Dashboard Sales Structure PDF
This dashboard shows sales by customer division, city, out of stock items. Deliver an awe inspiring pitch with this creative upselling strategies for business sales dashboard sales structure pdf bundle. Topics like sales dashboard for fmcg cross selling can be discussed with this completely editable template. It is available for immediate download depending on the needs and requirements of the user.
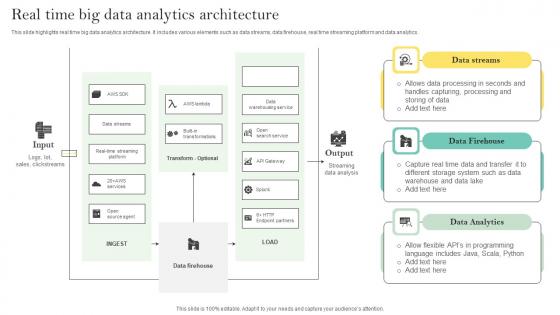
Real Time Big Data Analytics Architecture Ppt Infographics Microsoft Pdf
This slide highlights real time big data analytics architecture. It includes various elements such as data streams, data firehouse, real time streaming platform and data analytics. Showcasing this set of slides titled Real Time Big Data Analytics Architecture Ppt Infographics Microsoft Pdf. The topics addressed in these templates are Data Streams, Data Firehouse, Real Time. All the content presented in this PPT design is completely editable. Download it and make adjustments in color, background, font etc. as per your unique business setting. This slide highlights real time big data analytics architecture. It includes various elements such as data streams, data firehouse, real time streaming platform and data analytics.
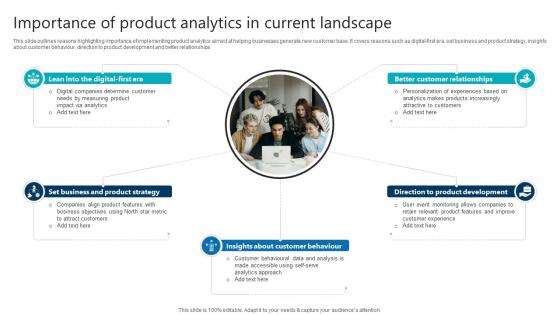
Importance Of Product Analytics In Current Landscape Product Analytics Implementation Data Analytics V
This slide outlines reasons highlighting importance of implementing product analytics aimed at helping businesses generate new customer base. It covers reasons such as digital-first era, set business and product strategy, insights about customer behaviour, direction to product development and better relationships Slidegeeks has constructed Importance Of Product Analytics In Current Landscape Product Analytics Implementation Data Analytics V after conducting extensive research and examination. These presentation templates are constantly being generated and modified based on user preferences and critiques from editors. Here, you will find the most attractive templates for a range of purposes while taking into account ratings and remarks from users regarding the content. This is an excellent jumping-off point to explore our content and will give new users an insight into our top-notch PowerPoint Templates. This slide outlines reasons highlighting importance of implementing product analytics aimed at helping businesses generate new customer base. It covers reasons such as digital-first era, set business and product strategy, insights about customer behaviour, direction to product development and better relationships
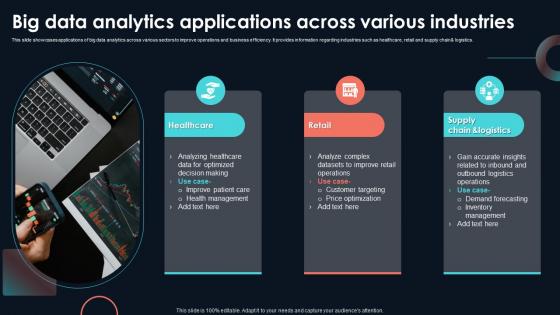
Big Data Analytics Applications Across Developing Strategic Insights Using Big Data Analytics SS V
This slide showcases applications of big data analytics across various sectors to improve operations and business efficiency. It provides information regarding industries such as healthcare, retail and supply chainAnd logistics. Do you have an important presentation coming up Are you looking for something that will make your presentation stand out from the rest Look no further than Big Data Analytics Applications Across Developing Strategic Insights Using Big Data Analytics SS V. With our professional designs, you can trust that your presentation will pop and make delivering it a smooth process. And with Slidegeeks, you can trust that your presentation will be unique and memorable. So why wait Grab Big Data Analytics Applications Across Developing Strategic Insights Using Big Data Analytics SS V today and make your presentation stand out from the rest This slide showcases applications of big data analytics across various sectors to improve operations and business efficiency. It provides information regarding industries such as healthcare, retail and supply chainand logistics.
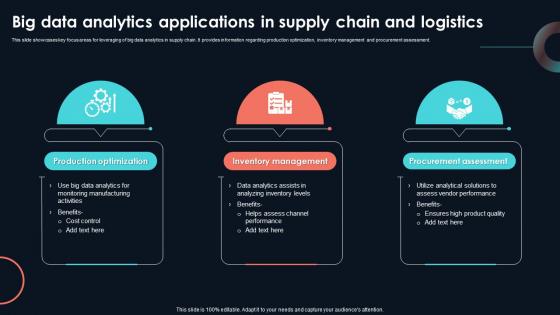
Big Data Analytics Applications In Supply Developing Strategic Insights Using Big Data Analytics SS V
This slide showcases key focus areas for leveraging of big data analytics in supply chain. It provides information regarding production optimization, inventory management and procurement assessment. Find highly impressive Big Data Analytics Applications In Supply Developing Strategic Insights Using Big Data Analytics SS V on Slidegeeks to deliver a meaningful presentation. You can save an ample amount of time using these presentation templates. No need to worry to prepare everything from scratch because Slidegeeks experts have already done a huge research and work for you. You need to download Big Data Analytics Applications In Supply Developing Strategic Insights Using Big Data Analytics SS V for your upcoming presentation. All the presentation templates are 100 percent editable and you can change the color and personalize the content accordingly. Download now This slide showcases key focus areas for leveraging of big data analytics in supply chain. It provides information regarding production optimization, inventory management and procurement assessment.

Sales Cycle Optimization Strategy Implementation Timeline Best Practices Ppt Slide SA SS V
Following slide showcases timeline to implement optimization strategy emphasizing continuous improvement and monitoring of sales operations. Boost your pitch with our creative Sales Cycle Optimization Strategy Implementation Timeline Best Practices Ppt Slide SA SS V Deliver an awe-inspiring pitch that will mesmerize everyone. Using these presentation templates you will surely catch everyones attention. You can browse the ppts collection on our website. We have researchers who are experts at creating the right content for the templates. So you do not have to invest time in any additional work. Just grab the template now and use them. Following slide showcases timeline to implement optimization strategy emphasizing continuous improvement and monitoring of sales operations.
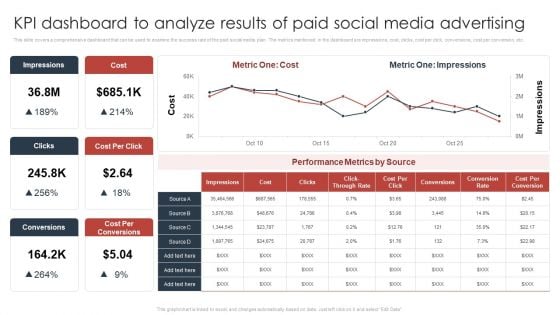
KPI Dashboard To Analyze Results Of Paid Social Media Advertising Rules PDF
This slide covers a comprehensive dashboard that can be used to examine the success rate of the paid social media plan. The metrics mentioned in the dashboard are impressions, cost, clicks, cost per click, conversions, cost per conversion, etc. Presenting this PowerPoint presentation, titled KPI Dashboard To Analyze Results Of Paid Social Media Advertising Rules PDF, with topics curated by our researchers after extensive research. This editable presentation is available for immediate download and provides attractive features when used. Download now and captivate your audience. Presenting this KPI Dashboard To Analyze Results Of Paid Social Media Advertising Rules PDF. Our researchers have carefully researched and created these slides with all aspects taken into consideration. This is a completely customizable KPI Dashboard To Analyze Results Of Paid Social Media Advertising Rules PDF that is available for immediate downloading. Download now and make an impact on your audience. Highlight the attractive features available with our PPTs.
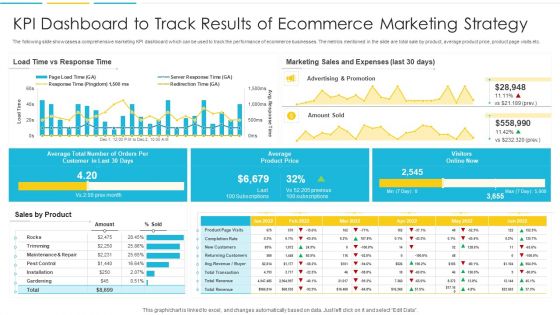
KPI Dashboard To Track Results Of Ecommerce Marketing Strategy Structure PDF
The following slide showcases a comprehensive marketing KPI dashboard which can be used to track the performance of ecommerce businesses. The metrics mentioned in the slide are total sale by product, average product price, product page visits etc. Showcasing this set of slides titled KPI Dashboard To Track Results Of Ecommerce Marketing Strategy Structure PDF. The topics addressed in these templates are Average, Customer, Marketing. All the content presented in this PPT design is completely editable. Download it and make adjustments in color, background, font etc. as per your unique business setting.
Google Keyword Assessment KPI Dashboard For Tracking Improvement In Website Traffic Infographics PDF
Following slide demonstrates keyword analysis dashboard which can be used by business to track website traffic performance. It includes metrics such as average keyword position, keyword ranking distribution, keyword ranking, keyword in top 3, top 10, top 20 and top 100. Showcasing this set of slides titled Google Keyword Assessment KPI Dashboard For Tracking Improvement In Website Traffic Infographics PDF. The topics addressed in these templates are Keyword Ranking, Keyword Ranking Distribution, Average Keyword Position. All the content presented in this PPT design is completely editable. Download it and make adjustments in color, background, font etc. as per your unique business setting.
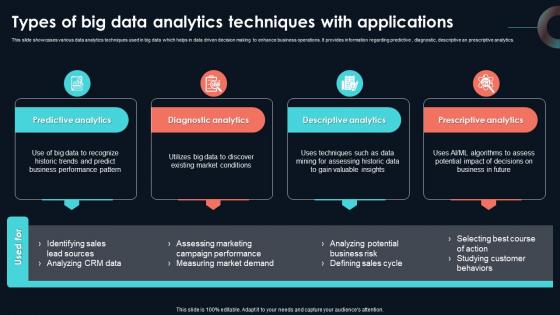
Types Of Big Data Analytics Techniques With Developing Strategic Insights Using Big Data Analytics SS V
This slide showcases various data analytics techniques used in big data which helps in data driven decision making to enhance business operations. It provides information regarding predictive , diagnostic, descriptive an prescriptive analytics. This slide showcases various data analytics techniques used in big data which helps in data driven decision making to enhance business operations. It provides information regarding predictive , diagnostic, descriptive an prescriptive analytics. Do you know about Slidesgeeks Types Of Big Data Analytics Techniques With Developing Strategic Insights Using Big Data Analytics SS V These are perfect for delivering any kind od presentation. Using it, create PowerPoint presentations that communicate your ideas and engage audiences. Save time and effort by using our pre-designed presentation templates that are perfect for a wide range of topic. Our vast selection of designs covers a range of styles, from creative to business, and are all highly customizable and easy to edit. Download as a PowerPoint template or use them as Google Slides themes. This slide showcases various data analytics techniques used in big data which helps in data driven decision making to enhance business operations. It provides information regarding predictive , diagnostic, descriptive an prescriptive analytics.
Email Marketing Dashboard Illustrating Campaign Performance Results Ppt PowerPoint Presentation File Icon PDF
Mentioned slide displays email campaign dashboard which can be used by marketers to track performance of their marketing campaigns. Marketers can track metrics such as total subscribers growth, overall bounce rate, unsubscribe rate, open rate, click rate etc. Showcasing this set of slides titled email marketing dashboard illustrating campaign performance results ppt powerpoint presentation file icon pdf. The topics addressed in these templates are marketing, list health, total subscribers, percentage. All the content presented in this PPT design is completely editable. Download it and make adjustments in color, background, font etc. as per your unique business setting.
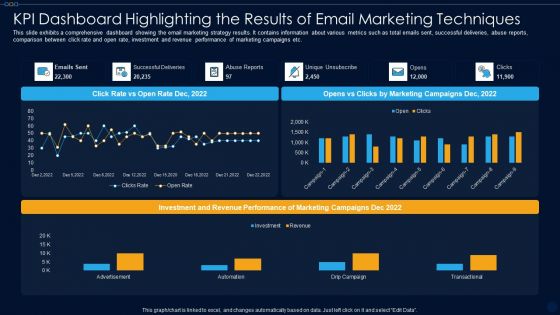
KPI Dashboard Highlighting The Results Of Email Marketing Techniques Ppt PowerPoint Presentation File Format PDF
This slide exhibits a comprehensive dashboard showing the email marketing strategy results. It contains information about various metrics such as total emails sent, successful deliveries, abuse reports, comparison between click rate and open rate, investment and revenue performance of marketing campaigns etc. Showcasing this set of slides titled kpi dashboard highlighting the results of email marketing techniques ppt powerpoint presentation file format pdf. The topics addressed in these templates are advertisement, automation, drip campaign, transactional. All the content presented in this PPT design is completely editable. Download it and make adjustments in color, background, font etc. as per your unique business setting.
Development And Operations KPI Dashboard With Central Processing Unit Statistics Icons PDF
This slide covers devops KPI metrics dashboard with central processing unit statistics about input output statistics , network traffic volume under during recorded sessions. Further, this template includes numbers of sessions with waiting time.Showcasing this set of slides titled Development And Operations KPI Dashboard With Central Processing Unit Statistics Icons PDF The topics addressed in these templates are Central Processing, Output Statistics, Resource Limits All the content presented in this PPT design is completely editable. Download it and make adjustments in color, background, font etc. as per your unique business setting.
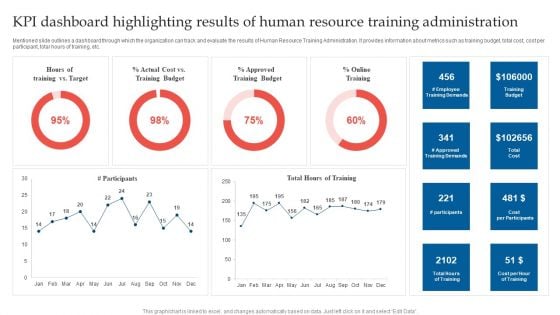
Kpi Dashboard Highlighting Results Of Human Resource Training Administration Background PDF
Mentioned slide outlines a dashboard through which the organization can track and evaluate the results of Human Resource Training Administration. It provides information about metrics such as training budget, total cost, cost per participant, total hours of training, etc. Showcasing this set of slides titled Kpi Dashboard Highlighting Results Of Human Resource Training Administration Background PDF. The topics addressed in these templates are Actual Cost Vs, Training Budget, Approved Training Budget, Online Training. All the content presented in this PPT design is completely editable. Download it and make adjustments in color, background, font etc. as per your unique business setting.
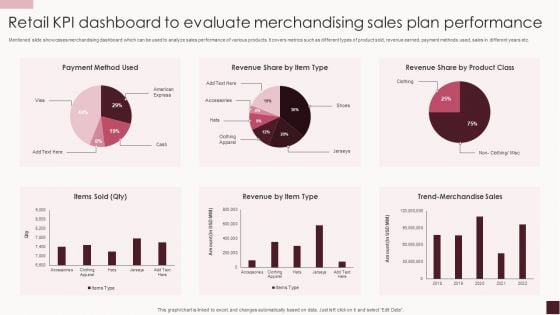
Retail KPI Dashboard To Evaluate Merchandising Sales Plan Performance Rules PDF
Mentioned slide showcases merchandising dashboard which can be used to analyze sales performance of various products. It covers metrics such as different types of product sold, revenue earned, payment methods used, sales in different years etc.Showcasing this set of slides titled Retail KPI Dashboard To Evaluate Merchandising Sales Plan Performance Rules PDF. The topics addressed in these templates are Clothing Apparel, Trend Merchandise, Items Sold. All the content presented in this PPT design is completely editable. Download it and make adjustments in color, background, font etc. as per your unique business setting.
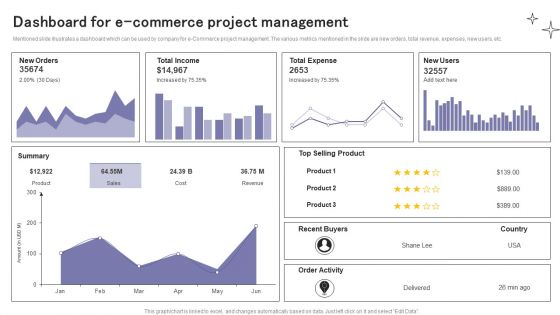
Dashboard For E Commerce Project Management Ppt Ideas Design Inspiration PDF
Mentioned slide illustrates a dashboard which can be used by company for e-Commerce project management. The various metrics mentioned in the slide are new orders, total revenue, expenses, new users, etc. Showcasing this set of slides titled Dashboard For E Commerce Project Management Ppt Ideas Design Inspiration PDF. The topics addressed in these templates are New Orders, Total Income, Total Expense. All the content presented in this PPT design is completely editable. Download it and make adjustments in color, background, font etc. as per your unique business setting.
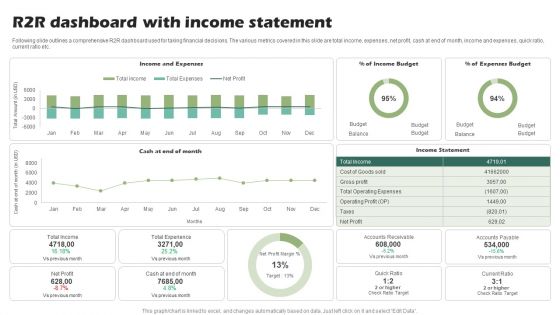
R2R Dashboard With Income Statement Ppt PowerPoint Presentation Show Slide Download PDF
Following slide outlines a comprehensive R2R dashboard used for taking financial decisions. The various metrics covered in this slide are total income, expenses, net profit, cash at end of month, income and expenses, quick ratio, current ratio etc.Showcasing this set of slides titled R2R Dashboard With Income Statement Ppt PowerPoint Presentation Show Slide Download PDF. The topics addressed in these templates are Operating Expenses, Total Experience, Accounts Receivable. All the content presented in this PPT design is completely editable. Download it and make adjustments in color, background, font etc. as per your unique business setting.
Consumer Journey Mapping Techniques Dashboard For Tracking Digital Content Performance Clipart PDF
This slide covers the KPI dashboard for analyzing online content. It includes metrics such as blog visitors, pageviews, newsletter conversion rate, new signups, new customers, etc. Showcasing this set of slides titled Consumer Journey Mapping Techniques Dashboard For Tracking Digital Content Performance Clipart PDF. The topics addressed in these templates are Purchase Amount, Customers, Tracking Digital Content Performance. All the content presented in this PPT design is completely editable. Download it and make adjustments in color, background, font etc. as per your unique business setting.
Consumer Journey Mapping Techniques Online Ad Campaign Performance Tracking Dashboard Topics PDF
This slide covers the KPI dashboard for measuring digital campaign results. It includes metrics such as Ad cost, clicks, impressions, CTR, cost per click, conversions, conversion rate, cost per click, cost per thousand impressions, etc. Showcasing this set of slides titled Consumer Journey Mapping Techniques Online Ad Campaign Performance Tracking Dashboard Topics PDF. The topics addressed in these templates are Conversation Rate, Cost Per Conversion. All the content presented in this PPT design is completely editable. Download it and make adjustments in color, background, font etc. as per your unique business setting.
Consumer Journey Mapping Techniques Referral Program Performance Tracking Dashboard Formats PDF
This slide covers the KPI dashboard for analyzing referral campaign results. It includes metrics such as total revenue generated, monthly recurring revenue, new customers, clicks, cancelled customers, paying customers, etc. Showcasing this set of slides titled Consumer Journey Mapping Techniques Referral Program Performance Tracking Dashboard Formats PDF. The topics addressed in these templates are Revenue, New Customers, Paying Customers. All the content presented in this PPT design is completely editable. Download it and make adjustments in color, background, font etc. as per your unique business setting.
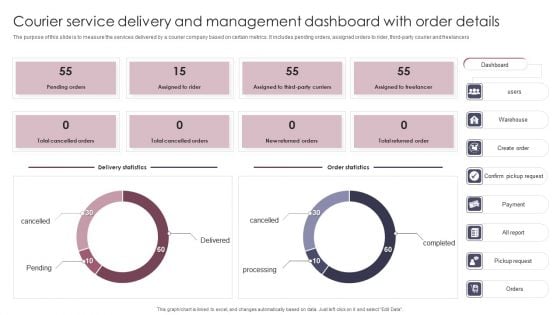
Courier Service Delivery And Management Dashboard With Order Details Summary PDF
The purpose of this slide is to measure the services delivered by a courier company based on certain metrics. It includes pending orders, assigned orders to rider, third party courier and freelancers. Showcasing this set of slides titled Courier Service Delivery And Management Dashboard With Order Details Summary PDF. The topics addressed in these templates are Management Dashboard, Courier Service Delivery. All the content presented in this PPT design is completely editable. Download it and make adjustments in color, background, font etc. as per your unique business setting.
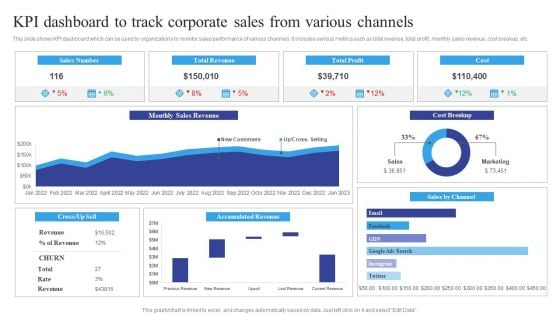
KPI Dashboard To Track Corporate Sales From Various Channels Information PDF
This slide shows KPI dashboard which can be used by organizations to monitor sales performance of various channels. It includes various metrics such as total revenue, total profit, monthly sales revenue, cost breakup, etc. Showcasing this set of slides titled KPI Dashboard To Track Corporate Sales From Various Channels Information PDF. The topics addressed in these templates are Track Corporate Sales, Various Channels. All the content presented in this PPT design is completely editable. Download it and make adjustments in color, background, font etc. as per your unique business setting.


 Continue with Email

 Home
Home


