Snapshot
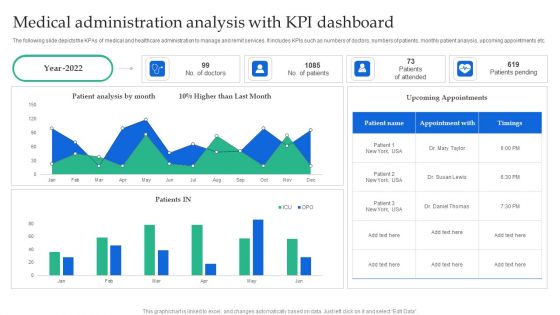
Medical Administration Analysis With KPI Dashboard Clipart PDF
The following slide depicts the KPAs of medical and healthcare administration to manage and remit services. It includes KPIs such as numbers of doctors, numbers of patients, monthly patient analysis, upcoming appointments etc. Showcasing this set of slides titled Medical Administration Analysis With KPI Dashboard Clipart PDF. The topics addressed in these templates are Patient Analysis, Higher Than, Upcoming Appointments. All the content presented in this PPT design is completely editable. Download it and make adjustments in color, background, font etc. as per your unique business setting.
Workforce Productivity Tracking Report Kpi Dashboard Icons PDF
The following slide presents the KPAs of project work stream for transparency and better decision making. It includes KPIs such as work stream status, priority check, planned vs actual budget etc. Showcasing this set of slides titled Workforce Productivity Tracking Report Kpi Dashboard Icons PDF. The topics addressed in these templates are Initiation Meeting, Resource Assessment, Technological Analysis. All the content presented in this PPT design is completely editable. Download it and make adjustments in color, background, font etc. as per your unique business setting.
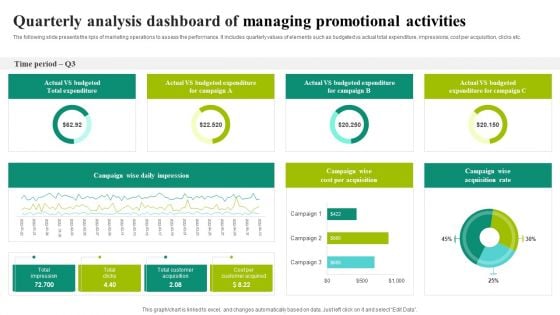
Quarterly Analysis Dashboard Of Managing Promotional Activities Ideas PDF
The following slide presents the kpis of marketing operations to assess the performance. It includes quarterly values of elements such as budgeted vs actual total expenditure, impressions, cost per acquisition, clicks etc. Showcasing this set of slides titled Quarterly Analysis Dashboard Of Managing Promotional Activities Ideas PDF. The topics addressed in these templates are Campaign Wise, Daily Impression, Total Impression, Total Clicks. All the content presented in this PPT design is completely editable. Download it and make adjustments in color, background, font etc. as per your unique business setting.
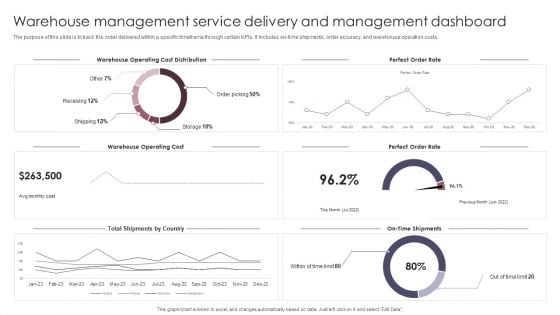
Warehouse Management Service Delivery And Management Dashboard Slides PDF
The purpose of this slide is to track the order delivered within a specific timeframe through certain KPIs. It includes on time shipments, order accuracy, and warehouse operation costs. Showcasing this set of slides titled Warehouse Management Service Delivery And Management Dashboard Slides PDF. The topics addressed in these templates are Warehouse Operating Cost, Warehouse Operating Cost Distribution. All the content presented in this PPT design is completely editable. Download it and make adjustments in color, background, font etc. as per your unique business setting.
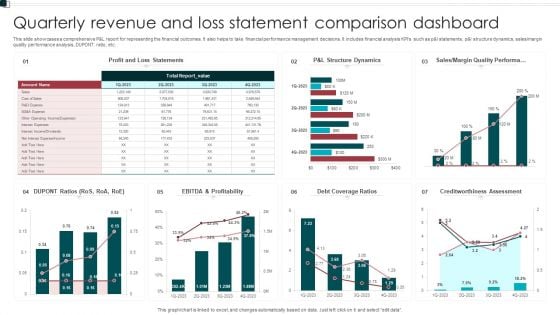
Quarterly Revenue And Loss Statement Comparison Dashboard Portrait PDF
This slide showcases a comprehensive P and L report for representing the financial outcomes. It also helps to take financial performance management decisions. It includes financial analysis KPIs such as p and l statements, p and l structure dynamics, sales or margin quality performance analysis, DUPONT ratio, etc. Showcasing this set of slides titled Quarterly Revenue And Loss Statement Comparison Dashboard Portrait PDF. The topics addressed in these templates are Profitability, Debt Coverage Ratios, Margin Quality Performa. All the content presented in this PPT design is completely editable. Download it and make adjustments in color, background, font etc. as per your unique business setting.
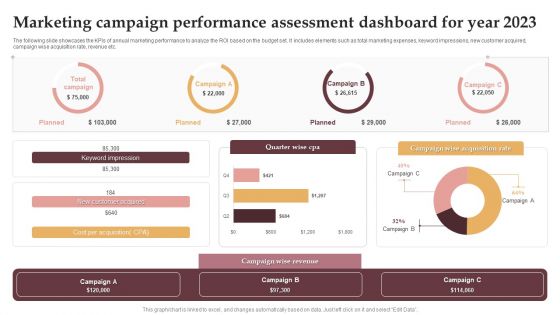
Marketing Campaign Performance Assessment Dashboard For Year 2023 Download PDF
The following slide showcases the KPIs of annual marketing performance to analyze the ROI based on the budget set. It includes elements such as total marketing expenses, keyword impressions, new customer acquired, campaign wise acquisition rate, revenue etc. Showcasing this set of slides titled Marketing Campaign Performance Assessment Dashboard For Year 2023 Download PDF. The topics addressed in these templates are Keyword Impression, New Customer Acquired, Campaign Wise Revenue. All the content presented in this PPT design is completely editable. Download it and make adjustments in color, background, font etc. as per your unique business setting.
Tracking The Cashflow Improvements With Cash Management Dashboard Download PDF
This slide showcases the KPIs that would help our business organization to track the improvements in the new cash management process. It includes quick ratio, cash balance, current ratio, days inventory outstanding, etc.Take your projects to the next level with our ultimate collection of Tracking The Cashflow Improvements With Cash Management Dashboard Download PDF. Slidegeeks has designed a range of layouts that are perfect for representing task or activity duration, keeping track of all your deadlines at a glance. Tailor these designs to your exact needs and give them a truly corporate look with your own brand colors they all make your projects stand out from the rest.
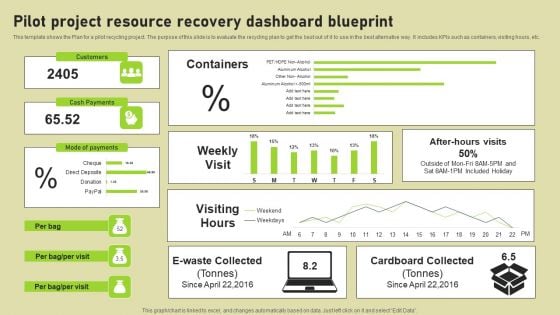
Pilot Project Resource Recovery Dashboard Blueprint Microsoft PDF
This template shows the Plan for a pilot recycling project. The purpose of this slide is to evaluate the recycling plan to get the best out of it to use in the best alternative way. It includes KPIs such as containers, visiting hours, etc. Showcasing this set of slides titled Pilot Project Resource Recovery Dashboard Blueprint Microsoft PDF. The topics addressed in these templates are Mode Of Payments, Cash Payments, Customers. All the content presented in this PPT design is completely editable. Download it and make adjustments in color, background, font etc. as per your unique business setting.

KPIs To Measure Overall Film Promotional Techniques To Increase Box Office Collection Microsoft Pdf
The following slide highlights various metrics to track and measure success and performance of marketing campaign. It presents kpis such as number of shares, reach, engagement rate, followers growth, brand sentiment, conversion rate, cost per acquisition, click through rate, retention rate, impressions, brand lift, view count, etc. Slidegeeks is here to make your presentations a breeze with KPIs To Measure Overall Film Promotional Techniques To Increase Box Office Collection Microsoft Pdf With our easy to use and customizable templates, you can focus on delivering your ideas rather than worrying about formatting. With a variety of designs to choose from, you are sure to find one that suits your needs. And with animations and unique photos, illustrations, and fonts, you can make your presentation pop. So whether you are giving a sales pitch or presenting to the board, make sure to check out Slidegeeks first The following slide highlights various metrics to track and measure success and performance of marketing campaign. It presents kpis such as number of shares, reach, engagement rate, followers growth, brand sentiment, conversion rate, cost per acquisition, click through rate, retention rate, impressions, brand lift, view count, etc.
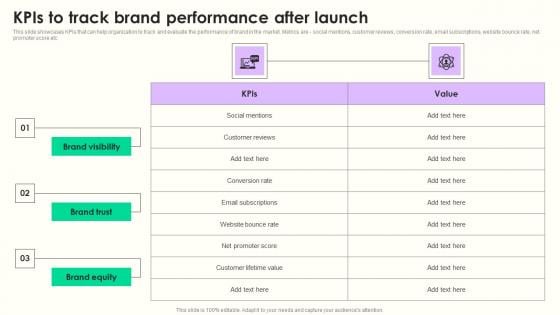
KPIs Track Brand Performance Maximizing Sales Via Online Brand Marketing Strategies Template Pdf
This slide showcases KPIs that can help organization to track and evaluate the performance of brand in the market. Metrics are social mentions, customer reviews, conversion rate, email subscriptions, website bounce rate, net promoter score etc Slidegeeks is here to make your presentations a breeze with KPIs Track Brand Performance Maximizing Sales Via Online Brand Marketing Strategies Template Pdf With our easy to use and customizable templates, you can focus on delivering your ideas rather than worrying about formatting. With a variety of designs to choose from, you are sure to find one that suits your needs. And with animations and unique photos, illustrations, and fonts, you can make your presentation pop. So whether you are giving a sales pitch or presenting to the board, make sure to check out Slidegeeks first This slide showcases KPIs that can help organization to track and evaluate the performance of brand in the market. Metrics are social mentions, customer reviews, conversion rate, email subscriptions, website bounce rate, net promoter score etc
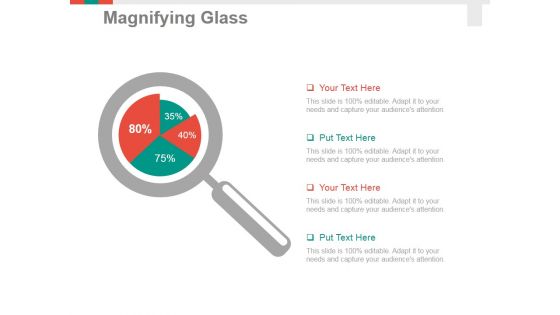
Magnifying Glass Ppt PowerPoint Presentation Pictures Graphics Design
This is a magnifying glass ppt powerpoint presentation pictures graphics design. This is a four stage process. The stages in this process are magnifier, search, marketing, analysis, business.
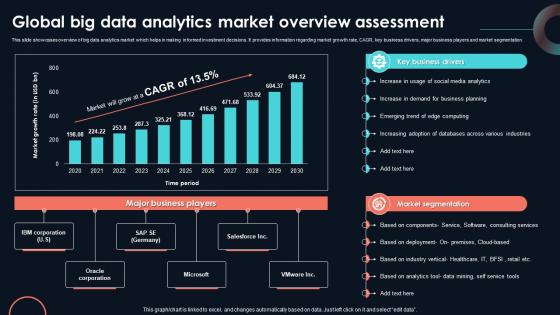
Global Big Data Analytics Market Developing Strategic Insights Using Big Data Analytics SS V
This slide showcases overview of big data analytics market which helps in making informed investment decisions. It provides information regarding market growth rate, CAGR, key business drivers, major business players and market segmentation. Slidegeeks has constructed Global Big Data Analytics Market Developing Strategic Insights Using Big Data Analytics SS V after conducting extensive research and examination. These presentation templates are constantly being generated and modified based on user preferences and critiques from editors. Here, you will find the most attractive templates for a range of purposes while taking into account ratings and remarks from users regarding the content. This is an excellent jumping-off point to explore our content and will give new users an insight into our top-notch PowerPoint Templates. This slide showcases overview of big data analytics market which helps in making informed investment decisions. It provides information regarding market growth rate, CAGR, key business drivers, major business players and market segmentation.
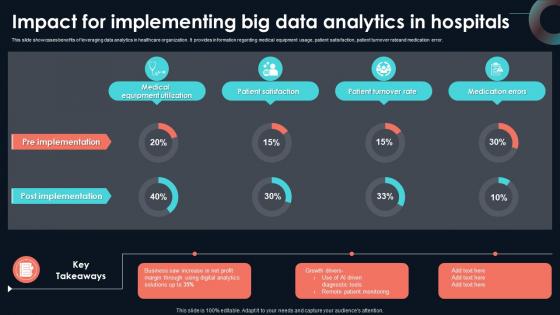
Impact For Implementing Big Data Analytics Developing Strategic Insights Using Big Data Analytics SS V
This slide showcases benefits of leveraging data analytics in healthcare organization. It provides information regarding medical equipment usage, patient satisfaction, patient turnover rateand medication error. Take your projects to the next level with our ultimate collection of Impact For Implementing Big Data Analytics Developing Strategic Insights Using Big Data Analytics SS V. Slidegeeks has designed a range of layouts that are perfect for representing task or activity duration, keeping track of all your deadlines at a glance. Tailor these designs to your exact needs and give them a truly corporate look with your own brand colors they will make your projects stand out from the rest This slide showcases benefits of leveraging data analytics in healthcare organization. It provides information regarding medical equipment usage, patient satisfaction, patient turnover rateand medication error.
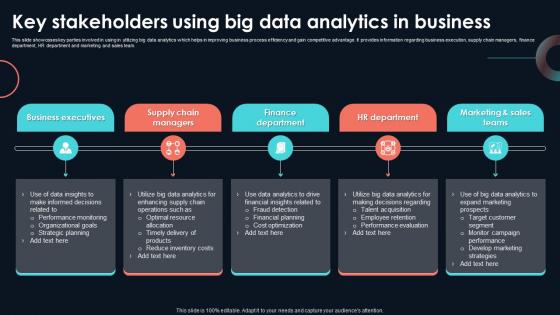
Key Stakeholders Using Big Data Analytics Developing Strategic Insights Using Big Data Analytics SS V
This slide showcases key parties involved in using in utilizing big data analytics which helps in improving business process efficiency and gain competitive advantage. It provides information regarding business execution, supply chain managers, finance department, HR department and marketing and sales team. If your project calls for a presentation, then Slidegeeks is your go-to partner because we have professionally designed, easy-to-edit templates that are perfect for any presentation. After downloading, you can easily edit Key Stakeholders Using Big Data Analytics Developing Strategic Insights Using Big Data Analytics SS V and make the changes accordingly. You can rearrange slides or fill them with different images. Check out all the handy templates This slide showcases key parties involved in using in utilizing big data analytics which helps in improving business process efficiency and gain competitive advantage. It provides information regarding business execution, supply chain managers, finance department, HR department and marketing and sales team.
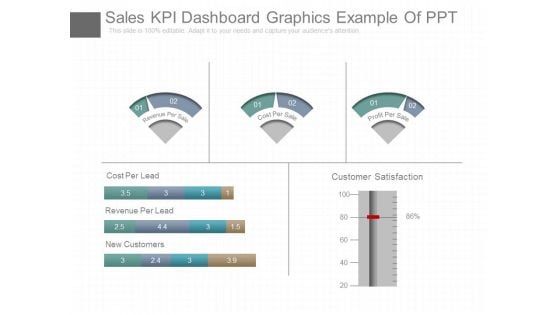
Sales Kpi Dashboard Graphics Example Of Ppt
This is a sales kpi dashboard graphics example of ppt. This is a five stage process. The stages in this process are cost per lead, revenue per lead, new customers, customer satisfaction, revenue per sale, cost per sale, profit per sale.
Corporate Key Performance Indicator Icon Inspiration PDF
Showcasing this set of slides titled Corporate Key Performance Indicator Icon Inspiration PDF. The topics addressed in these templates are Corporate Key, Performance Indicator Icon. All the content presented in this PPT design is completely editable. Download it and make adjustments in color, background, font etc. as per your unique business setting.
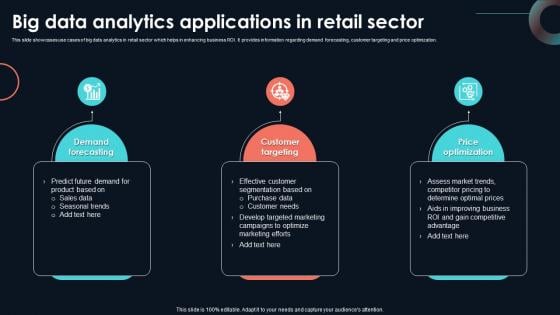
Big Data Analytics Applications In Retail Developing Strategic Insights Using Big Data Analytics SS V
This slide showcases use cases of big data analytics in retail sector which helps in enhancing business ROI. It provides information regarding demand forecasting, customer targeting and price optimization. Whether you have daily or monthly meetings, a brilliant presentation is necessary. Big Data Analytics Applications In Retail Developing Strategic Insights Using Big Data Analytics SS V can be your best option for delivering a presentation. Represent everything in detail using Big Data Analytics Applications In Retail Developing Strategic Insights Using Big Data Analytics SS V and make yourself stand out in meetings. The template is versatile and follows a structure that will cater to your requirements. All the templates prepared by Slidegeeks are easy to download and edit. Our research experts have taken care of the corporate themes as well. So, give it a try and see the results. This slide showcases use cases of big data analytics in retail sector which helps in enhancing business ROI. It provides information regarding demand forecasting, customer targeting and price optimization.
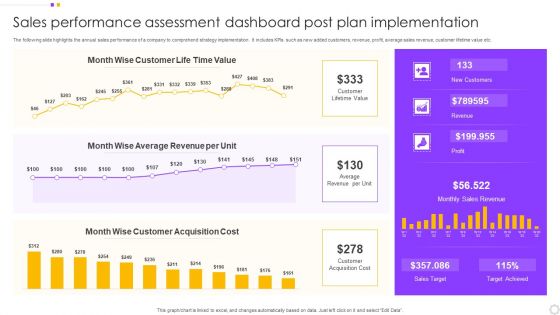
Sales Performance Assessment Dashboard Post Plan Implementation Introduction PDF
The following slide highlights the annual sales performance of a company to comprehend strategy implementation. It includes KPIs such as new added customers, revenue, profit, average sales revenue, customer lifetime value etc. Pitch your topic with ease and precision using this Sales Performance Assessment Dashboard Post Plan Implementation Introduction PDF. This layout presents information on Customer, Value, Average Revenue. It is also available for immediate download and adjustment. So, changes can be made in the color, design, graphics or any other component to create a unique layout.
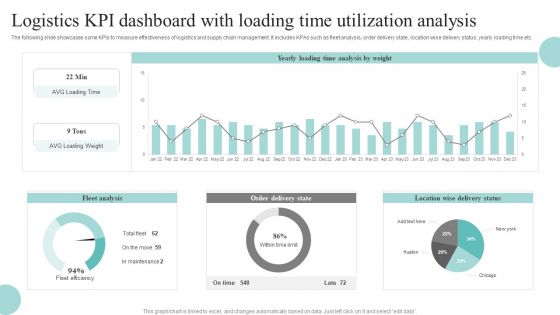
Logistics KPI Dashboard With Loading Time Utilization Analysis Download PDF
The following slide showcases some KPIs to measure effectiveness of logistics and supply chain management. It includes KPAs such as fleet analysis, order delivery state, location wise delivery status, yearly loading time etc. Pitch your topic with ease and precision using this Logistics KPI Dashboard With Loading Time Utilization Analysis Download PDF. This layout presents information on Fleet Analysis, Order Delivery State, Location Wise Delivery Status. It is also available for immediate download and adjustment. So, changes can be made in the color, design, graphics or any other component to create a unique layout.
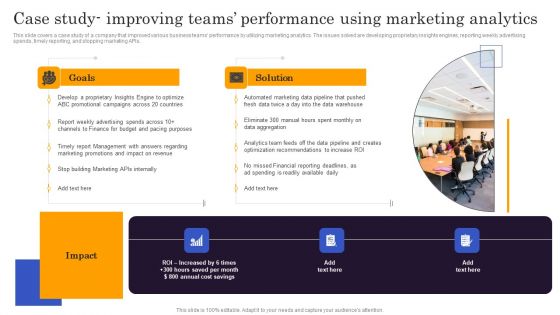
Marketers Guide To Data Analysis Optimization Case Study Improving Teams Performance Using Marketing Professional PDF
This slide covers a case study of a company that improved various business teams performance by utilizing marketing analytics. The issues solved are developing proprietary insights engines, reporting weekly advertising spends, timely reporting, and stopping marketing APIs. Make sure to capture your audiences attention in your business displays with our gratis customizable Marketers Guide To Data Analysis Optimization Case Study Improving Teams Performance Using Marketing Professional PDF. These are great for business strategies, office conferences, capital raising or task suggestions. If you desire to acquire more customers for your tech business and ensure they stay satisfied, create your own sales presentation with these plain slides.
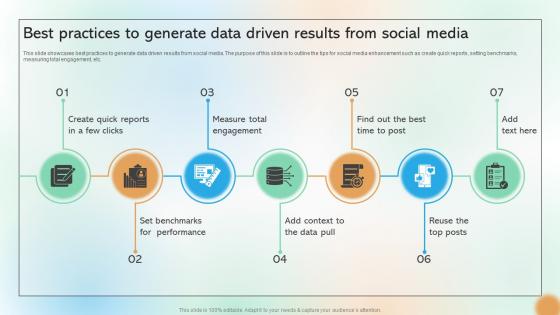
Best Practices To Generate Data Driven Results From Social Media Cracking The Code Of Social Media
This slide showcases best practices to generate data driven results from social media. The purpose of this slide is to outline the tips for social media enhancement such as create quick reports, setting benchmarks, measuring total engagement, etc. There are so many reasons you need a Best Practices To Generate Data Driven Results From Social Media Cracking The Code Of Social Media. The first reason is you can not spend time making everything from scratch, Thus, Slidegeeks has made presentation templates for you too. You can easily download these templates from our website easily. This slide showcases best practices to generate data driven results from social media. The purpose of this slide is to outline the tips for social media enhancement such as create quick reports, setting benchmarks, measuring total engagement, etc.

Steps To Be Taken After Identity Theft Data Fortification Strengthening Defenses
This slide outlines the steps to recover from identity theft. These are determining the nature of the data breach, contact the financial institution, strengthen all passwords, review freely available credit reports and monitor accounts for suspicious activity. There are so many reasons you need a Steps To Be Taken After Identity Theft Data Fortification Strengthening Defenses. The first reason is you can not spend time making everything from scratch, Thus, Slidegeeks has made presentation templates for you too. You can easily download these templates from our website easily. This slide outlines the steps to recover from identity theft. These are determining the nature of the data breach, contact the financial institution, strengthen all passwords, review freely available credit reports and monitor accounts for suspicious activity.

Brief Introduction To Data Integration For Analytics Data Analytics SS V
This slide provides an introduction to data integration aimed at helping businesses gather and consolidate data for effective decision making. It covers the description as well as benefits of implementing data integration.Welcome to our selection of the Brief Introduction To Data Integration For Analytics Data Analytics SS V. These are designed to help you showcase your creativity and bring your sphere to life. Planning and Innovation are essential for any business that is just starting out. This collection contains the designs that you need for your everyday presentations. All of our PowerPoints are 100 percent editable, so you can customize them to suit your needs. This multi-purpose template can be used in various situations. Grab these presentation templates today. This slide provides an introduction to data integration aimed at helping businesses gather and consolidate data for effective decision making. It covers the description as well as benefits of implementing data integration.

Prescriptive Analytics Software Tool IBM Decision Optimization Data Analytics SS V
This slide provides an overview of advanced analytic tool Alteryx. It covers details regarding unique selling propositions, customer reviews and pricing plans of Alteryx.The best PPT templates are a great way to save time, energy, and resources. Slidegeeks have 100 percent editable powerpoint slides making them incredibly versatile. With these quality presentation templates, you can create a captivating and memorable presentation by combining visually appealing slides and effectively communicating your message. Download Prescriptive Analytics Software Tool IBM Decision Optimization Data Analytics SS V from Slidegeeks and deliver a wonderful presentation. This slide provides an overview of advanced analytic tool Alteryx. It covers details regarding unique selling propositions, customer reviews and pricing plans of Alteryx.
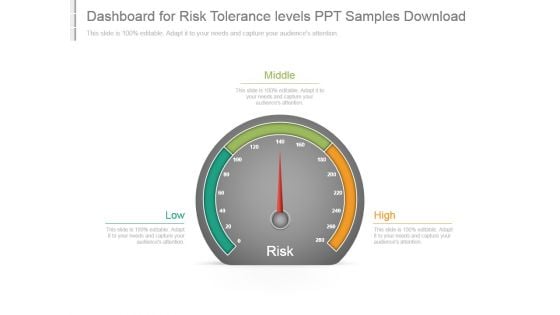
Dashboard For Risk Tolerance Levels Ppt Samples Download
This is a dashboard for risk tolerance levels ppt samples download. This is a three stage process. The stages in this process are low, middle, high, risk.
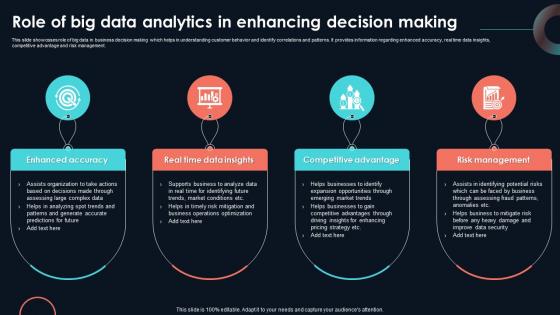
Role Of Big Data Analytics In Enhancing Developing Strategic Insights Using Big Data Analytics SS V
This slide showcases role of big data in business decision making which helps in understanding customer behavior and identify correlations and patterns. It provides information regarding enhanced accuracy, real time data insights, competitive advantage and risk management. Explore a selection of the finest Role Of Big Data Analytics In Enhancing Developing Strategic Insights Using Big Data Analytics SS V here. With a plethora of professionally designed and pre-made slide templates, you can quickly and easily find the right one for your upcoming presentation. You can use our Role Of Big Data Analytics In Enhancing Developing Strategic Insights Using Big Data Analytics SS V to effectively convey your message to a wider audience. Slidegeeks has done a lot of research before preparing these presentation templates. The content can be personalized and the slides are highly editable. Grab templates today from Slidegeeks. This slide showcases role of big data in business decision making which helps in understanding customer behavior and identify correlations and patterns. It provides information regarding enhanced accuracy, real time data insights, competitive advantage and risk management.
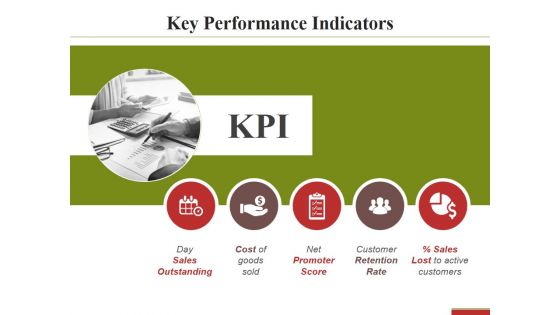
Key Performance Indicators Template 2 Ppt PowerPoint Presentation Pictures Slide
This is a key performance indicators template 2 ppt powerpoint presentation pictures slide. This is a five stage process. The stages in this process are day sales outstanding, cost of goods sold, net promoter score.
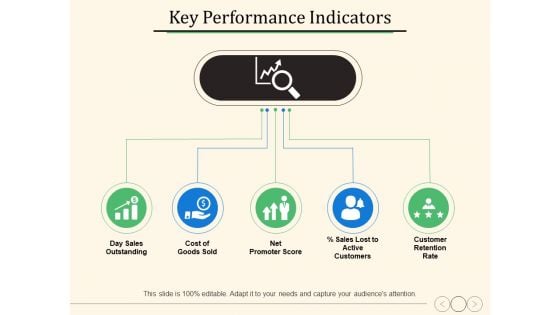
Key Performance Indicators Ppt PowerPoint Presentation Pictures Design Templates
This is a key performance indicators ppt powerpoint presentation pictures design templates. This is a five stage process. The stages in this process are day sales outstanding, cost of goods sold, customer retention rate.
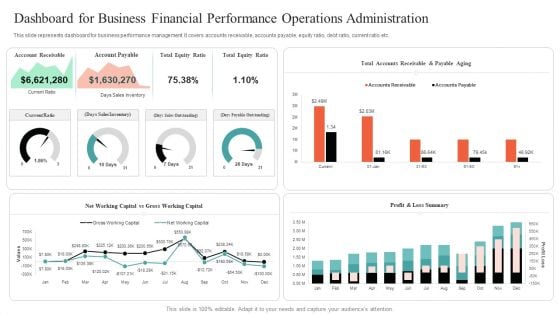
Dashboard For Business Financial Performance Operations Administration Mockup PDF
This slide represents dashboard for business performance management. It covers accounts receivable, accounts payable, equity ratio, debt ratio, current ratio etc. Showcasing this set of slides titled Dashboard For Business Financial Performance Operations Administration Mockup PDF. The topics addressed in these templates are Dashboard For Business Financial, Performance Operations Administration. All the content presented in this PPT design is completely editable. Download it and make adjustments in color, background, font etc. as per your unique business setting.
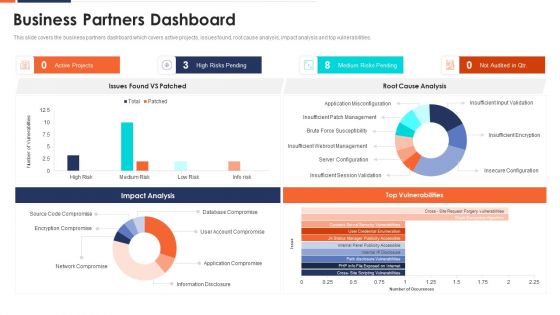
Business Partners Dashboard Ppt Professional File Formats PDF
This slide covers the business partners dashboard which covers active projects, issues found, root cause analysis, impact analysis and top vulnerabilities. Deliver an awe inspiring pitch with this creative business partners dashboard ppt professional file formats pdf bundle. Topics like business partners dashboard can be discussed with this completely editable template. It is available for immediate download depending on the needs and requirements of the user.
Business New Venture Cost Tracking Dashboard Designs PDF
This slide shows the KPI dashboard of various expenses related to startup . It includes expenses percentage, expenses category and quarterly expenses. Showcasing this set of slides titled Business New Venture Cost Tracking Dashboard Designs PDF. The topics addressed in these templates are Business New Venture, Cost Tracking Dashboard. All the content presented in this PPT design is completely editable. Download it and make adjustments in color, background, font etc. as per your unique business setting.
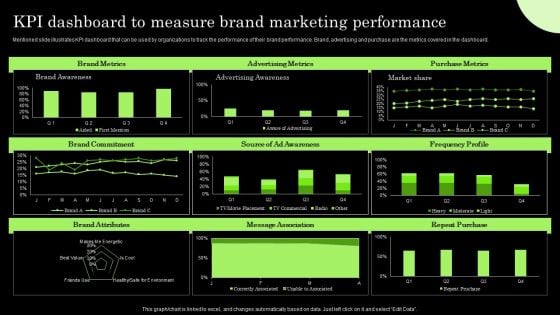
Tactical Brand Extension Launching Kpi Dashboard To Measure Brand Marketing Professional PDF
Mentioned slide illustrates KPI dashboard that can be used by organizations to track the performance of their brand performance. Brand, advertising and purchase are the metrics covered in the dashboard. Get a simple yet stunning designed Tactical Brand Extension Launching Kpi Dashboard To Measure Brand Marketing Professional PDF. It is the best one to establish the tone in your meetings. It is an excellent way to make your presentations highly effective. So, download this PPT today from Slidegeeks and see the positive impacts. Our easy-to-edit Tactical Brand Extension Launching Kpi Dashboard To Measure Brand Marketing Professional PDF can be your go-to option for all upcoming conferences and meetings. So, what are you waiting for Grab this template today.
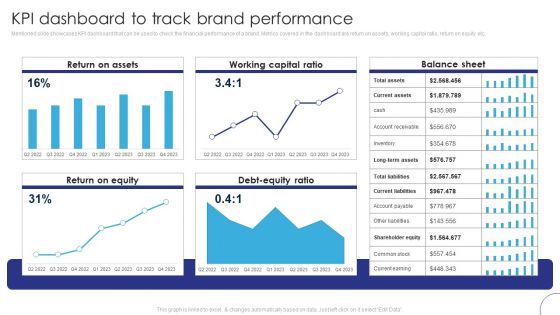
Implementing Brand Leadership Kpi Dashboard To Track Brand Performance Themes PDF
Mentioned slide showcases KPI dashboard that can be used to check the financial performance of a brand. Metrics covered in the dashboard are return on assets, working capital ratio, return on equity etc. This Implementing Brand Leadership Kpi Dashboard To Track Brand Performance Themes PDF is perfect for any presentation, be it in front of clients or colleagues. It is a versatile and stylish solution for organizing your meetings. The Implementing Brand Leadership Kpi Dashboard To Track Brand Performance Themes PDF features a modern design for your presentation meetings. The adjustable and customizable slides provide unlimited possibilities for acing up your presentation. Slidegeeks has done all the homework before launching the product for you. So, dont wait, grab the presentation templates today.
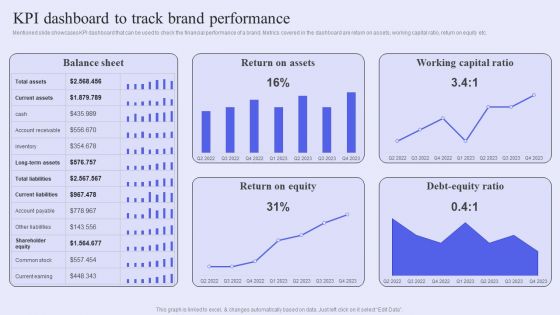
Brand Management Strategy To Increase Awareness KPI Dashboard To Track Brand Performance Slides PDF
Mentioned slide showcases KPI dashboard that can be used to check the financial performance of a brand. Metrics covered in the dashboard are return on assets, working capital ratio, return on equity etc. This Brand Management Strategy To Increase Awareness KPI Dashboard To Track Brand Performance Slides PDF is perfect for any presentation, be it in front of clients or colleagues. It is a versatile and stylish solution for organizing your meetings. The Brand Management Strategy To Increase Awareness KPI Dashboard To Track Brand Performance Slides PDF features a modern design for your presentation meetings. The adjustable and customizable slides provide unlimited possibilities for acing up your presentation. Slidegeeks has done all the homework before launching the product for you. So, dont wait, grab the presentation templates today
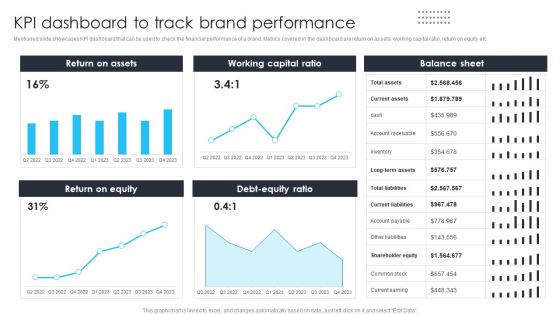
Building Brand Leadership Strategy To Dominate The Market KPI Dashboard To Track Brand Performance Formats PDF
Mentioned slide showcases KPI dashboard that can be used to check the financial performance of a brand. Metrics covered in the dashboard are return on assets, working capital ratio, return on equity etc.This Building Brand Leadership Strategy To Dominate The Market KPI Dashboard To Track Brand Performance Formats PDF is perfect for any presentation, be it in front of clients or colleagues. It is a versatile and stylish solution for organizing your meetings. The Building Brand Leadership Strategy To Dominate The Market KPI Dashboard To Track Brand Performance Formats PDF features a modern design for your presentation meetings. The adjustable and customizable slides provide unlimited possibilities for acing up your presentation. Slidegeeks has done all the homework before launching the product for you. So, dont wait, grab the presentation templates today
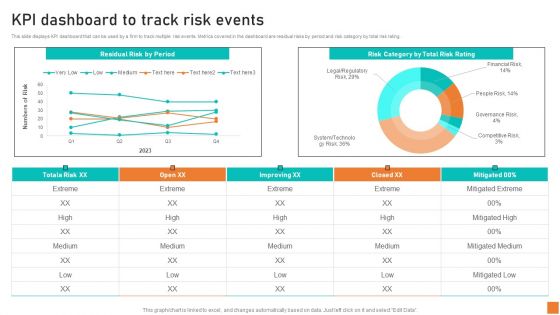
KPI Dashboard To Track Risk Events Ppt Layouts Format Ideas PDF
This slide displays KPI dashboard that can be used by a firm to track multiple risk events. Metrics covered in the dashboard are residual risks by period and risk category by total risk rating. Crafting an eye-catching presentation has never been more straightforward. Let your presentation shine with this tasteful yet straightforward KPI Dashboard To Track Risk Events Ppt Layouts Format Ideas PDF template. It offers a minimalistic and classy look that is great for making a statement. The colors have been employed intelligently to add a bit of playfulness while still remaining professional. Construct the ideal KPI Dashboard To Track Risk Events Ppt Layouts Format Ideas PDF that effortlessly grabs the attention of your audience Begin now and be certain to wow your customers
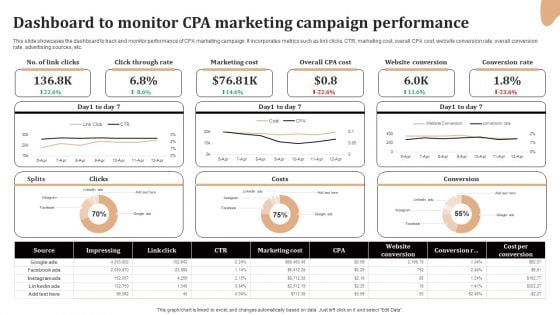
Significance Of CPA To Maximize Digital Marketing ROI Dashboard To Monitor CPA Marketing Campaign Structure PDF
This slide showcases the dashboard to track and monitor performance of CPA marketing campaign. It incorporates metrics such as link clicks, CTR, marketing cost, overall CPA cost, website conversion rate, overall conversion rate, advertising sources, etc. Presenting this PowerPoint presentation, titled Significance Of CPA To Maximize Digital Marketing ROI Dashboard To Monitor CPA Marketing Campaign Structure PDF, with topics curated by our researchers after extensive research. This editable presentation is available for immediate download and provides attractive features when used. Download now and captivate your audience. Presenting this Significance Of CPA To Maximize Digital Marketing ROI Dashboard To Monitor CPA Marketing Campaign Structure PDF. Our researchers have carefully researched and created these slides with all aspects taken into consideration. This is a completely customizable Significance Of CPA To Maximize Digital Marketing ROI Dashboard To Monitor CPA Marketing Campaign Structure PDF that is available for immediate downloading. Download now and make an impact on your audience. Highlight the attractive features available with our PPTs.
Enhancing Retail Process By Effective Inventory Management Retail Store Performance Analysis Dashboard Icons PDF
Mentioned slide displays a dashboard to assess retail store performance. Metrics included in the dashboard are net sales, average unit in retail, average basket size, sales volume by store and total visitors count. Explore a selection of the finest Enhancing Retail Process By Effective Inventory Management Retail Store Performance Analysis Dashboard Icons PDF here. With a plethora of professionally designed and pre made slide templates, you can quickly and easily find the right one for your upcoming presentation. You can use our Enhancing Retail Process By Effective Inventory Management Retail Store Performance Analysis Dashboard Icons PDF to effectively convey your message to a wider audience. Slidegeeks has done a lot of research before preparing these presentation templates. The content can be personalized and the slides are highly editable. Grab templates today from Slidegeeks.

Business Analysis Requirements Gathering Dashboard Diagram Ppt Example
This is a business analysis requirements gathering dashboard diagram ppt example. This is a five stage process. The stages in this process are business, marketing, presentation, success, management.
Data Analytics Icon For Aviation Service Download Pdf
Showcasing this set of slides titled Data Analytics Icon For Aviation Service Download Pdf. The topics addressed in these templates are Data Analytics, Aviation Service. All the content presented in this PPT design is completely editable. Download it and make adjustments in color, background, font etc. as per your unique business setting. Our Data Analytics Icon For Aviation Service Download Pdf are topically designed to provide an attractive backdrop to any subject. Use them to look like a presentation pro.
Cloud Based Big Data Analytics Ppt Portfolio Model Pdf
Showcasing this set of slides titled Cloud Based Big Data Analytics Ppt Portfolio Model Pdf. The topics addressed in these templates are Cloud Based, Big Data Analytics. All the content presented in this PPT design is completely editable. Download it and make adjustments in color, background, font etc. as per your unique business setting. Our Cloud Based Big Data Analytics Ppt Portfolio Model Pdf are topically designed to provide an attractive backdrop to any subject. Use them to look like a presentation pro.
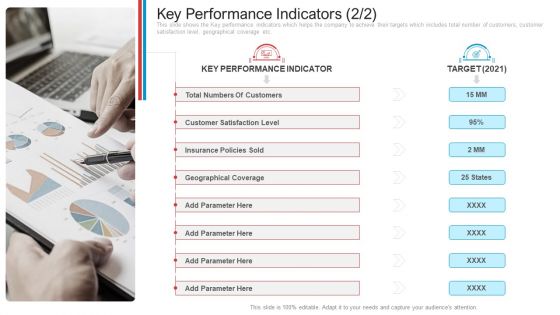
Key Performance Indicators Customers Introduction PDF
This slide shows the Key performance indicators which helps the company to achieve their targets which includes total number of customers, customer satisfaction level, geographical coverage etc. Presenting key performance indicators customers introduction pdf. to provide visual cues and insights. Share and navigate important information on seven stages that need your due attention. This template can be used to pitch topics like total numbers of customers, customer satisfaction level, insurance policies sold, geographical coverage, key performance indicator. In addtion, this PPT design contains high resolution images, graphics, etc, that are easily editable and available for immediate download.
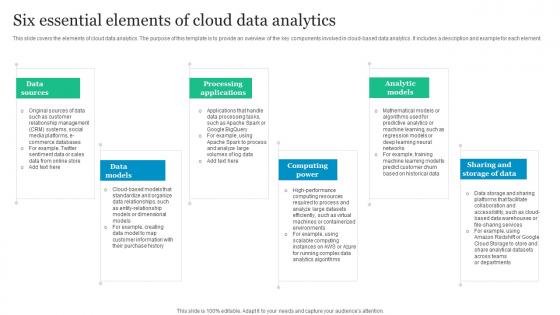
Six Essential Elements Of Cloud Data Analytics Diagrams Pdf
This slide covers the elements of cloud data analytics. The purpose of this template is to provide an overview of the key components involved in cloud based data analytics. It includes a description and example for each element. Showcasing this set of slides titled Six Essential Elements Of Cloud Data Analytics Diagrams Pdf. The topics addressed in these templates are Data Sources, Data Models, Processing Applications. All the content presented in this PPT design is completely editable. Download it and make adjustments in color, background, font etc. as per your unique business setting. This slide covers the elements of cloud data analytics. The purpose of this template is to provide an overview of the key components involved in cloud based data analytics. It includes a description and example for each element.
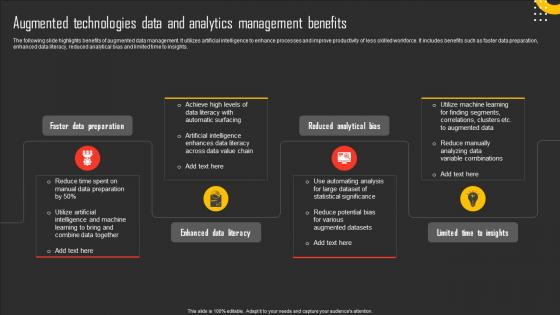
Augmented Technologies Data And Analytics Management Benefits Guidelines Pdf
The following slide highlights benefits of augmented data management. It utilizes artificial intelligence to enhance processes and improve productivity of less skilled workforce. It includes benefits such as faster data preparation, enhanced data literacy, reduced analytical bias and limited time to insights. Showcasing this set of slides titled Augmented Technologies Data And Analytics Management Benefits Guidelines Pdf. The topics addressed in these templates are Faster Data Preparation, Enhanced Data Literacy, Reduced Analytical Bias. All the content presented in this PPT design is completely editable. Download it and make adjustments in color, background, font etc. as per your unique business setting. The following slide highlights benefits of augmented data management. It utilizes artificial intelligence to enhance processes and improve productivity of less skilled workforce. It includes benefits such as faster data preparation, enhanced data literacy, reduced analytical bias and limited time to insights.
Enterprise System Business Administration Asset Tracking Dashboard Infographics PDF
This slide covers the asset tracking dashboard wherein terminal, object type, work type, number of breakdown, stoppages, etc. are tracked. Deliver and pitch your topic in the best possible manner with this enterprise system business administration asset tracking dashboard infographics pdf. Use them to share invaluable insights on asset tracking dashboard and impress your audience. This template can be altered and modified as per your expectations. So, grab it now.
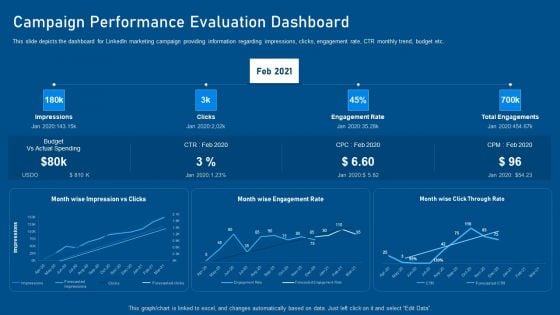
Business Promotion Using Linkedin Campaign Performance Evaluation Dashboard Topics PDF
This slide depicts the dashboard for LinkedIn marketing campaign providing information regarding impressions, clicks, engagement rate, CTR monthly trend, budget etc. Deliver an awe inspiring pitch with this creative business promotion using linkedin campaign performance evaluation dashboard topics pdf bundle. Topics like campaign performance evaluation dashboard can be discussed with this completely editable template. It is available for immediate download depending on the needs and requirements of the user.
Developing Significant Business Staff Training Effectiveness Tracking Dashboard Elements PDF
This slide provides information regarding workforce training effectiveness monitoring dashboard. The dashboard includes details such as training cost, cost per participant, number of participants, hours of training, etc. Deliver an awe inspiring pitch with this creative Developing Significant Business Staff Training Effectiveness Tracking Dashboard Elements PDF bundle. Topics like Training Cost, Cost Per Participant, Cost Per Hour can be discussed with this completely editable template. It is available for immediate download depending on the needs and requirements of the user.
Dashboard Business Marketing Ppt Powerpoint Presentation Icon Maker
This is a dashboard business marketing ppt powerpoint presentation icon maker. This is a three stage process. The stages in this process are finance, marketing, management, investment, analysis.
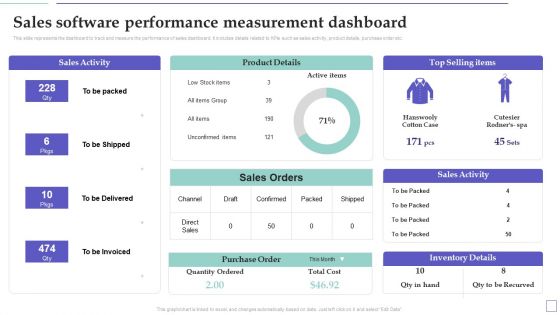
System Deployment Project Sales Software Performance Measurement Dashboard Summary PDF
This slide represents the dashboard to track and measure the performance of sales dashboard. It includes details related to KPIs such as sales activity, product details, purchase order etc. Welcome to our selection of the System Deployment Project Sales Software Performance Measurement Dashboard Summary PDF. These are designed to help you showcase your creativity and bring your sphere to life. Planning and Innovation are essential for any business that is just starting out. This collection contains the designs that you need for your everyday presentations. All of our PowerPoints are 100 percent editable, so you can customize them to suit your needs. This multi-purpose template can be used in various situations. Grab these presentation templates today.
Definitive Guide To Conduct Digital Marketing Inspection Content Performance Tracking Dashboard For Social Media Template PDF
This slide indicates the content performance tracking dashboard for social media channels providing information regarding the total number of posts, engagement rate, audience sentiments and multiple hashtags performance. This Definitive Guide To Conduct Digital Marketing Inspection Content Performance Tracking Dashboard For Social Media Template PDF from Slidegeeks makes it easy to present information on your topic with precision. It provides customization options, so you can make changes to the colors, design, graphics, or any other component to create a unique layout. It is also available for immediate download, so you can begin using it right away. Slidegeeks has done good research to ensure that you have everything you need to make your presentation stand out. Make a name out there for a brilliant performance.
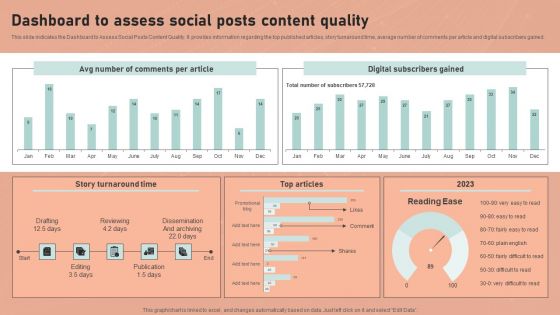
Definitive Guide To Conduct Digital Marketing Inspection Dashboard To Assess Social Posts Content Quality Summary PDF
This slide indicates the Dashboard to Assess Social Posts Content Quality. It provides information regarding the top published articles, story turnaround time, average number of comments per article and digital subscribers gained. Take your projects to the next level with our ultimate collection of Definitive Guide To Conduct Digital Marketing Inspection Dashboard To Assess Social Posts Content Quality Summary PDF. Slidegeeks has designed a range of layouts that are perfect for representing task or activity duration, keeping track of all your deadlines at a glance. Tailor these designs to your exact needs and give them a truly corporate look with your own brand colors they will make your projects stand out from the rest.
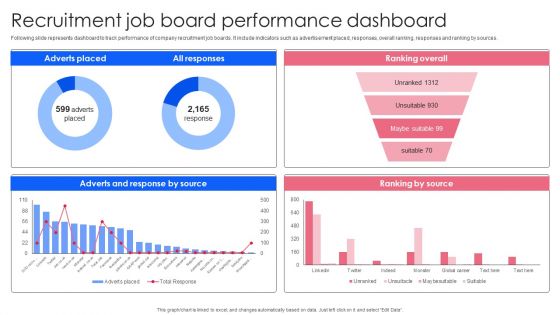
Effective Guide To Build Strong Online Hiring Strategy Recruitment Job Board Performance Dashboard Template PDF
Following slide represents dashboard to track performance of company recruitment job boards. It include indicators such as advertisement placed, responses, overall ranking, responses and ranking by sources. Present like a pro with Effective Guide To Build Strong Online Hiring Strategy Recruitment Job Board Performance Dashboard Template PDF Create beautiful presentations together with your team, using our easy to use presentation slides. Share your ideas in real time and make changes on the fly by downloading our templates. So whether you are in the office, on the go, or in a remote location, you can stay in sync with your team and present your ideas with confidence. With Slidegeeks presentation got a whole lot easier. Grab these presentations today.

Integrating CRM System For Efficient Sales Cycle Best Practices Ppt Powerpoint SA SS V
Purpose of this slide to understand CRM integration into company sales operations to improve data quality and sales revenue. Presenting this PowerPoint presentation, titled Integrating CRM System For Efficient Sales Cycle Best Practices Ppt Powerpoint SA SS V with topics curated by our researchers after extensive research. This editable presentation is available for immediate download and provides attractive features when used. Download now and captivate your audience. Presenting this Integrating CRM System For Efficient Sales Cycle Best Practices Ppt Powerpoint SA SS V Our researchers have carefully researched and created these slides with all aspects taken into consideration. This is a completely customizable Integrating CRM System For Efficient Sales Cycle Best Practices Ppt Powerpoint SA SS V that is available for immediate downloading. Download now and make an impact on your audience. Highlight the attractive features available with our PPTs. Purpose of this slide to understand CRM integration into company sales operations to improve data quality and sales revenue.
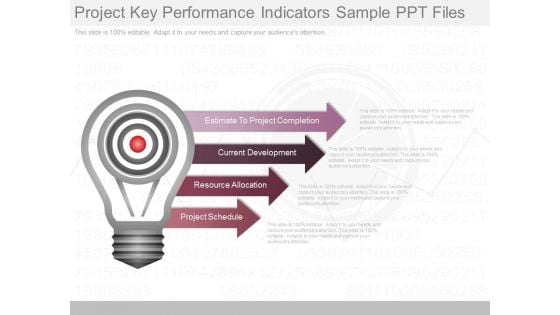
Project Key Performance Indicators Sample Ppt Files
This is a project key performance indicators sample ppt files. This is a four stage process. The stages in this process are estimate to project completion, current development, resource allocation, project schedule.
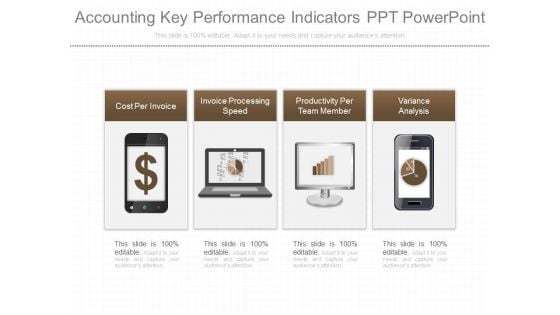
Accounting Key Performance Indicators Ppt Powerpoint
This is a accounting key performance indicators ppt powerpoint. This is a four stage process. The stages in this process are cost per invoice, invoice processing speed, productivity per team member, variance analysis.
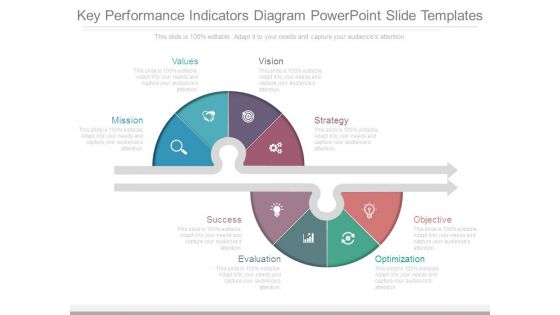
Key Performance Indicators Diagram Powerpoint Slide Templates
This is a key performance indicators diagram powerpoint slide templates. This is a eight stage process. The stages in this process are mission, values, vision, strategy, success, evaluation, optimization, objective.
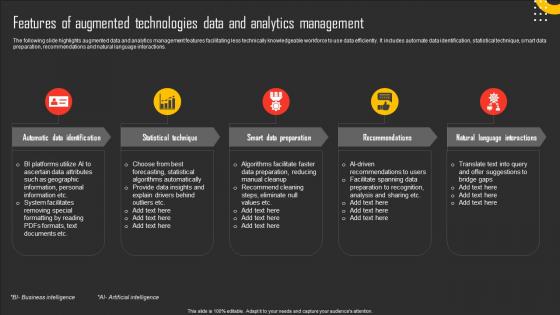
Features Of Augmented Technologies Data And Analytics Management Introduction Pdf
The following slide highlights augmented data and analytics management features facilitating less technically knowledgeable workforce to use data efficiently. It includes automate data identification, statistical technique, smart data preparation, recommendations and natural language interactions. Pitch your topic with ease and precision using this Features Of Augmented Technologies Data And Analytics Management Introduction Pdf. This layout presents information on Statistical Technique, Smart Data Preparation, Recommendations. It is also available for immediate download and adjustment. So, changes can be made in the color, design, graphics or any other component to create a unique layout. The following slide highlights augmented data and analytics management features facilitating less technically knowledgeable workforce to use data efficiently. It includes automate data identification, statistical technique, smart data preparation, recommendations and natural language interactions.
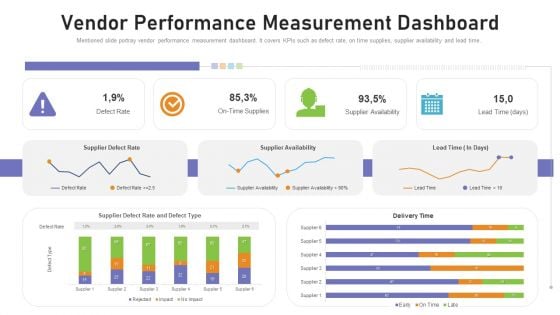
Benchmarking Supplier Operation Control Procedure Vendor Performance Measurement Dashboard Pictures PDF
Mentioned slide portray vendor performance measurement dashboard. It covers KPIs such as defect rate, on time supplies, supplier availability and lead time. Deliver an awe-inspiring pitch with this creative benchmarking supplier operation control procedure vendor performance measurement dashboard pictures pdf bundle. Topics like supplier defect rate, vendor performance, measurement dashboard can be discussed with this completely editable template. It is available for immediate download depending on the needs and requirements of the user.
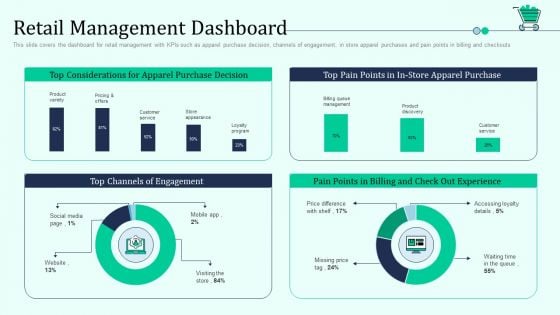
Retail Management Dashboard Retail Outlet Positioning And Merchandising Approaches Pictures PDF
This slide covers the dashboard for retail management with KPIs such as apparel purchase decision, channels of engagement, in store apparel purchases and pain points in billing and checkouts. Deliver an awe inspiring pitch with this creative retail management dashboard retail outlet positioning and merchandising approaches pictures pdf bundle. Topics like retail management dashboard can be discussed with this completely editable template. It is available for immediate download depending on the needs and requirements of the user.
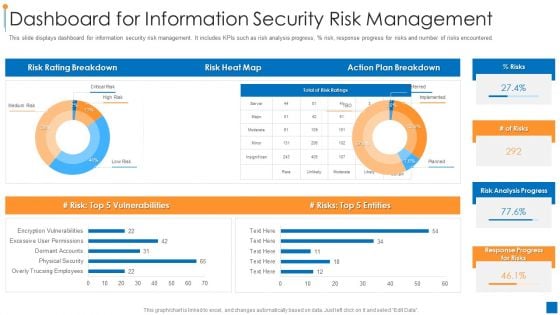
International Organization Standardization 270001 Dashboard For Information Security Risk Management Pictures PDF
This slide displays dashboard for information security risk management. It includes KPIs such as risk analysis progress, parcent risk, response progress for risks and number of risks encountered. Deliver an awe inspiring pitch with this creative international organization standardization 270001 dashboard for information security risk management pictures pdf bundle. Topics like dashboard for information security risk management can be discussed with this completely editable template. It is available for immediate download depending on the needs and requirements of the user.


 Continue with Email

 Home
Home


