Visual Analytics
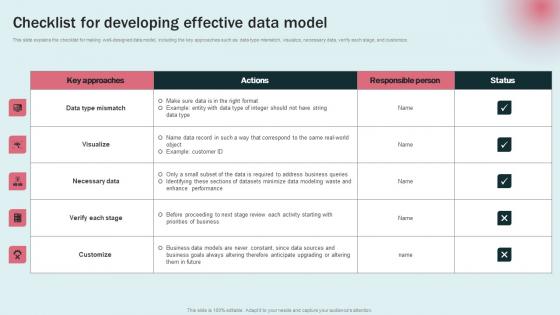
Checklist For Developing Effective Data Modeling Approaches For Modern Analytics Rules Pdf
This slide explains the checklist for making well designed data model, including the key approaches such as data type mismatch, visualize, necessary data, verify each stage, and customize. Get a simple yet stunning designed Checklist For Developing Effective Data Modeling Approaches For Modern Analytics Rules Pdf. It is the best one to establish the tone in your meetings. It is an excellent way to make your presentations highly effective. So, download this PPT today from Slidegeeks and see the positive impacts. Our easy to edit Checklist For Developing Effective Data Modeling Approaches For Modern Analytics Rules Pdf can be your go to option for all upcoming conferences and meetings. So, what are you waiting for Grab this template today. This slide explains the checklist for making well designed data model, including the key approaches such as data type mismatch, visualize, necessary data, verify each stage, and customize.
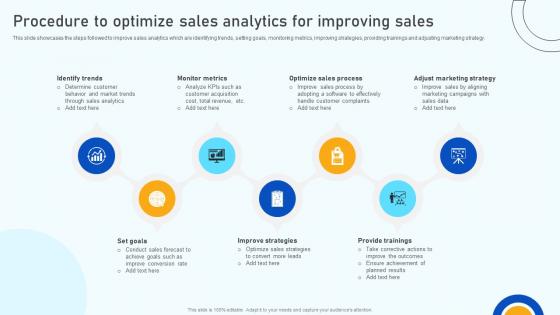
Digital Marketing Strategies Procedure To Optimize Sales Analytics For Improving Sales SA SS V
This slide showcases the steps followed to improve sales analytics which are identifying trends, setting goals, monitoring metrics, improving strategies, providing trainings and adjusting marketing strategy. This Digital Marketing Strategies Procedure To Optimize Sales Analytics For Improving Sales SA SS V from Slidegeeks makes it easy to present information on your topic with precision. It provides customization options, so you can make changes to the colors, design, graphics, or any other component to create a unique layout. It is also available for immediate download, so you can begin using it right away. Slidegeeks has done good research to ensure that you have everything you need to make your presentation stand out. Make a name out there for a brilliant performance. This slide showcases the steps followed to improve sales analytics which are identifying trends, setting goals, monitoring metrics, improving strategies, providing trainings and adjusting marketing strategy.
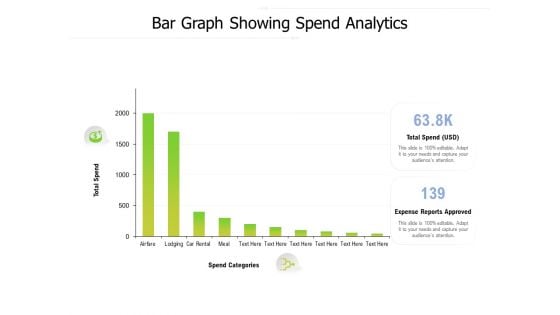
Bar Graph Showing Spend Analytics Ppt PowerPoint Presentation Infographics Graphics Pictures
Presenting this set of slides with name bar graph showing spend analytics ppt powerpoint presentation infographics graphics pictures. The topics discussed in these slide is total spend, expense reports approved, spend categories. This is a completely editable PowerPoint presentation and is available for immediate download. Download now and impress your audience.
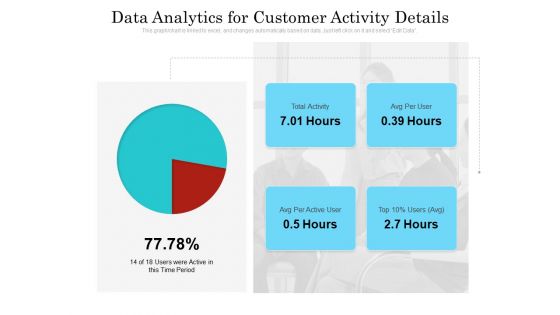
data analytics for customer activity details ppt powerpoint presentation show graphics template pdf
Presenting this set of slides with name data analytics for customer activity details ppt powerpoint presentation show graphics template pdf. The topics discussed in these slides are time period, total activity, avg per user, avg per active user. This is a completely editable PowerPoint presentation and is available for immediate download. Download now and impress your audience.

Data Analytics System Model To Make Decisions Ppt PowerPoint Presentation Summary Graphics PDF
Showcasing this set of slides titled data analytics system model to make decisions ppt powerpoint presentation summary graphics pdf. The topics addressed in these templates are collect data, analyze make decisions, communicate. All the content presented in this PPT design is completely editable. Download it and make adjustments in color, background, font etc. as per your unique business setting.
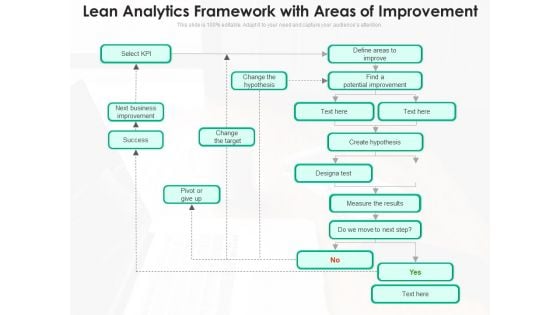
Lean Analytics Framework With Areas Of Improvement Ppt PowerPoint Presentation Model Graphics PDF
Showcasing this set of slides titled lean analytics framework with areas of improvement ppt powerpoint presentation model graphics pdf. The topics addressed in these templates are next business improvement, potential improvement, create hypothesis. All the content presented in this PPT design is completely editable. Download it and make adjustments in color, background, font etc. as per your unique business setting.
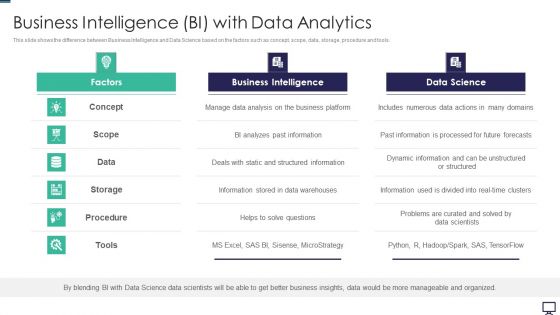
Business Intelligence BI With Data Analytics Ppt Infographic Template Graphics PDF
Deliver an awe inspiring pitch with this creative business intelligence bi with data analytics ppt infographic template graphics pdf bundle. Topics like information, analyzes, business, microstrategy can be discussed with this completely editable template. It is available for immediate download depending on the needs and requirements of the user.
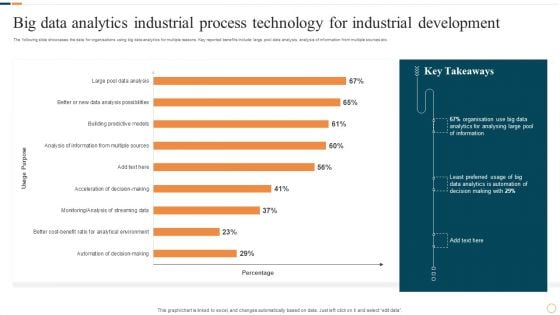
Big Data Analytics Industrial Process Technology For Industrial Development Graphics PDF
Showcasing this set of slides titled Big Data Analytics Industrial Process Technology For Industrial Development Graphics PDF. The topics addressed in these templates are Industrial Process Technology, Industrial Development . All the content presented in this PPT design is completely editable. Download it and make adjustments in color, background, font etc. as per your unique business setting.
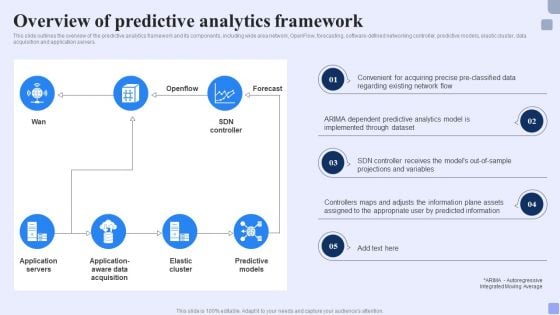
Overview Of Predictive Analytics Framework Forward Looking Analysis IT Topics PDF
This slide outlines the overview of the predictive analytics framework and its components, including wide area network, OpenFlow, forecasting, software-defined networking controller, predictive models, elastic cluster, data acquisition and application servers.If your project calls for a presentation, then Slidegeeks is your go-to partner because we have professionally designed, easy-to-edit templates that are perfect for any presentation. After downloading, you can easily edit Overview Of Predictive Analytics Framework Forward Looking Analysis IT Topics PDF and make the changes accordingly. You can rearrange slides or fill them with different images. Check out all the handy templates

Five Years Data Analytics Career Roadmap With Live Industry Projects Portrait
Presenting our jaw-dropping five years data analytics career roadmap with live industry projects portrait. You can alternate the color, font size, font type, and shapes of this PPT layout according to your strategic process. This PPT presentation is compatible with Google Slides and is available in both standard screen and widescreen aspect ratios. You can also download this well-researched PowerPoint template design in different formats like PDF, JPG, and PNG. So utilize this visually-appealing design by clicking the download button given below.
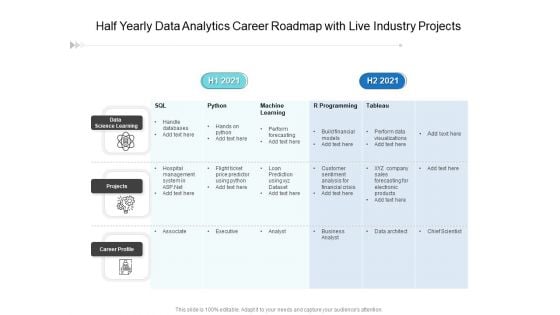
Half Yearly Data Analytics Career Roadmap With Live Industry Projects Formats
Presenting our jaw-dropping half yearly data analytics career roadmap with live industry projects formats You can alternate the color, font size, font type, and shapes of this PPT layout according to your strategic process. This PPT presentation is compatible with Google Slides and is available in both standard screen and widescreen aspect ratios. You can also download this well-researched PowerPoint template design in different formats like PDF, JPG, and PNG. So utilize this visually-appealing design by clicking the download button given below.
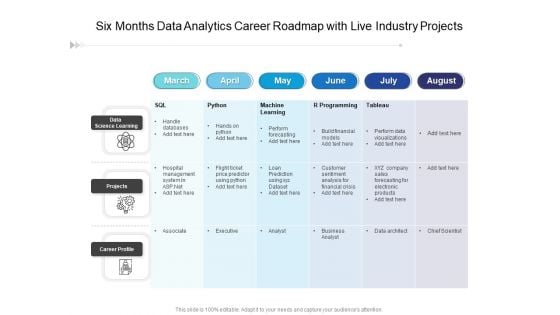
Six Months Data Analytics Career Roadmap With Live Industry Projects Demonstration
Presenting our jaw-dropping six months data analytics career roadmap with live industry projects demonstration. You can alternate the color, font size, font type, and shapes of this PPT layout according to your strategic process. This PPT presentation is compatible with Google Slides and is available in both standard screen and widescreen aspect ratios. You can also download this well-researched PowerPoint template design in different formats like PDF, JPG, and PNG. So utilize this visually-appealing design by clicking the download button given below.
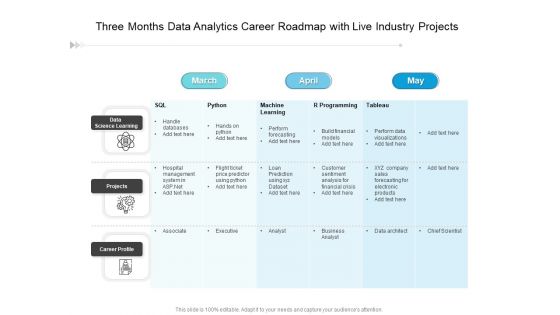
Three Months Data Analytics Career Roadmap With Live Industry Projects Elements
Presenting our jaw-dropping three months data analytics career roadmap with live industry projects elements. You can alternate the color, font size, font type, and shapes of this PPT layout according to your strategic process. This PPT presentation is compatible with Google Slides and is available in both standard screen and widescreen aspect ratios. You can also download this well-researched PowerPoint template design in different formats like PDF, JPG, and PNG. So utilize this visually-appealing design by clicking the download button given below.
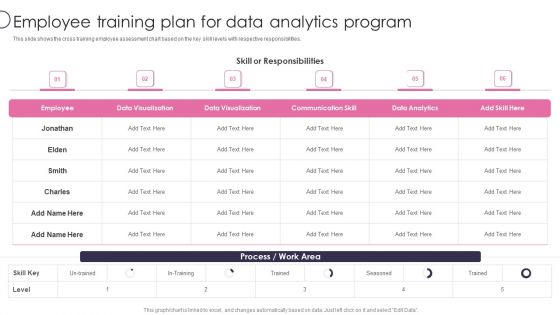
Information Transformation Process Toolkit Employee Training Plan For Data Analytics Program Information PDF
This slide shows the cross training employee assessment chart based on the key skill levels with respective responsibilities. Deliver and pitch your topic in the best possible manner with this Information Transformation Process Toolkit Employee Training Plan For Data Analytics Program Information PDF. Use them to share invaluable insights on Data Visualization, Employee, Communication Skill and impress your audience. This template can be altered and modified as per your expectations. So, grab it now.
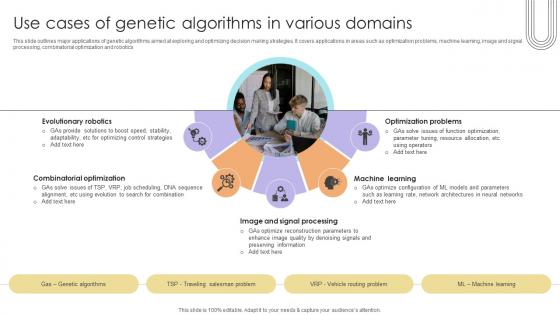
Use Cases Of Genetic Algorithms In Various Domains Data Analytics SS V
This slide outlines major applications of genetic algorithms aimed at exploring and optimizing decision making strategies. It covers applications in areas such as optimization problems, machine learning, image and signal processing, combinatorial optimization and robotics.Are you searching for a Use Cases Of Genetic Algorithms In Various Domains Data Analytics SS V that is uncluttered, straightforward, and original Its easy to edit, and you can change the colors to suit your personal or business branding. For a presentation that expresses how much effort you have put in, this template is ideal With all of its features, including tables, diagrams, statistics, and lists, its perfect for a business plan presentation. Make your ideas more appealing with these professional slides. Download Use Cases Of Genetic Algorithms In Various Domains Data Analytics SS V from Slidegeeks today. This slide outlines major applications of genetic algorithms aimed at exploring and optimizing decision making strategies. It covers applications in areas such as optimization problems, machine learning, image and signal processing, combinatorial optimization and robotics.
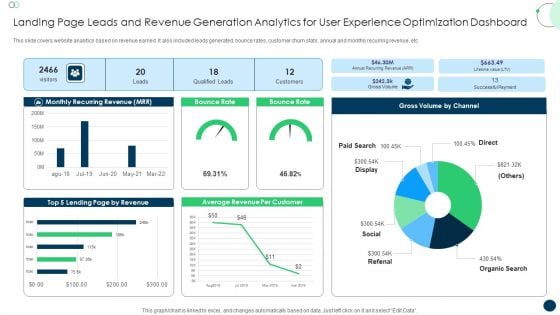
Landing Page Leads And Revenue Generation Analytics For User Experience Optimization Dashboard Formats PDF
This slide covers website analytics based on revenue earned. It also included leads generated, bounce rates, customer churn stats, annual and monthly recurring revenue, etc. Pitch your topic with ease and precision using this Landing Page Leads And Revenue Generation Analytics For User Experience Optimization Dashboard Formats PDF. This layout presents information on Monthly Recurring Revenue, Bounce Rate, Gross Volume. It is also available for immediate download and adjustment. So, changes can be made in the color, design, graphics or any other component to create a unique layout.
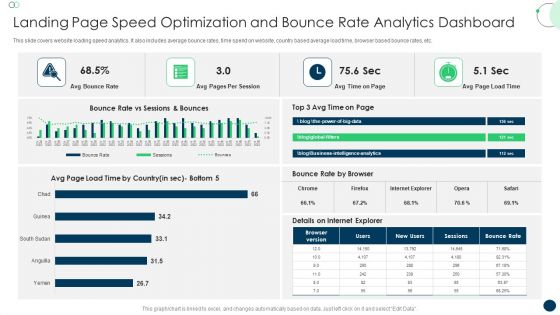
Landing Page Speed Optimization And Bounce Rate Analytics Dashboard Topics PDF
This slide covers website loading speed analytics. It also includes average bounce rates, time spend on website, country based average load time, browser based bounce rates, etc. Pitch your topic with ease and precision using this Landing Page Speed Optimization And Bounce Rate Analytics Dashboard Topics PDF. This layout presents information on Avg Bounce Rate, Avg Pages, Per Session. It is also available for immediate download and adjustment. So, changes can be made in the color, design, graphics or any other component to create a unique layout.
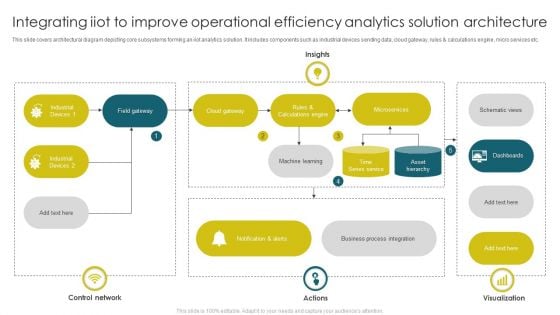
Integrating Iiot To Improve Operational Efficiency Analytics Solution Architecture Designs PDF
This slide covers architectural diagram depicting core subsystems forming an iiot analytics solution. It includes components such as industrial devices sending data, cloud gateway, rules and calculations engine, micro services etc. Pitch your topic with ease and precision using this Integrating Iiot To Improve Operational Efficiency Analytics Solution Architecture Designs PDF. This layout presents information on Field Gateway, Business Process Integration, Machine Learning. It is also available for immediate download and adjustment. So, changes can be made in the color, design, graphics or any other component to create a unique layout.
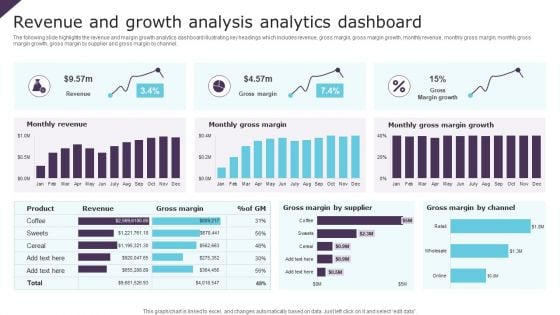
Revenue And Growth Analysis Analytics Dashboard Ppt Infographic Template Brochure PDF
The following slide highlights the revenue and margin growth analytics dashboard illustrating key headings which includes revenue, gross margin, gross margin growth, monthly revenue, monthly gross margin, monthly gross margin growth, gross margin by supplier and gross margin by channel. Pitch your topic with ease and precision using this Revenue And Growth Analysis Analytics Dashboard Ppt Infographic Template Brochure PDF. This layout presents information on Monthly Revenue, Monthly Gross Margin, Gross Margin Growth. It is also available for immediate download and adjustment. So, changes can be made in the color, design, graphics or any other component to create a unique layout.
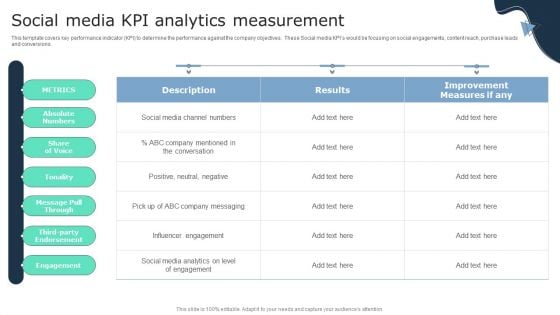
Social Media Kpi Analytics Measurement Business Social Strategy Guide Infographics PDF
This template covers key performance indicator KPI to determine the performance against the company objectives. These Social media KPIs would be focusing on social engagements, content reach, purchase leads and conversions. If you are looking for a format to display your unique thoughts, then the professionally designed Social Media Kpi Analytics Measurement Business Social Strategy Guide Infographics PDF is the one for you. You can use it as a Google Slides template or a PowerPoint template. Incorporate impressive visuals, symbols, images, and other charts. Modify or reorganize the text boxes as you desire. Experiment with shade schemes and font pairings. Alter, share or cooperate with other people on your work. Download Social Media Kpi Analytics Measurement Business Social Strategy Guide Infographics PDF and find out how to give a successful presentation. Present a perfect display to your team and make your presentation unforgettable.
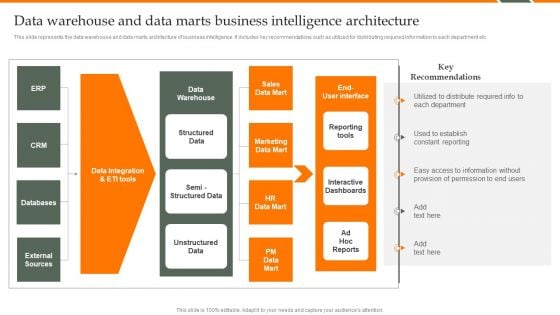
Human Resource Analytics Data Warehouse And Data Marts Business Intelligence Introduction PDF
This slide represents the data warehouse and data marts architecture of business intelligence. It includes key recommendations such as utilized for distributing required information to each department etc. If you are looking for a format to display your unique thoughts, then the professionally designed Human Resource Analytics Data Warehouse And Data Marts Business Intelligence Introduction PDF is the one for you. You can use it as a Google Slides template or a PowerPoint template. Incorporate impressive visuals, symbols, images, and other charts. Modify or reorganize the text boxes as you desire. Experiment with shade schemes and font pairings. Alter, share or cooperate with other people on your work. Download Human Resource Analytics Data Warehouse And Data Marts Business Intelligence Introduction PDF and find out how to give a successful presentation. Present a perfect display to your team and make your presentation unforgettable.
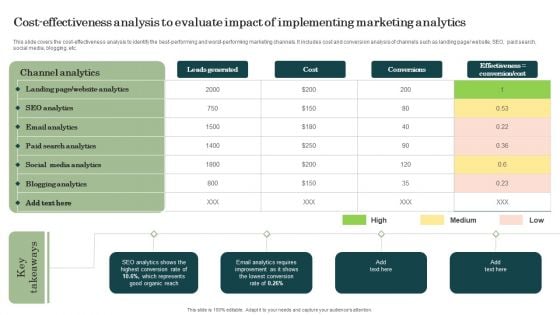
Cost Effectiveness Analysis To Evaluate Impact Of Implementing Marketing Analytics Structure PDF
This slide covers the cost-effectiveness analysis to identify the best-performing and worst-performing marketing channels. It includes cost and conversion analysis of channels such as landing page or website, SEO, paid search, social media, blogging, etc. If you are looking for a format to display your unique thoughts, then the professionally designed Cost Effectiveness Analysis To Evaluate Impact Of Implementing Marketing Analytics Structure PDF is the one for you. You can use it as a Google Slides template or a PowerPoint template. Incorporate impressive visuals, symbols, images, and other charts. Modify or reorganize the text boxes as you desire. Experiment with shade schemes and font pairings. Alter, share or cooperate with other people on your work. Download Cost Effectiveness Analysis To Evaluate Impact Of Implementing Marketing Analytics Structure PDF and find out how to give a successful presentation. Present a perfect display to your team and make your presentation unforgettable.
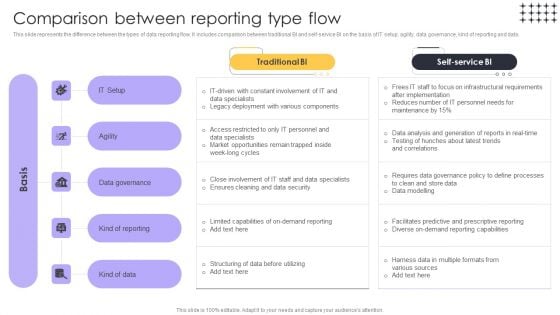
Tools For HR Business Analytics Comparison Between Reporting Type Flow Inspiration PDF
This slide represents the difference between the types of data reporting flow. It includes comparison between traditional BI and self-service BI on the basis of IT setup, agility, data governance, kind of reporting and data. If you are looking for a format to display your unique thoughts, then the professionally designed Tools For HR Business Analytics Comparison Between Reporting Type Flow Inspiration PDF is the one for you. You can use it as a Google Slides template or a PowerPoint template. Incorporate impressive visuals, symbols, images, and other charts. Modify or reorganize the text boxes as you desire. Experiment with shade schemes and font pairings. Alter, share or cooperate with other people on your work. Download Tools For HR Business Analytics Comparison Between Reporting Type Flow Inspiration PDF and find out how to give a successful presentation. Present a perfect display to your team and make your presentation unforgettable.
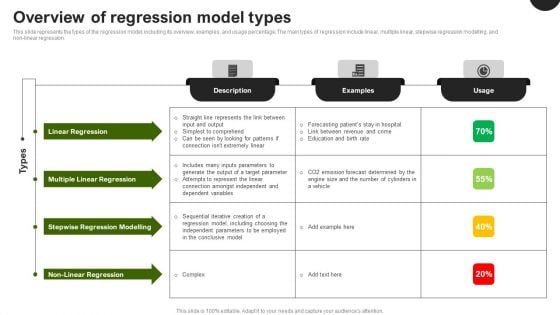
Predictive Analytics In The Age Of Big Data Overview Of Regression Model Types Diagrams PDF
This slide represents the types of the regression model, including its overview, examples, and usage percentage. The main types of regression include linear, multiple linear, stepwise regression modelling, and non-linear regression. If you are looking for a format to display your unique thoughts, then the professionally designed Predictive Analytics In The Age Of Big Data Overview Of Regression Model Types Diagrams PDF is the one for you. You can use it as a Google Slides template or a PowerPoint template. Incorporate impressive visuals, symbols, images, and other charts. Modify or reorganize the text boxes as you desire. Experiment with shade schemes and font pairings. Alter, share or cooperate with other people on your work. Download Predictive Analytics In The Age Of Big Data Overview Of Regression Model Types Diagrams PDF and find out how to give a successful presentation. Present a perfect display to your team and make your presentation unforgettable.
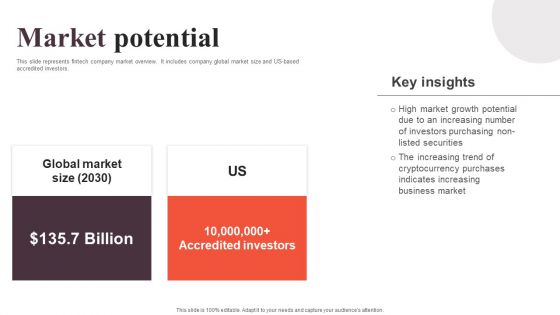
Financial Analytics Solution Investor Funding Elevator Pitch Deck Market Potential Information PDF
This slide represents fintech company market overview. It includes company global market size and US-based accredited investors. If you are looking for a format to display your unique thoughts, then the professionally designed Financial Analytics Solution Investor Funding Elevator Pitch Deck Market Potential Information PDF is the one for you. You can use it as a Google Slides template or a PowerPoint template. Incorporate impressive visuals, symbols, images, and other charts. Modify or reorganize the text boxes as you desire. Experiment with shade schemes and font pairings. Alter, share or cooperate with other people on your work. Download Financial Analytics Solution Investor Funding Elevator Pitch Deck Market Potential Information PDF and find out how to give a successful presentation. Present a perfect display to your team and make your presentation unforgettable.
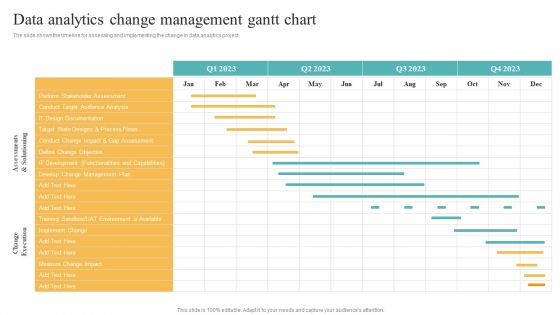
Data Analytics Change Management Gantt Chart Transformation Toolkit Competitive Intelligence Rules PDF
The slide shows the timeline for assessing and implementing the change in data analytics project. Are you in need of a template that can accommodate all of your creative concepts This one is crafted professionally and can be altered to fit any style. Use it with Google Slides or PowerPoint. Include striking photographs, symbols, depictions, and other visuals. Fill, move around, or remove text boxes as desired. Test out color palettes and font mixtures. Edit and save your work, or work with colleagues. Download Data Analytics Change Management Gantt Chart Transformation Toolkit Competitive Intelligence Rules PDF and observe how to make your presentation outstanding. Give an impeccable presentation to your group and make your presentation unforgettable.
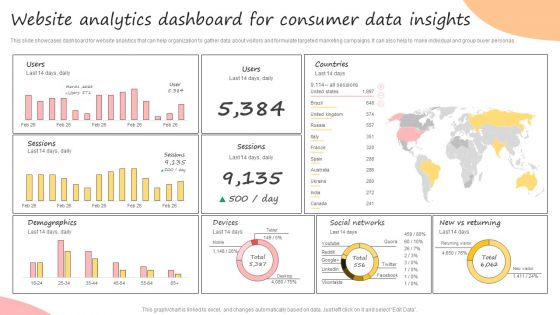
Developing Promotional Strategic Plan For Online Marketing Website Analytics Dashboard For Consumer Summary PDF
This slide showcases dashboard for website analytics that can help organization to gather data about visitors and formulate targeted marketing campaigns. It can also help to make individual and group buyer personas. Are you in need of a template that can accommodate all of your creative concepts This one is crafted professionally and can be altered to fit any style. Use it with Google Slides or PowerPoint. Include striking photographs, symbols, depictions, and other visuals. Fill, move around, or remove text boxes as desired. Test out color palettes and font mixtures. Edit and save your work, or work with colleagues. Download Developing Promotional Strategic Plan For Online Marketing Website Analytics Dashboard For Consumer Summary PDF and observe how to make your presentation outstanding. Give an impeccable presentation to your group and make your presentation unforgettable.
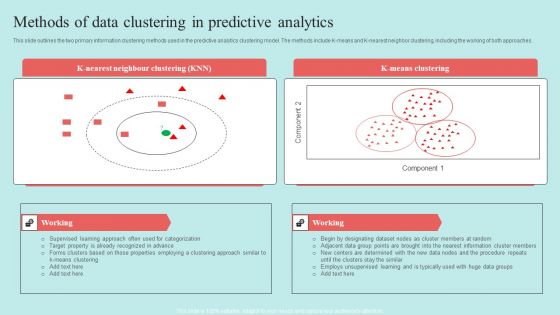
Predictive Data Model Methods Of Data Clustering In Predictive Analytics Rules PDF
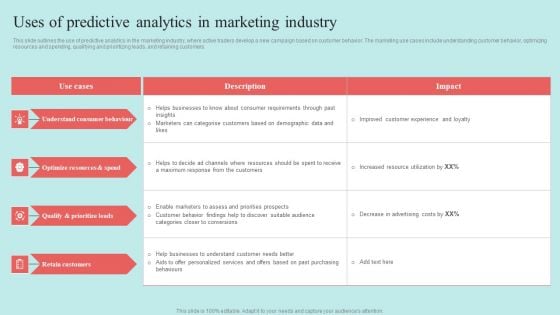
Predictive Data Model Uses Of Predictive Analytics In Marketing Industry Themes PDF
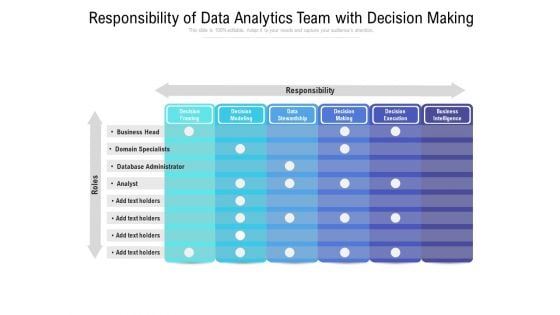
Responsibility Of Data Analytics Team With Decision Making Ppt PowerPoint Presentation File Outfit PDF
Pitch your topic with ease and precision using this responsibility of data analytics team with decision making ppt powerpoint presentation file outfit pdf. This layout presents information on business head, domain specialists, database administrator, analyst, responsibility. It is also available for immediate download and adjustment. So, changes can be made in the color, design, graphics or any other component to create a unique layout.
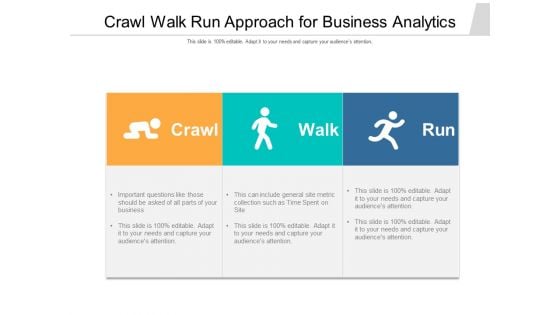
Crawl Walk Run Approach For Business Analytics Ppt PowerPoint Presentation Gallery Layout PDF
Pitch your topic with ease and precision using this crawl walk run approach for business analytics ppt powerpoint presentation gallery layout pdf. This layout presents information on crawl, walk, run. It is also available for immediate download and adjustment. So, changes can be made in the color, design, graphics or any other component to create a unique layout.
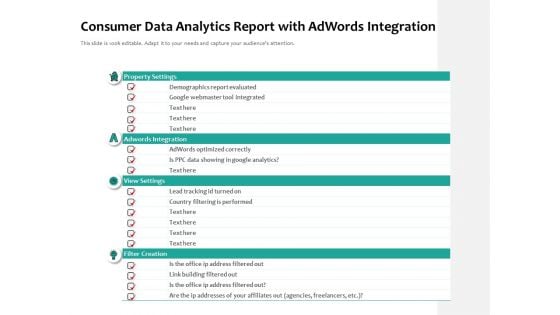
Consumer Data Analytics Report With Adwords Integration Ppt PowerPoint Presentation Gallery Sample PDF
Pitch your topic with ease and precision using this consumer data analytics report with adwords integration ppt powerpoint presentation gallery sample pdf. This layout presents information on property settings, adwords integration, view settings, filter creation. It is also available for immediate download and adjustment. So, changes can be made in the color, design, graphics or any other component to create a unique layout.
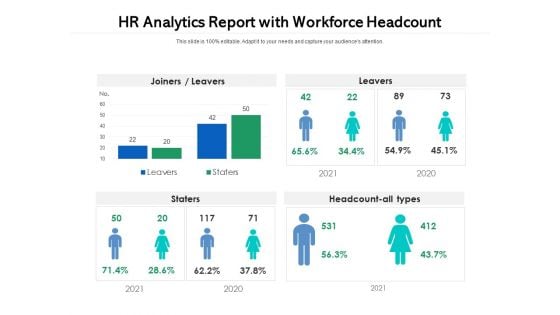
HR Analytics Report With Workforce Headcount Ppt PowerPoint Presentation File Grid PDF
Pitch your topic with ease and precision using this hr analytics report with workforce headcount ppt powerpoint presentation file grid pdf. This layout presents information on joiners leavers, staters, headcount all types. It is also available for immediate download and adjustment. So, changes can be made in the color, design, graphics or any other component to create a unique layout.
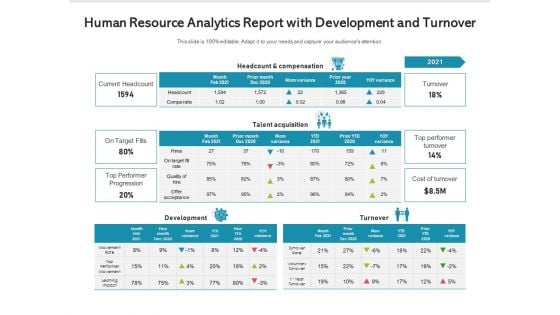
Human Resource Analytics Report With Development And Turnover Ppt PowerPoint Presentation File Layout PDF
Pitch your topic with ease and precision using this human resource analytics report with development and turnover ppt powerpoint presentation file layout pdf. This layout presents information on current headcount, on target fills, top performer progression. It is also available for immediate download and adjustment. So, changes can be made in the color, design, graphics or any other component to create a unique layout.
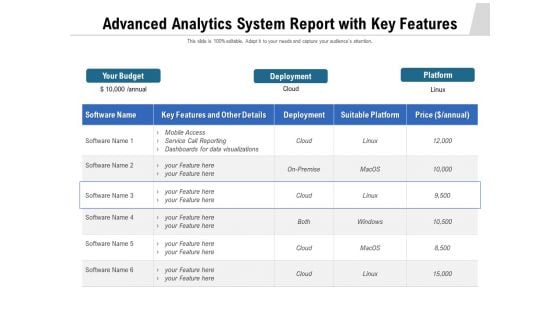
Advanced Analytics System Report With Key Features Ppt PowerPoint Presentation Show Vector PDF
Pitch your topic with ease and precision using this advanced analytics system report with key features ppt powerpoint presentation show vector pdf. This layout presents information on service call reporting, deployment, your budget. It is also available for immediate download and adjustment. So, changes can be made in the color, design, graphics or any other component to create a unique layout.
Employee Key Performance Indicators Performance Indicators Analytics And Monitoring Icon Demonstration PDF
Pitch your topic with ease and precision using this Employee Key Performance Indicators Performance Indicators Analytics And Monitoring Icon Demonstration PDF This layout presents information on Employee Key, Performance Indicators, Performance Indicators It is also available for immediate download and adjustment. So, changes can be made in the color, design, graphics or any other component to create a unique layout.
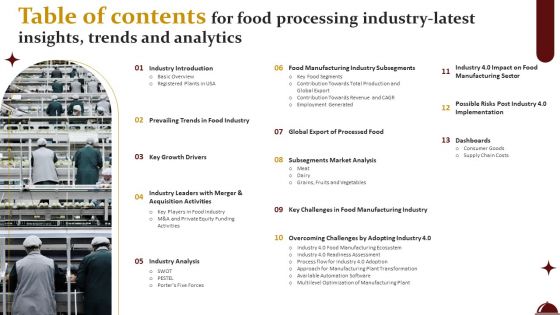
Table Of Contents For Food Processing Industry Latest Insights Trends And Analytics Graphics PDF
If your project calls for a presentation, then Slidegeeks is your go to partner because we have professionally designed, easy to edit templates that are perfect for any presentation. After downloading, you can easily edit Table Of Contents For Food Processing Industry Latest Insights Trends And Analytics Graphics PDF and make the changes accordingly. You can rearrange slides or fill them with different images. Check out all the handy templates.
Optimizing Marketing Analytics To Enhance Organizational Growth Website Landing Page KPI Tracking Dashboard Graphics PDF
This slide covers a dashboard for analysing the metrics of the website landing page. It includes KPIs such as conversions, conversion rate, sessions, bounce rate, engagement sickness, etc. Do you have an important presentation coming up Are you looking for something that will make your presentation stand out from the rest Look no further than Optimizing Marketing Analytics To Enhance Organizational Growth Website Landing Page KPI Tracking Dashboard Graphics PDF. With our professional designs, you can trust that your presentation will pop and make delivering it a smooth process. And with Slidegeeks, you can trust that your presentation will be unique and memorable. So why wait Grab Optimizing Marketing Analytics To Enhance Organizational Growth Website Landing Page KPI Tracking Dashboard Graphics PDF today and make your presentation stand out from the rest.
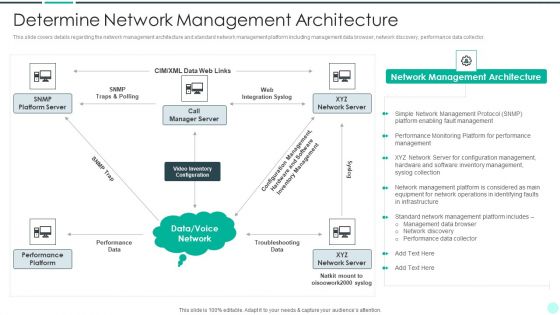
Executing Advance Data Analytics At Workspace Determine Network Management Architecture Graphics PDF
This slide covers details regarding the network management architecture and standard network management platform including management data browser, network discovery, performance data collector. Deliver an awe inspiring pitch with this creative executing advance data analytics at workspace determine network management architecture graphics pdf bundle. Topics like determine network management architecture can be discussed with this completely editable template. It is available for immediate download depending on the needs and requirements of the user.
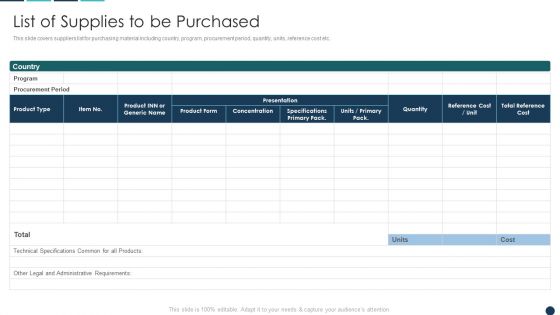
Procurement Analytics Tools And Strategies List Of Supplies To Be Purchased Graphics PDF
This slide covers suppliers list for purchasing material including country, program, procurement period, quantity, units, reference cost etc.Deliver an awe inspiring pitch with this creative Procurement Analytics Tools And Strategies List Of Supplies To Be Purchased Graphics PDF bundle. Topics like Concentration, Total Reference, Procurement Period can be discussed with this completely editable template. It is available for immediate download depending on the needs and requirements of the user.
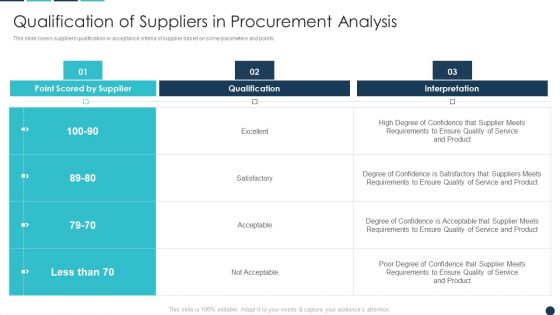
Procurement Analytics Tools And Strategies Qualification Of Suppliers In Procurement Analysis Graphics PDF
This slide covers suppliers qualification or acceptance criteria of supplier based on some parameters and points. Deliver and pitch your topic in the best possible manner with this Procurement Analytics Tools And Strategies Qualification Of Suppliers In Procurement Analysis Graphics PDF. Use them to share invaluable insights on Degree Of Confidence, Satisfactory Suppliers, Degree Confidence and impress your audience. This template can be altered and modified as per your expectations. So, grab it now.

Retail Outlet Operational Efficiency Analytics Key Retail Store Operational Areas Graphics PDF
This slide provides an overview of multiple retail store operational areas such as store administration, inventory management, customer service, sales, and marketing, etc. Deliver and pitch your topic in the best possible manner with this Retail Outlet Operational Efficiency Analytics Key Retail Store Operational Areas Graphics PDF. Use them to share invaluable insights on Inventory Management, Store Administration, Customer Service and impress your audience. This template can be altered and modified as per your expectations. So, grab it now.

Human Resource Analytics Deployment Ppt PowerPoint Presentation Complete Deck With Slides
This Human Resource Analytics Deployment Ppt PowerPoint Presentation Complete Deck With Slides is designed to help you retain your audiences attention. This content-ready PowerPoint Template enables you to take your audience on a journey and share information in a way that is easier to recall. It helps you highlight the crucial parts of your work so that the audience does not get saddled with information download. This sixty one slide PPT Deck comes prepared with the graphs and charts you could need to showcase your information through visuals. You only need to enter your own data in them. Download this editable PowerPoint Theme and walk into that meeting with confidence.

Transforming Big Data Analytics To Knowledge Ppt PowerPoint Presentation Complete Deck With Slides
This complete presentation has PPT slides on wide range of topics highlighting the core areas of your business needs. It has professionally designed templates with relevant visuals and subject driven content. This presentation deck has total of twenty one slides. Get access to the customizable templates. Our designers have created editable templates for your convenience. You can edit the colour, text and font size as per your need. You can add or delete the content if required. You are just a click to away to have this ready made presentation. Click the download button now.
Customer Behavioral Data And Analytics Ppt PowerPoint Presentation Complete With Slides
This complete presentation has PPT slides on wide range of topics highlighting the core areas of your business needs. It has professionally designed templates with relevant visuals and subject driven content. This presentation deck has total of fifty one slides. Get access to the customizable templates. Our designers have created editable templates for your convenience. You can edit the colour, text and font size as per your need. You can add or delete the content if required. You are just a click to away to have this ready made presentation. Click the download button now.
Data And Analytics Playbook Ppt PowerPoint Presentation Complete Deck With Slides
This complete presentation has PPT slides on wide range of topics highlighting the core areas of your business needs. It has professionally designed templates with relevant visuals and subject driven content. This presentation deck has total of fourty slides. Get access to the customizable templates. Our designers have created editable templates for your convenience. You can edit the colour, text and font size as per your need. You can add or delete the content if required. You are just a click to away to have this ready made presentation. Click the download button now.
Procurement Analytics Tools And Strategies Ppt PowerPoint Presentation Complete Deck With Slides
This complete presentation has PPT slides on wide range of topics highlighting the core areas of your business needs. It has professionally designed templates with relevant visuals and subject driven content. This presentation deck has total of fivty nine slides. Get access to the customizable templates. Our designers have created editable templates for your convenience. You can edit the colour, text and font size as per your need. You can add or delete the content if required. You are just a click to away to have this ready made presentation. Click the download button now.
Data Warehouse Analytics App Ppt PowerPoint Presentation Complete Deck With Slides
This complete presentation has PPT slides on wide range of topics highlighting the core areas of your business needs. It has professionally designed templates with relevant visuals and subject driven content. This presentation deck has total of eighty nine slides. Get access to the customizable templates. Our designers have created editable templates for your convenience. You can edit the colour, text and font size as per your need. You can add or delete the content if required. You are just a click to away to have this ready made presentation. Click the download button now.

Software Characteristics For Business Analytics Transformation Ppt PowerPoint Presentation Complete Deck With Slides
This complete presentation has PPT slides on wide range of topics highlighting the core areas of your business needs. It has professionally designed templates with relevant visuals and subject driven content. This presentation deck has total of sixteen slides. Get access to the customizable templates. Our designers have created editable templates for your convenience. You can edit the colour, text and font size as per your need. You can add or delete the content if required. You are just a click to away to have this ready made presentation. Click the download button now.
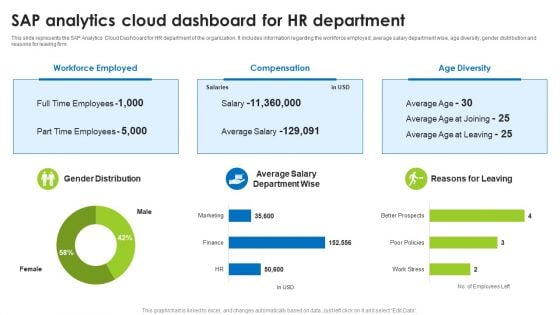
BI Technique For Data Informed Decisions Sap Analytics Cloud Dashboard For HR Department Background PDF
This slide represents the SAP Analytics Cloud Dashboard for HR department of the organization. It includes information regarding the workforce employed, average salary department wise, age diversity, gender distribution and reasons for leaving firm. This modern and well-arranged BI Technique For Data Informed Decisions Sap Analytics Cloud Dashboard For HR Department Background PDF provides lots of creative possibilities. It is very simple to customize and edit with the Powerpoint Software. Just drag and drop your pictures into the shapes. All facets of this template can be edited with Powerpoint no extra software is necessary. Add your own material, put your images in the places assigned for them, adjust the colors, and then you can show your slides to the world, with an animated slide included.
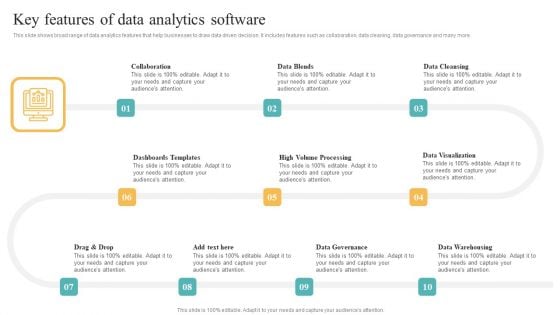
Transformation Toolkit Competitive Intelligence Information Analysis Key Features Of Data Analytics Software Elements PDF
This slide shows broad range of data analytics features that help businesses to draw data driven decision. It includes features such as collaboration, data cleaning, data governance and many more. This modern and well arranged Transformation Toolkit Competitive Intelligence Information Analysis Key Features Of Data Analytics Software Elements PDF provides lots of creative possibilities. It is very simple to customize and edit with the Powerpoint Software. Just drag and drop your pictures into the shapes. All facets of this template can be edited with Powerpoint no extra software is necessary. Add your own material, put your images in the places assigned for them, adjust the colors, and then you can show your slides to the world, with an animated slide included.
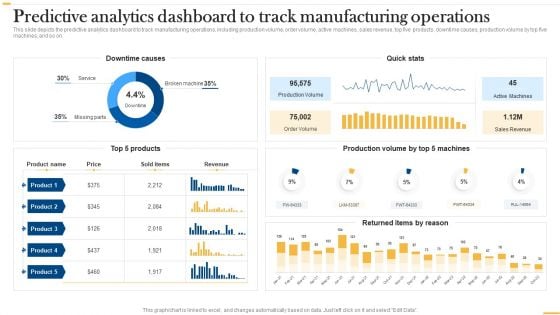
Deploying Ai To Enhance Predictive Analytics Dashboard To Track Manufacturing Guidelines PDF
This slide depicts the predictive analytics dashboard to track manufacturing operations, including production volume, order volume, active machines, sales revenue, top five products, downtime causes, production volume by top five machines, and so on. This modern and well-arranged Deploying Ai To Enhance Predictive Analytics Dashboard To Track Manufacturing Guidelines PDF provides lots of creative possibilities. It is very simple to customize and edit with the Powerpoint Software. Just drag and drop your pictures into the shapes. All facets of this template can be edited with Powerpoint, no extra software is necessary. Add your own material, put your images in the places assigned for them, adjust the colors, and then you can show your slides to the world, with an animated slide included.
Online Marketing Analytics To Enhance Business Growth Tracking Social Media Content Reach For Better Template PDF
This slide covers an overview of social media content reach to identify the number of people who see your content, either ads or posts. It also includes improvement strategies such as producing high-quality content, increasing the number of images, etc. Whether you have daily or monthly meetings, a brilliant presentation is necessary. Online Marketing Analytics To Enhance Business Growth Tracking Social Media Content Reach For Better Template PDF can be your best option for delivering a presentation. Represent everything in detail using Online Marketing Analytics To Enhance Business Growth Tracking Social Media Content Reach For Better Template PDF and make yourself stand out in meetings. The template is versatile and follows a structure that will cater to your requirements. All the templates prepared by Slidegeeks are easy to download and edit. Our research experts have taken care of the corporate themes as well. So, give it a try and see the results.
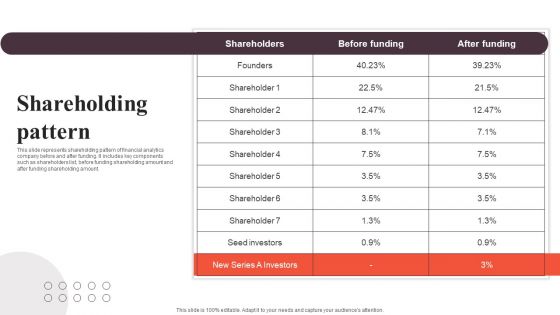
Financial Analytics Solution Investor Funding Elevator Pitch Deck Shareholding Pattern Pictures PDF
This slide represents shareholding pattern of financial analytics company before and after funding. It includes key components such as shareholders list, before funding shareholding amount and after funding shareholding amount. This modern and well arranged Financial Analytics Solution Investor Funding Elevator Pitch Deck Shareholding Pattern Pictures PDF provides lots of creative possibilities. It is very simple to customize and edit with the Powerpoint Software. Just drag and drop your pictures into the shapes. All facets of this template can be edited with Powerpoint no extra software is necessary. Add your own material, put your images in the places assigned for them, adjust the colors, and then you can show your slides to the world, with an animated slide included.
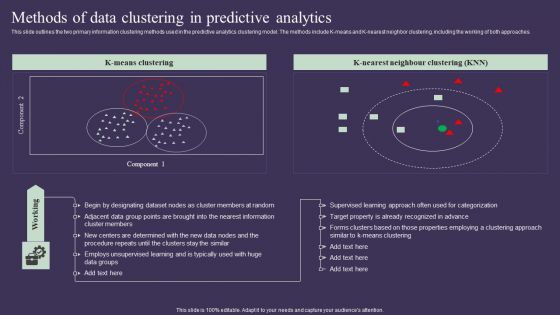
Projection Model Methods Of Data Clustering In Predictive Analytics Formats PDF
This slide outlines the two primary information clustering methods used in the predictive analytics clustering model. The methods include K-means and K-nearest neighbor clustering, including the working of both approaches. This modern and well-arranged Projection Model Methods Of Data Clustering In Predictive Analytics Formats PDF provides lots of creative possibilities. It is very simple to customize and edit with the Powerpoint Software. Just drag and drop your pictures into the shapes. All facets of this template can be edited with Powerpoint, no extra software is necessary. Add your own material, put your images in the places assigned for them, adjust the colors, and then you can show your slides to the world, with an animated slide included.
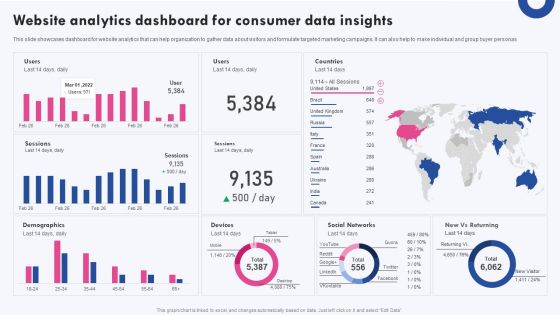
Targeted Marketing Campaigns To Improve Buyers Experience Website Analytics Dashboard For Consumer Infographics PDF
This slide showcases dashboard for website analytics that can help organization to gather data about visitors and formulate targeted marketing campaigns. It can also help to make individual and group buyer personas This modern and well arranged Targeted Marketing Campaigns To Improve Buyers Experience Website Analytics Dashboard For Consumer Infographics PDF provides lots of creative possibilities. It is very simple to customize and edit with the Powerpoint Software. Just drag and drop your pictures into the shapes. All facets of this template can be edited with Powerpoint no extra software is necessary. Add your own material, put your images in the places assigned for them, adjust the colors, and then you can show your slides to the world, with an animated slide included.
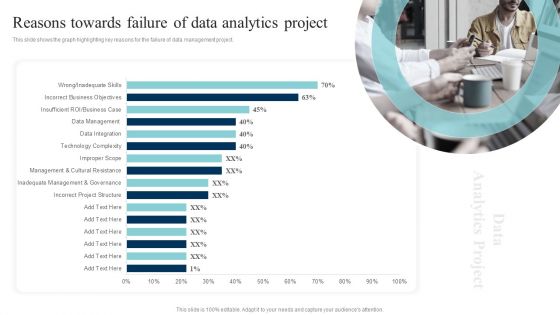
Data Evaluation And Processing Toolkit Reasons Towards Failure Of Data Analytics Project Designs PDF
This slide shows the graph highlighting key reasons for the failure of data management project. If your project calls for a presentation, then Slidegeeks is your go-to partner because we have professionally designed, easy-to-edit templates that are perfect for any presentation. After downloading, you can easily edit Data Evaluation And Processing Toolkit Reasons Towards Failure Of Data Analytics Project Designs PDF and make the changes accordingly. You can rearrange slides or fill them with different images. Check out all the handy templates.
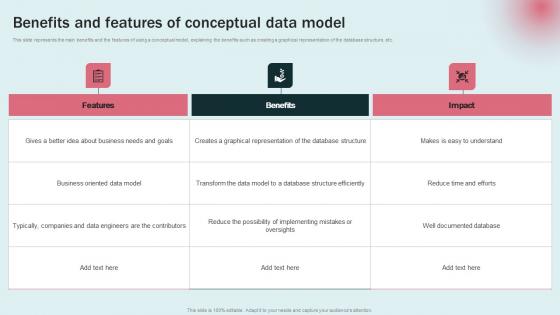
Benefits And Features Conceptual Data Modeling Approaches For Modern Analytics Sample Pdf
This slide represents the main benefits and the features of using a conceptual model, explaining the benefits such as creating a graphical representation of the database structure, etc. Create an editable Benefits And Features Conceptual Data Modeling Approaches For Modern Analytics Sample Pdf that communicates your idea and engages your audience. Whether you are presenting a business or an educational presentation, pre designed presentation templates help save time. Benefits And Features Conceptual Data Modeling Approaches For Modern Analytics Sample Pdf is highly customizable and very easy to edit, covering many different styles from creative to business presentations. Slidegeeks has creative team members who have crafted amazing templates. So, go and get them without any delay. This slide represents the main benefits and the features of using a conceptual model, explaining the benefits such as creating a graphical representation of the database structure, etc.
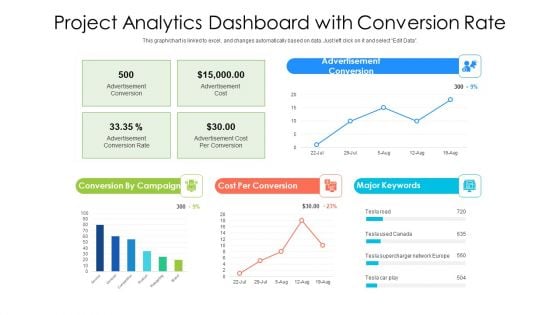
Project Analytics Dashboard With Conversion Rate Ppt PowerPoint Presentation File Deck PDF
Pitch your topic with ease and precision using this project analytics dashboard with conversion rate ppt powerpoint presentation gallery graphics template pdf. This layout presents information on cost per conversion, supercharger network, advertisement conversion, conversion by campaign. It is also available for immediate download and adjustment. So, changes can be made in the color, design, graphics or any other component to create a unique layout.
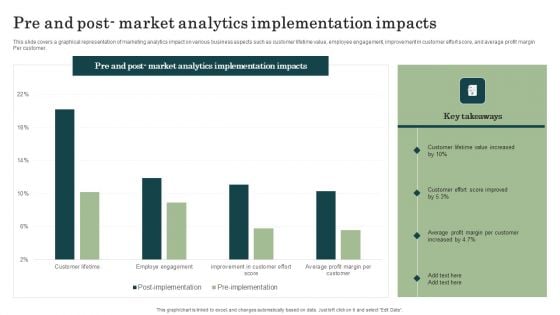
Marketing Success Metrics Pre And Post Market Analytics Implementation Information PDF
This slide covers a graphical representation of marketing analytics impact on various business aspects such as customer lifetime value, employee engagement, improvement in customer effort score, and average profit margin Per customer. Do you know about Slidesgeeks Marketing Success Metrics Pre And Post Market Analytics Implementation Information PDF These are perfect for delivering any kind od presentation. Using it, create PowerPoint presentations that communicate your ideas and engage audiences. Save time and effort by using our pre-designed presentation templates that are perfect for a wide range of topic. Our vast selection of designs covers a range of styles, from creative to business, and are all highly customizable and easy to edit. Download as a PowerPoint template or use them as Google Slides themes.


 Continue with Email

 Home
Home


