

 Home
Home 
SlideGeeks
-
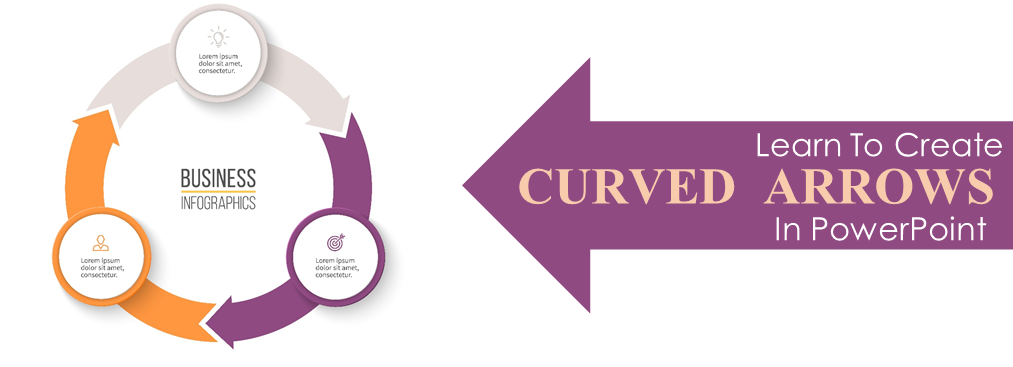
13 Steps to Create an Easy Cyclic Arrow Diagram in PowerPoint
Creating a presentation can be very intimidating. Especially when you have a deadline to meet and you want to create something that is engaging and professional at the same time. Fret not! We have a quick fix. How about we teach you to create a cyclic arrow diagram in PowerPoint... SlideGeeks
January 31 2019
SlideGeeks
January 31 2019
-

How To Highlight Portion Of An Image Using Stand Out Effect In PowerPoint: Step-By-Step Tutorial
Stand Out Effect- A simple trick to transform your usual boring presentation into a nonlinear format, taking your audience and viewers on an unforgettable journey that they will relish throughout their lives!
SlideGeeks
September 3 2019
-

10 Ultimate Data Visualization Techniques to Make your PowerPoint Presentation Stand Out!
We all know that we must use applying charts, bar graphs and pie charts etc. to represent data. However simple charts and graphs are a thing of the past. You need to add something extra in your presentations to create a jaw-dropping effect. Therefore, SlideGeeks has come up with these 10 data visualization techniques or tricks to make your PowerPoint stand out from the crowd!
SlideGeeks
June 14 2019
-

How to Design a Location Pin Icon in PowerPoint
As humans, we need quick and easy methods to process complex information since nobody has a lot of time to read through and understand complicated concepts. And that’s precisely what an icon does! It helps you to interpret and process the most complicated concepts quickly and easily making it very...
SlideGeeks
November 14 2019
-

Learn To Create The Paint Brush Effect In PowerPoint
PowerPoint is a very powerful tool. If used properly it can turn your boring presentation slides into something dynamic and out of the world. In this tutorial, you will discover the secret of achieving a paint brush effect in PowerPoint to add that creative appeal to your presentation that it might be lacking!
SlideGeeks
September 24 2019
-

How to Design a Magnifying Glass Icon in PowerPoint
Using the right visuals can make a lot of difference to your presentation. In fact, they can transform an altogether boring presentation and turn it into an exciting one without putting too much of an effort. They also strike the right chord by acting as visual metaphors to explain the...
SlideGeeks
November 11 2019
-
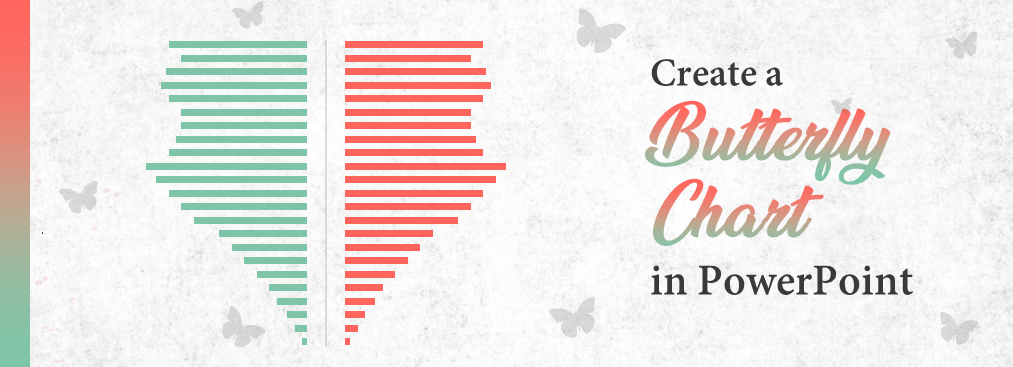
Learn To Create A Tornado/ Butterfly Chart In PowerPoint
A Butterfly Chart, also known as Tornado Chart, is a type of stacked bar chart which gives a quick glance of the difference between two groups of data with the same parameters. Follow this tutorial to create a Butterfly/ Tornado Chart using only PowerPoint.
SlideGeeks
October 9 2019
-

How to Visually Enhance Pictures in PowerPoint
No matter how good an orator you are, nothing can beat the power of good visuals in a PowerPoint presentation. After all, images are held by our human mind in a much greater percentage than that of text. So, doesn’t it make pictures an integral part of our presentation? Of...
SlideGeeks
February 18 2019
-
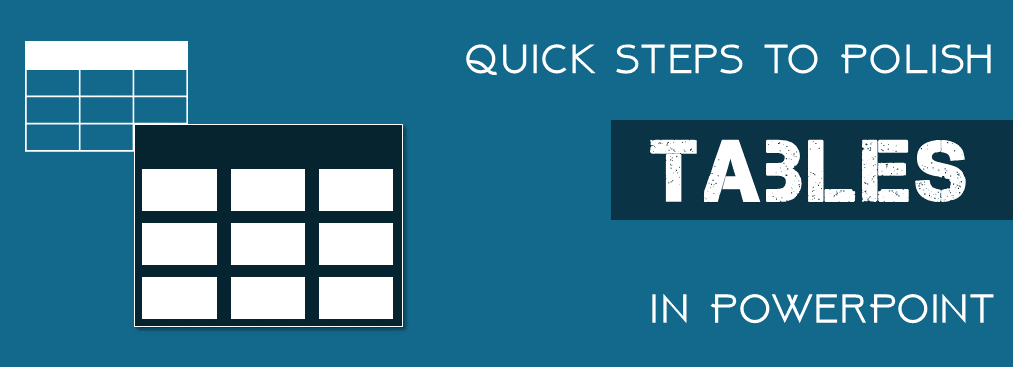
9 Simple Tricks To Kick PowerPoint Tables A Notch Up
Setting a table correctly is of extreme importance to make the presentation look neat and polished. Follow these tips and tricks to bring order to your haphazard tables and present with utmost confidence.
SlideGeeks
April 15 2019
-

How To Create A Pillar Diagram To Lay A Solid Foundation
A pillar is all about the strength and support it gives to the structure. This tutorial will walk you through the basic steps of creating a stunning and visually appealing pillar diagram in PowerPoint.
SlideGeeks
October 15 2019
