Comparison Bar Graph
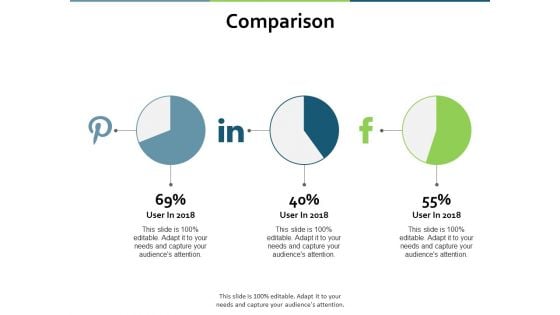
Comparison Marketing Ppt PowerPoint Presentation File Model
This is a comparison marketing ppt powerpoint presentation file model. This is a three stage process. The stages in this process are business, planning, strategy, marketing, management.
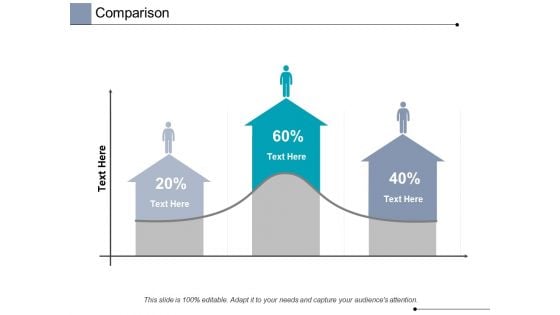
Comparison Finance Ppt PowerPoint Presentation Pictures Good
This is a comparison finance ppt powerpoint presentation pictures good. This is a three stage process. The stages in this process are finance, analysis, business, investment, marketing.
Comparison Ppt PowerPoint Presentation Icon Guide
This is a comparison ppt powerpoint presentation icon guide. This is a four stage process. The stages in this process are business, marketing, planning, strategy, finance.

Product Profitability Comparison Matrix Table PowerPoint Templates
Product Profitability Comparison Matrix Table PowerPoint Templates-These high quality powerpoint pre-designed slides and powerpoint templates have been carefully created by our professional team to help you impress your audience. All slides have been created and are 100% editable in powerpoint. Each and every property of any graphic - color, size, orientation, shading, outline etc. can be modified to help you build an effective powerpoint presentation. Any text can be entered at any point in the powerpoint template or slide. Simply DOWNLOAD, TYPE and PRESENT!-These PowerPoint presentation slides can be used to represent concepts relating to--abstract, achievement, aim, arrow, background, business, chart, communication, company, competition, concept, design, development, diagram, direction, finance, financial, forecast, forward, goal, graph, graphic, growth, icon, illustration, increase, investment, leader, leadership, marketing, motion, moving, orange, path, price, process, profit, progress, shape, sign, success, symbol, target, team, teamwork, up, upwards-Product Profitability Comparison Matrix Table PowerPoint Templates Expose the farce with our Product Profitability Comparison Matrix Table PowerPoint Templates. Bring the facts to the brim.
Comparison Of Two Objects PowerPoint Presentation Template
Our Comparison Of Two Objects PowerPoint Presentation Template Powerpoint Templates Deliver At Your Doorstep. Let Them In For A Wonderful Experience. Dig Out The Dope With Our Business Strategy Powerpoint Templates. Your Thoughts Will Expose The Truth.
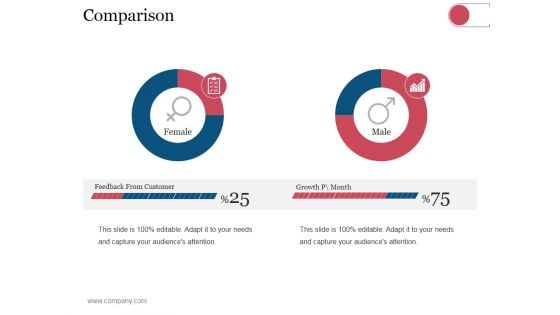
Comparison Ppt PowerPoint Presentation Pictures Templates
This is a comparison ppt powerpoint presentation pictures templates. This is a two stage process. The stages in this process are business, strategy, analysis, planning, feedback from customer, growth.
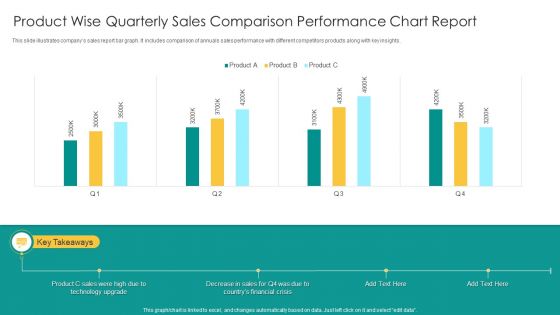
Product Wise Quarterly Sales Comparison Performance Chart Report Infographics PDF
This slide illustrates companys sales report bar graph. It includes comparison of annuals sales performance with different competitors products along with key insights. Showcasing this set of slides titled Product Wise Quarterly Sales Comparison Performance Chart Report Infographics PDF. The topics addressed in these templates are Product C Sales, Technology Upgrade, Financial Crisis. All the content presented in this PPT design is completely editable. Download it and make adjustments in color, background, font etc. as per your unique business setting.
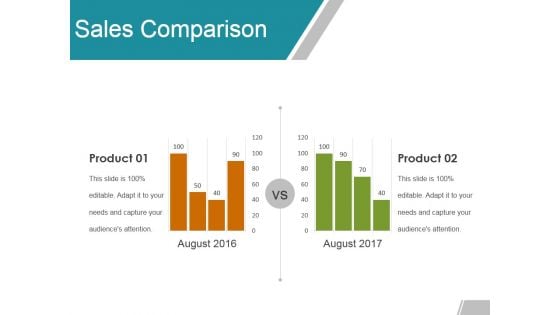
Sales Comparison Ppt PowerPoint Presentation Professional Templates
This is a sales comparison ppt powerpoint presentation professional templates. This is a two stage process. The stages in this process are product, compare, business, marketing, graph.
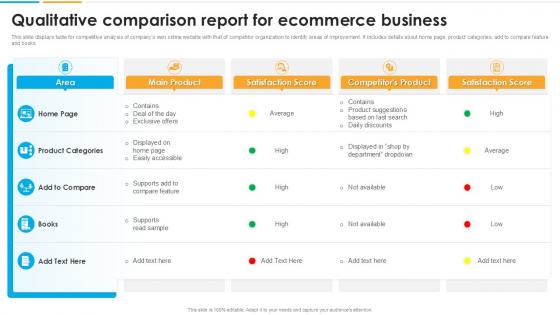
Qualitative Comparison Report For Ecommerce Business
From laying roadmaps to briefing everything in detail, our templates are perfect for you. You can set the stage with your presentation slides. All you have to do is download these easy-to-edit and customizable templates. Qualitative Comparison Report For Ecommerce Business will help you deliver an outstanding performance that everyone would remember and praise you for. Do download this presentation today. This template focuses on presenting a qualitative comparison of different aspects of e-commerce businesses, such as customer experience, product offerings, and marketing strategies. It includes detailed comparison charts and narrative sections to support business analysis. Useful for stakeholders, strategists, and marketers to identify competitive advantages and areas for improvement.
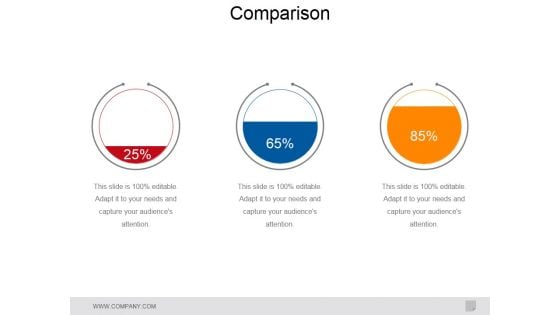
Comparison Ppt PowerPoint Presentation Summary Influencers
This is a comparison ppt powerpoint presentation summary influencers. This is a three stage process. The stages in this process are business, marketing, comparison, finance, management.
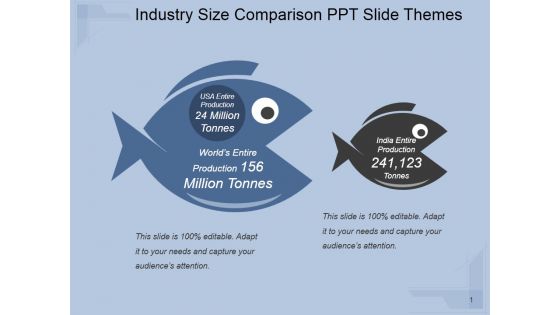
Industry Size Comparison Ppt PowerPoint Presentation Show
This is a industry size comparison ppt powerpoint presentation show. This is a two stage process. The stages in this process are comparison, business, management, marketing, competition.
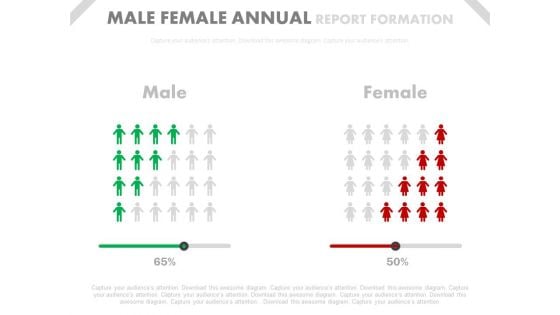
Male Female Ratio Comparison Chart Powerpoint Slides
This PowerPoint template has been designed with graphics of comparison chart. You may download this PPT slide to depict male female ratio comparison chart. Add this slide to your presentation and impress your superiors.
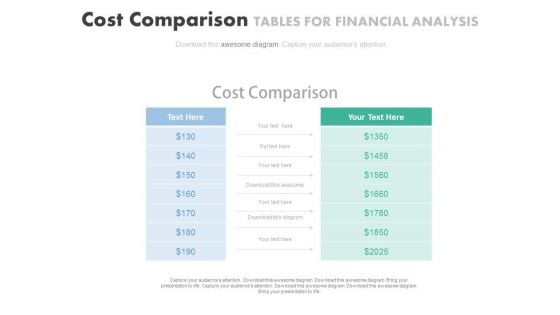
Cost Comparison Table Chart Powerpoint Slides
Our above PPT slide displays cost comparison table chart. This diagram may be used to display cost comparison and financial analysis. Download this PowerPoint template to leave permanent impression on your audience.

Comparison Chart For Performance Analysis Ppt Design
This is a comparison chart for performance analysis ppt design. This is a two stage process. The stages in this process are compare, scale, measurement, business, marketing.
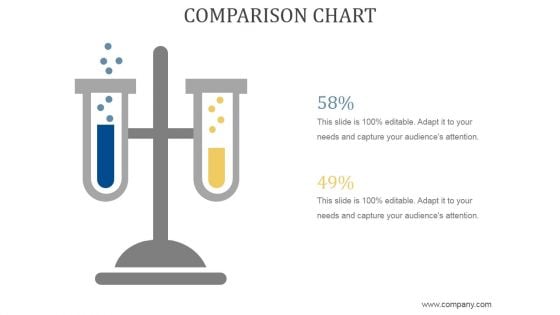
Comparison Chart Ppt PowerPoint Presentation Show
This is a comparison chart ppt powerpoint presentation show. This is a two stage process. The stages in this process are business, strategy, marketing, analysis, growth strategy, compare.
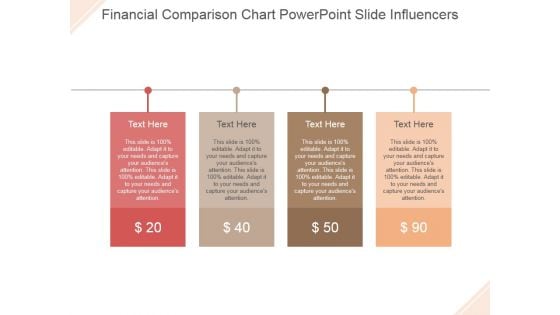
Financial Comparison Chart Ppt PowerPoint Presentation Styles
This is a financial comparison chart ppt powerpoint presentation styles. This is a four stage process. The stage in this process are dollar, business, symbol, finance, management.
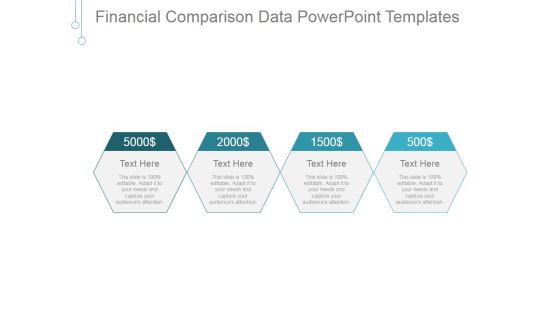
Financial Comparison Data Ppt PowerPoint Presentation Gallery
This is a financial comparison data ppt powerpoint presentation gallery. This is a four stage process. The stages in this process are business, marketing, management, dollar, finance.
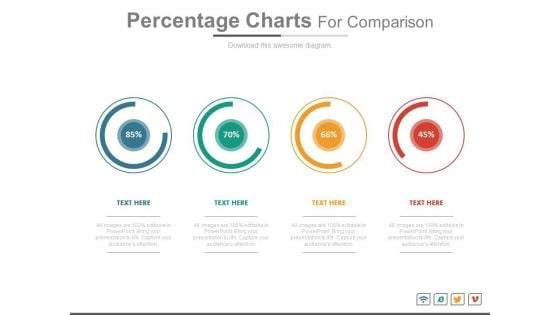
Percentage Charts For Statistical Comparison Powerpoint Slides
This PowerPoint template has been chart of percentage values. You may download this diagram for statistical comparison and analysis. Add this PPT slide to your presentation and impress your superiors.
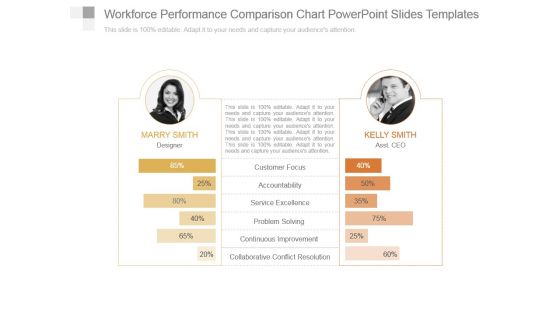
Workforce Performance Comparison Chart Powerpoint Slides Templates
This is a workforce performance comparison chart powerpoint slides templates. This is a two stage process. The stages in this process are customer focus, accountability, service excellence, problem solving, continuous improvement, collaborative conflict resolution.
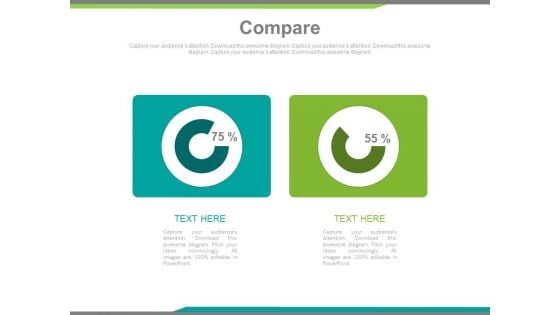
Two Percentage Values Comparison Charts Powerpoint Slides
This PowerPoint template has been designed with two percentage values You may download this PPT slide to use as comparison chart. Add this slide to your presentation and impress your superiors.
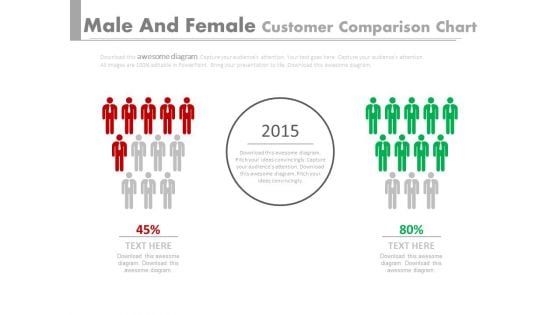
Red Green Teams Comparison Chart Powerpoint Slides
This PPT slide displays graphics of two red and green teams. Use this PPT design to display comparison of teams performances. This PowerPoint template can be customized as per requirements of business education or any other theme.
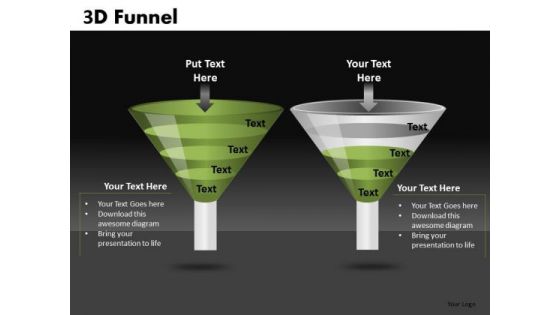
PowerPoint Funnel Diagram Comparison Slides Ppt Templates
PowerPoint Funnel Diagram Comparison Slides PPT templates-These high quality powerpoint pre-designed slides and powerpoint templates have been carefully created by our professional team to help you impress your audience. All slides have been created and are 100% editable in powerpoint. Each and every property of any graphic - color, size, orientation, shading, outline etc. can be modified to help you build an effective powerpoint presentation. Any text can be entered at any point in the powerpoint template or slide. Simply DOWNLOAD, TYPE and PRESENT! These PowerPoint presentation slides can be used to represent themes relating to --arrow, business, chart, choice, development, diagram, financial, flow, funnel, liquid, phase, process, product, select, separate, shape, sift, silver, spout, transparent-PowerPoint Funnel Diagram Comparison Slides PPT templates Realign your team with our PowerPoint Funnel Diagram Comparison Slides Ppt Templates. Download without worries with our money back guaranteee.
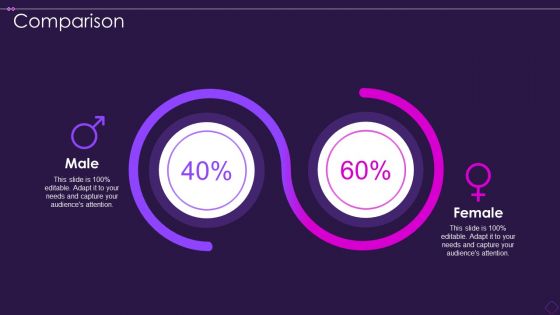
Scrum Organizational Chart Comparison Download PDF
Presenting scrum organizational chart comparison download pdf to provide visual cues and insights. Share and navigate important information on two stages that need your due attention. This template can be used to pitch topics like female, male. In addtion, this PPT design contains high resolution images, graphics, etc, that are easily editable and available for immediate download.
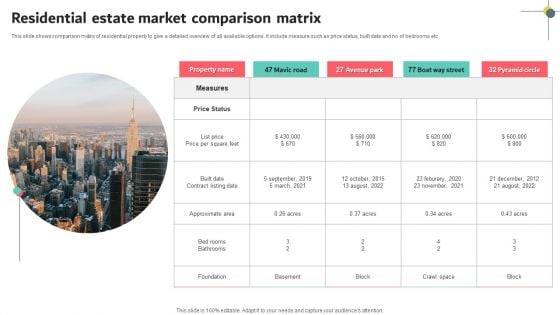
Residential Estate Market Comparison Matrix Slides PDF
This slide shows comparison matrix of residential property to give a detailed overview of all available options. It include measure such as price status, built date and no of bedrooms etc. Persuade your audience using this Residential Estate Market Comparison Matrix Slides PDF. This PPT design covers five stages, thus making it a great tool to use. It also caters to a variety of topics including Price Status, Measures, Pyramid Circle. Download this PPT design now to present a convincing pitch that not only emphasizes the topic but also showcases your presentation skills.
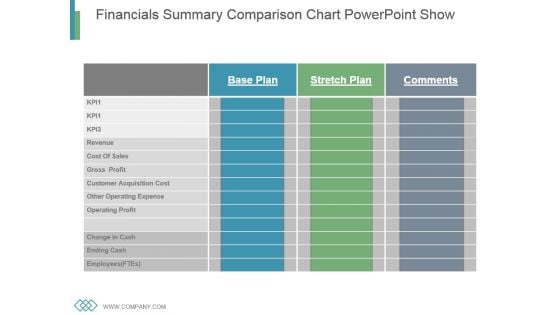
Financials Summary Comparison Chart Powerpoint Show
This is a financials summary comparison chart powerpoint show. This is a three stage process. The stages in this process are revenue, cost of sales, gross profit, customer acquisition cost, other operating cost expense, operating profit, change in cash, ending cash, employees.
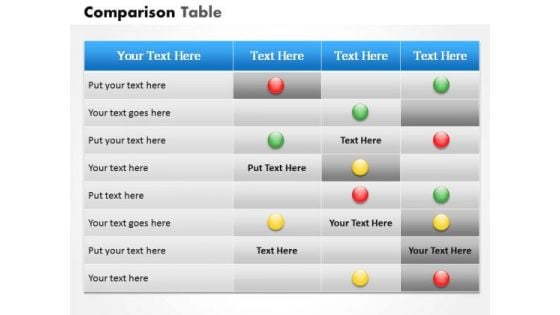
Business Framework PowerPoint Comparison Template PowerPoint Presentation
This image slide displays comparison chart diagram template. This innovative image slide has been designed with chart to represent progress. This image slide is 100% editable. You may change color, size and orientation of any icon to your liking. This image slide may be used in school, business and social presentations. This image slide will enhance the quality of your presentations.
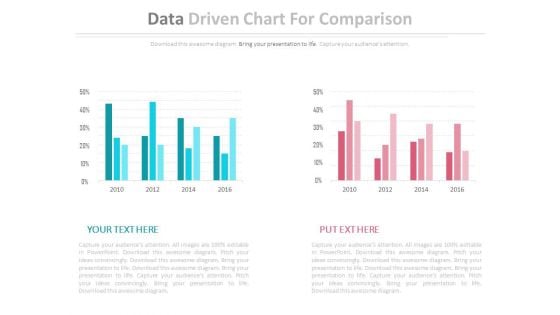
Two Data Driven Comparison Charts Powerpoint Slides
This PowerPoint template contains diagram of two data driven charts. You may use this PPT slide to depict strategic analysis for business. The color coding of this template is specifically designed to highlight you points.
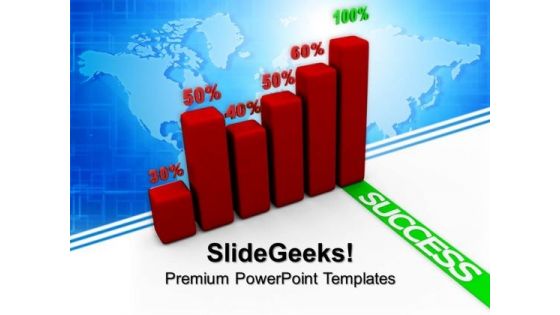
Success Graph Finance PowerPoint Templates And PowerPoint Themes 1012
Success Graph Finance PowerPoint Templates And PowerPoint Themes 1012-The Above PowerPoint Template shows the Bar graph of Several Components showing the Percentage of each component. It signifies the Concept of Growth, Finance, Investment etc. Prove how they mesh to motivate the company team and provide the steam to activate the composite machine. You have noted down some very fruitful ideas that have occurred to you at random moments. Organize them all and prioritize them effectively.-Success Graph Finance PowerPoint Templates And PowerPoint Themes 1012-This PowerPoint template can be used for presentations relating to-Business growth, Business, Finance, Marketing, Success, Symbol Bounce back with our Success Graph Finance PowerPoint Templates And PowerPoint Themes 1012. You will come out on top.
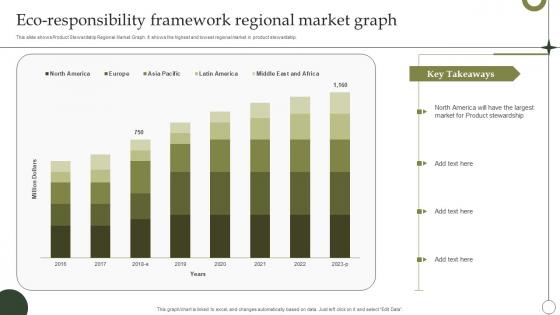
Eco Responsibility Framework Regional Market Graph Summary Pdf
This slide shows Product Stewardship Regional Market Graph. It shows the highest and lowest regional market in product stewardship. Pitch your topic with ease and precision using this Eco Responsibility Framework Regional Market Graph Summary Pdf. This layout presents information on Eco Responsibility Framework, Regional Market Graph, Product Stewardship. It is also available for immediate download and adjustment. So, changes can be made in the color, design, graphics or any other component to create a unique layout. This slide shows Product Stewardship Regional Market Graph. It shows the highest and lowest regional market in product stewardship.

Brand Revenue Comparative Analysis Graph With Key Insights Inspiration PDF
This slide illustrates graphical representation of sales revenue of three brands. It includes insights and facts and figures of these brands.Showcasing this set of slides titled Brand Revenue Comparative Analysis Graph With Key Insights Inspiration PDF. The topics addressed in these templates are Brand Revenue Comparative Analysis Graph With Key Insights. All the content presented in this PPT design is completely editable. Download it and make adjustments in color, background, font etc. as per your unique business setting.
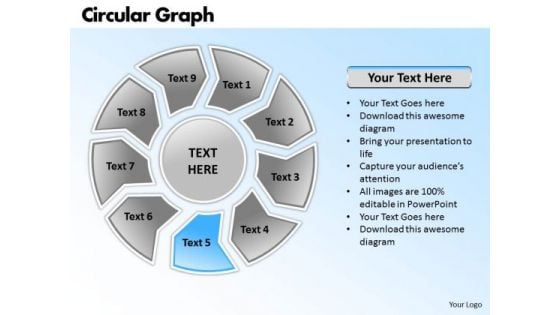
Ppt Circular Nursing Process PowerPoint Presentation Graph Templates
PPT circular nursing process powerpoint presentation graph Templates-Create stunning Microsoft office PPT Presentations with our professional Diagrams containing a graphic of Circular Graph illustrating its components. This image represents the concept of Recycle Process using six stages. Use this Diagram slide for Business Presentations. Deliver amazing presentations to mesmerize your audience using this PPT slide.-PPT circular nursing process powerpoint presentation graph Templates-Arrow, Art, Blue, Business, Button, Circular, Clip, Design, Diagram, Drop, Element, Glowing, Graph, Graphic, Icon, Illustration, Isolated, Process, Round, Set, Shadow, Sphere, Symbol Chase dreams with our Ppt Circular Nursing Process PowerPoint Presentation Graph Templates. You will come out on top.
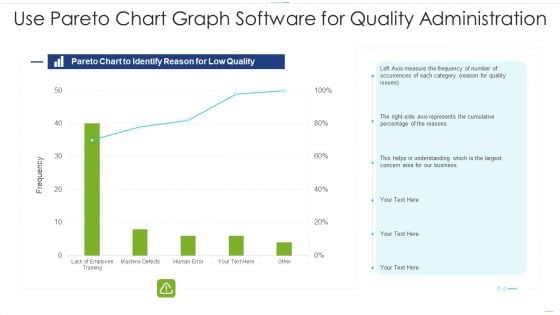
Use Pareto Chart Graph Software For Quality Administration Structure PDF
Pitch your topic with ease and precision using this use pareto chart graph software for quality administration structure pdf. This layout presents information on use pareto chart graph software for quality administration. It is also available for immediate download and adjustment. So, changes can be made in the color, design, graphics or any other component to create a unique layout.
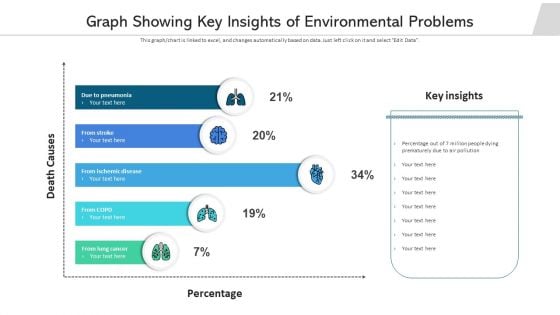
Graph Showing Key Insights Of Environmental Problems Structure PDF
Pitch your topic with ease and precision using this graph showing key insights of environmental problems structure pdf. This layout presents information on graph showing key insights of environmental problems. It is also available for immediate download and adjustment. So, changes can be made in the color, design, graphics or any other component to create a unique layout.
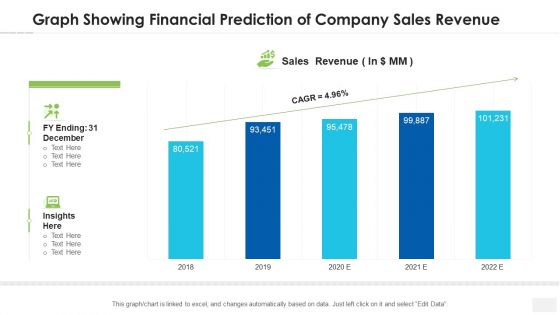
Graph Showing Financial Prediction Of Company Sales Revenue Topics PDF
Pitch your topic with ease and precision using this graph showing financial prediction of company sales revenue topics pdf. This layout presents information on graph showing financial prediction of company sales revenue. It is also available for immediate download and adjustment. So, changes can be made in the color, design, graphics or any other component to create a unique layout.
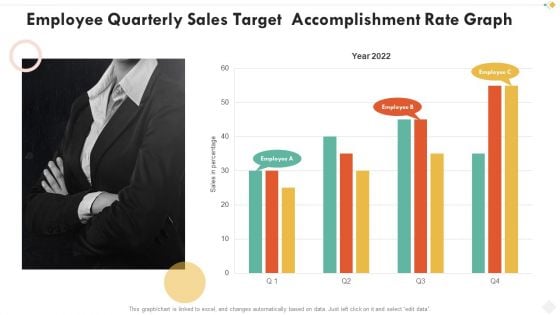
Employee Quarterly Sales Target Accomplishment Rate Graph Demonstration PDF
Pitch your topic with ease and precision using this employee quarterly sales target accomplishment rate graph demonstration pdf. This layout presents information on employee quarterly sales target accomplishment rate graph. It is also available for immediate download and adjustment. So, changes can be made in the color, design, graphics or any other component to create a unique layout.
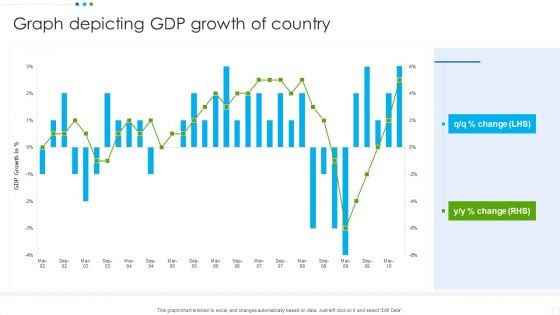
Graph Depicting Gdp Growth Of Country Background PDF
Pitch your topic with ease and precision using this Graph Depicting Gdp Growth Of Country Background PDF. This layout presents information on Graph Depicting, Growth Of Country. It is also available for immediate download and adjustment. So, changes can be made in the color, design, graphics or any other component to create a unique layout.
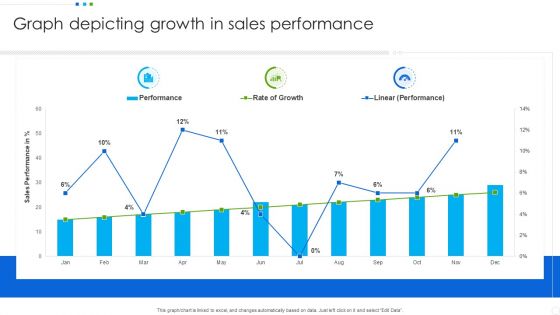
Graph Depicting Growth In Sales Performance Professional PDF
Pitch your topic with ease and precision using this Graph Depicting Growth In Sales Performance Professional PDF. This layout presents information on Graph Depicting, Sales Performance. It is also available for immediate download and adjustment. So, changes can be made in the color, design, graphics or any other component to create a unique layout.
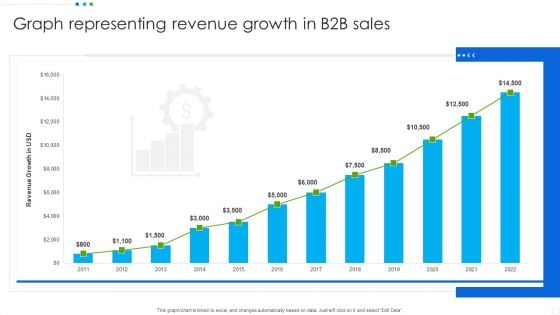
Graph Representing Revenue Growth In B2b Sales Background PDF
Pitch your topic with ease and precision using this Graph Representing Revenue Growth In B2b Sales Background PDF. This layout presents information on Graph Representing, Revenue Growth, Sales. It is also available for immediate download and adjustment. So, changes can be made in the color, design, graphics or any other component to create a unique layout.
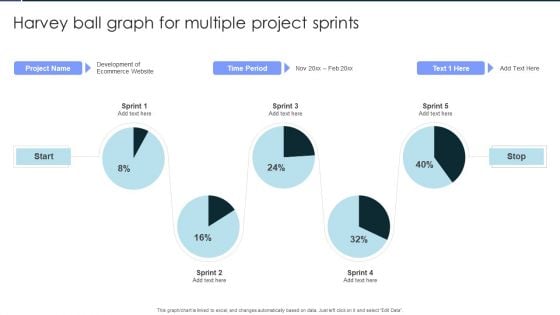
Harvey Ball Graph For Multiple Project Sprints Background PDF
Pitch your topic with ease and precision using this Harvey Ball Graph For Multiple Project Sprints Background PDF. This layout presents information on Harvey Ball Graph, For Multiple, Project Sprints. It is also available for immediate download and adjustment. So, changes can be made in the color, design, graphics or any other component to create a unique layout.
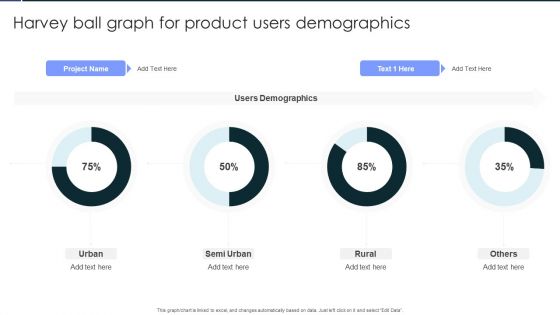
Harvey Ball Graph For Product Users Demographics Portrait PDF
Pitch your topic with ease and precision using this Harvey Ball Graph For Product Users Demographics Portrait PDF. This layout presents information on Harvey Ball Graph, For Product, Users Demographics. It is also available for immediate download and adjustment. So, changes can be made in the color, design, graphics or any other component to create a unique layout.
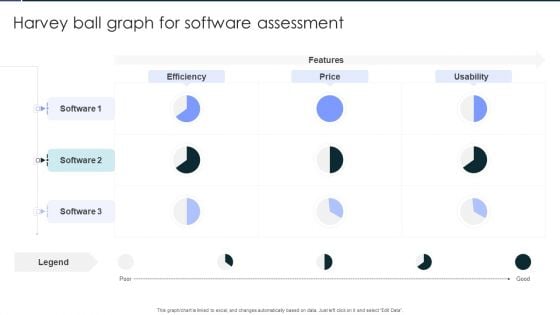
Harvey Ball Graph For Software Assessment Clipart PDF
Pitch your topic with ease and precision using this Harvey Ball Graph For Software Assessment Clipart PDF. This layout presents information on Harvey Ball Graph, For Software, Assessment. It is also available for immediate download and adjustment. So, changes can be made in the color, design, graphics or any other component to create a unique layout.

Line Graph Showing Growth In Customer Conversion Rate Inspiration PDF
Pitch your topic with ease and precision using this Line Graph Showing Growth In Customer Conversion Rate Inspiration PDF. This layout presents information on Monthly Average, Customer Conversion Rate, Previous Average. It is also available for immediate download and adjustment. So, changes can be made in the color, design, graphics or any other component to create a unique layout.
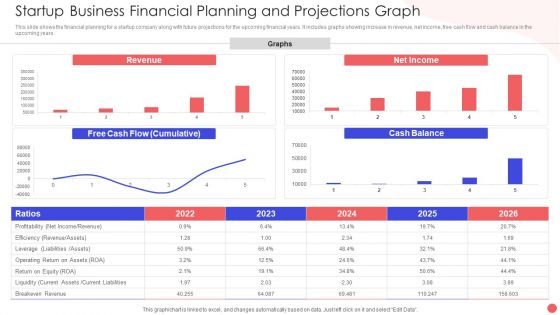
Startup Business Financial Planning And Projections Graph Slides PDF
This slide shows the financial planning for a startup company along with future projections for the upcoming financial years. It includes graphs showing increase in revenue, net income, free cash flow and cash balance in the upcoming years. Pitch your topic with ease and precision using this Startup Business Financial Planning And Projections Graph Slides PDF. This layout presents information on Revenue Graphs Operating, Free Cash Flow, Net Income Ration. It is also available for immediate download and adjustment. So, changes can be made in the color, design, graphics or any other component to create a unique layout.
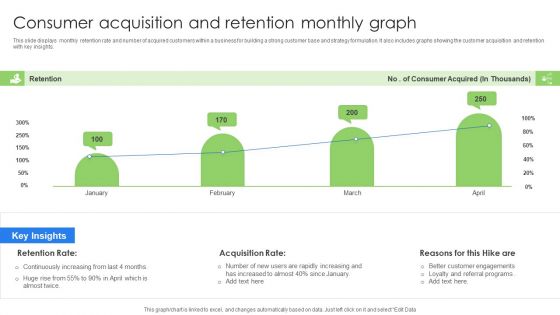
Consumer Acquisition And Retention Monthly Graph Background PDF
This slide displays monthly retention rate and number of acquired customers within a business for building a strong customer base and strategy formulation. It also includes graphs showing the customer acquisition and retention with key insights. Pitch your topic with ease and precision using this Consumer Acquisition And Retention Monthly Graph Background PDF. This layout presents information on Consumer Acquisition, Retention Monthly Graph. It is also available for immediate download and adjustment. So, changes can be made in the color, design, graphics or any other component to create a unique layout.
Safety And Health Kpis For Tracking Performance Graph Mockup PDF
This slide represents graph showing key performance indicators tracked by companies for assessment of safety and health performance of their workplace. It includes key metrics such as workforce awareness, safety meetings held, recordable injuries, lost work days, compliance, severity rates etc. Pitch your topic with ease and precision using this Safety And Health Kpis For Tracking Performance Graph Mockup PDF. This layout presents information on Safety And Health, Kpis For Tracking, Performance Graph. It is also available for immediate download and adjustment. So, changes can be made in the color, design, graphics or any other component to create a unique layout.
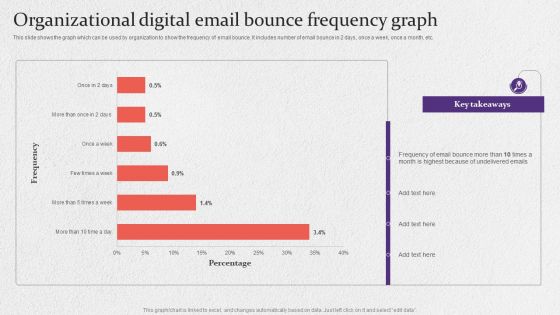
Organizational Digital Email Bounce Frequency Graph Formats PDF
This slide shows the graph which can be used by organization to show the frequency of email bounce. It includes number of email bounce in 2 days, once a week, once a month, etc. Pitch your topic with ease and precision using this Organizational Digital Email Bounce Frequency Graph Formats PDF. This layout presents information on Organizational Digital, Email Bounce Frequency Graph. It is also available for immediate download and adjustment. So, changes can be made in the color, design, graphics or any other component to create a unique layout.
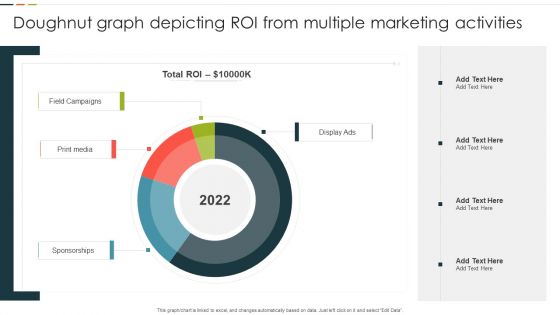
Doughnut Graph Depicting ROI From Multiple Marketing Activities Rules PDF
This graph or chart is linked to excel, and changes automatically based on data. Just left click on it and select Edit Data. Pitch your topic with ease and precision using this Doughnut Graph Depicting ROI From Multiple Marketing Activities Rules PDF. This layout presents information on Total ROI, Field Campaigns, Print Media, Display Ads. It is also available for immediate download and adjustment. So, changes can be made in the color, design, graphics or any other component to create a unique layout.
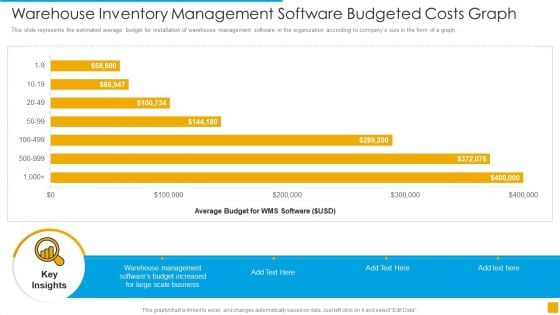
Warehouse Inventory Management Software Budgeted Costs Graph Demonstration PDF
This slide represents the estimated average budget for installation of warehouse management software in the organization according to companys size in the form of a graph Pitch your topic with ease and precision using this Warehouse Inventory Management Software Budgeted Costs Graph Demonstration PDF. This layout presents information on Management, Budget, Average. It is also available for immediate download and adjustment. So, changes can be made in the color, design, graphics or any other component to create a unique layout.
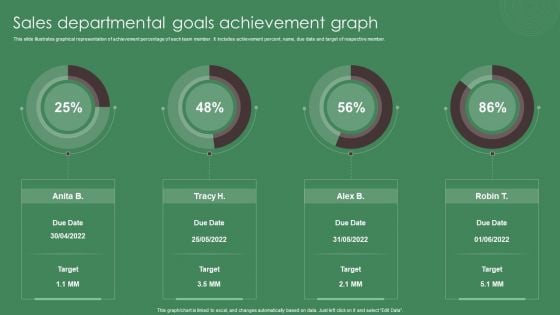
Sales Departmental Goals Achievement Graph Ppt Inspiration Slide Download PDF
This slide illustrates graphical representation of achievement percentage of each team member. It includes achievement percent, name, due date and target of respective member. Pitch your topic with ease and precision using this Sales Departmental Goals Achievement Graph Ppt Inspiration Slide Download PDF. This layout presents information on Sales Departmental, Goals, Achievement Graph. It is also available for immediate download and adjustment. So, changes can be made in the color, design, graphics or any other component to create a unique layout.
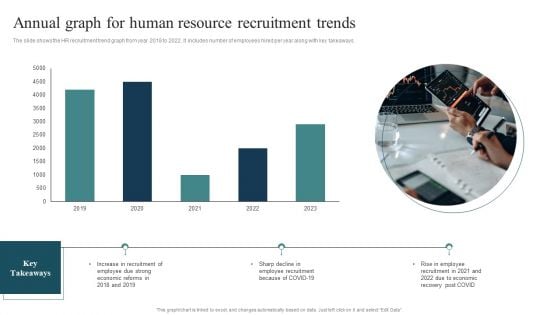
Annual Graph For Human Resource Recruitment Trends Summary PDF
The slide shows the HR recruitment trend graph from year 2018 to 2022. It includes number of employees hired per year along with key takeaways. Pitch your topic with ease and precision using this Annual Graph For Human Resource Recruitment Trends Summary PDF. This layout presents information on Employee Recruitment, Rise Employee, Economic Reforms. It is also available for immediate download and adjustment. So, changes can be made in the color, design, graphics or any other component to create a unique layout.
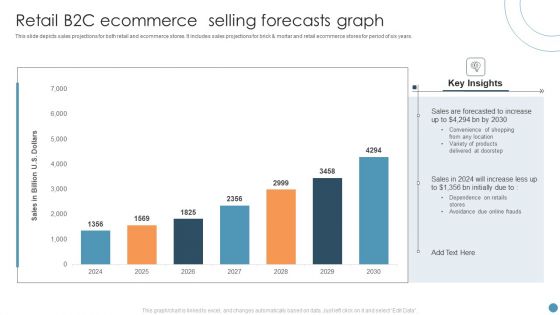
Retail B2C Ecommerce Selling Forecasts Graph Portrait PDF
This slide depicts sales projections for both retail and ecommerce stores. It includes sales projections for brick and mortar and retail ecommerce stores for period of six years. Pitch your topic with ease and precision using this Retail B2C Ecommerce Selling Forecasts Graph Portrait PDF. This layout presents information on Retail B2C Ecommerce, Selling Forecasts Graph. It is also available for immediate download and adjustment. So, changes can be made in the color, design, graphics or any other component to create a unique layout.
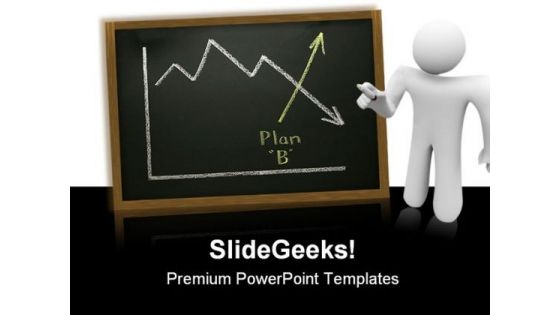
Graph On Blackboard Business PowerPoint Templates And PowerPoint Backgrounds 0511
Microsoft PowerPoint Template and Background with business graph showing a downward trend Give due attention to key features. Filter out the unnecessary with our Graph On Blackboard Business PowerPoint Templates And PowerPoint Backgrounds 0511.
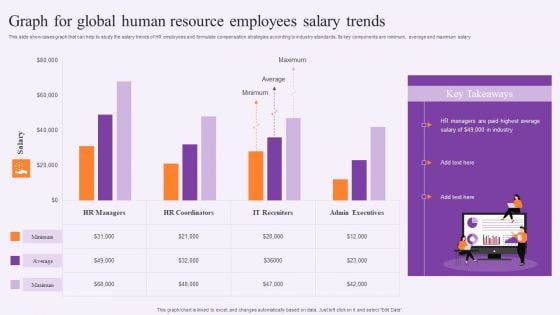
Graph For Global Human Resource Employees Salary Trends Demonstration PDF
This slide showcases graph that can help to study the salary trends of HR employees and formulate compensation strategies according to industry standards. Its key components are minimum, average and maximum salary. Showcasing this set of slides titled Graph For Global Human Resource Employees Salary Trends Demonstration PDF. The topics addressed in these templates are Global Human Resource, Employees Salary Trends. All the content presented in this PPT design is completely editable. Download it and make adjustments in color, background, font etc. as per your unique business setting.
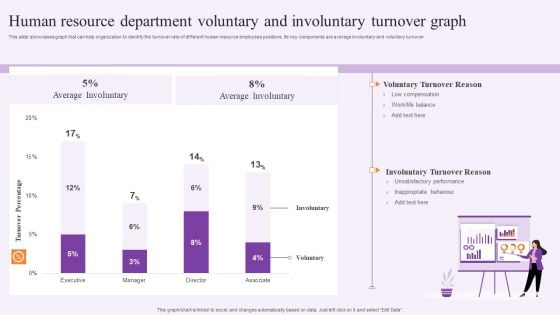
Human Resource Department Voluntary And Involuntary Turnover Graph Summary PDF
This slide showcases graph that can help organization to identify the turnover rate of different human resource employees positions. Its key components are average involuntary and voluntary turnover. Pitch your topic with ease and precision using this Human Resource Department Voluntary And Involuntary Turnover Graph Summary PDF. This layout presents information on Executive, Voluntary Turnover Reason, Average Involuntary. It is also available for immediate download and adjustment. So, changes can be made in the color, design, graphics or any other component to create a unique layout.
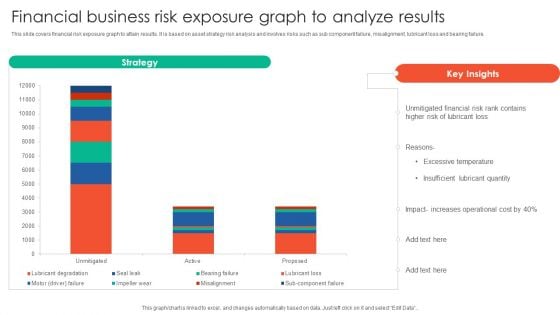
Financial Business Risk Exposure Graph To Analyze Results Elements PDF
This slide covers financial risk exposure graph to attain results. It is based on asset strategy risk analysis and involves risks such as sub component failure, misalignment, lubricant loss and bearing failure. Pitch your topic with ease and precision using this Financial Business Risk Exposure Graph To Analyze Results Elements PDF. This layout presents information on Strategy, Unmitigated Financial, Risk Rank Contains. It is also available for immediate download and adjustment. So, changes can be made in the color, design, graphics or any other component to create a unique layout.
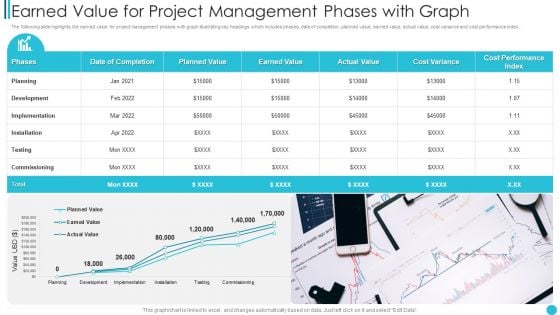
Earned Value For Project Management Phases With Graph Microsoft PDF
The following slide highlights the earned value for project management phases with graph illustrating key headings which includes phases, date of completion, planned value, earned value, actual value, cost variance and cost performance index.Pitch your topic with ease and precision using this Earned Value For Project Management Phases With Graph Microsoft PDF This layout presents information on Implementation, Installation, Commissioning It is also available for immediate download and adjustment. So, changes can be made in the color, design, graphics or any other component to create a unique layout.
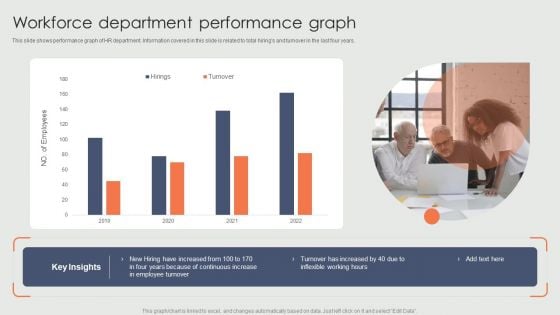
Workforce Department Performance Graph Ppt Model Graphics Pictures PDF
This slide shows performance graph of HR department. Information covered in this slide is related to total hirings and turnover in the last four years. Pitch your topic with ease and precision using this Workforce Department Performance Graph Ppt Model Graphics Pictures PDF. This layout presents information on New Hiring, Continuous Increase, Employee Turnover, 2019 To 2022. It is also available for immediate download and adjustment. So, changes can be made in the color, design, graphics or any other component to create a unique layout.
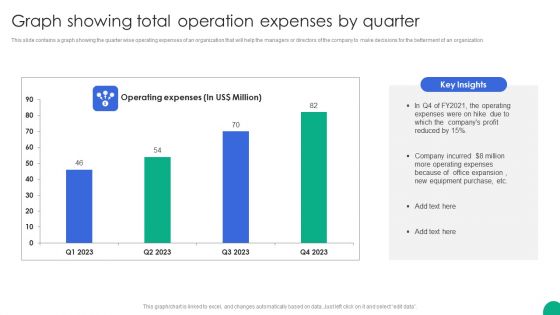
Graph Showing Total Operation Expenses By Quarter Themes PDF
This slide contains a graph showing the quarter wise operating expenses of an organization that will help the managers or directors of the company to make decisions for the betterment of an organization.Pitch your topic with ease and precision using this Graph Showing Total Operation Expenses By Quarter Themes PDF. This layout presents information on Operating Expenses, Equipment Purchase, Office Expansion. It is also available for immediate download and adjustment. So, changes can be made in the color, design, graphics or any other component to create a unique layout.
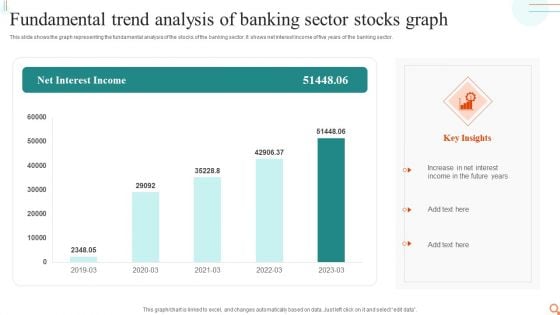
Fundamental Trend Analysis Of Banking Sector Stocks Graph Mockup PDF
This slide shows the graph representing the fundamental analysis of the stocks of the banking sector. It shows net interest income of five years of the banking sector.Pitch your topic with ease and precision using this Fundamental Trend Analysis Of Banking Sector Stocks Graph Mockup PDF. This layout presents information on Increase Interest, Income Future, Interest Income. It is also available for immediate download and adjustment. So, changes can be made in the color, design, graphics or any other component to create a unique layout.
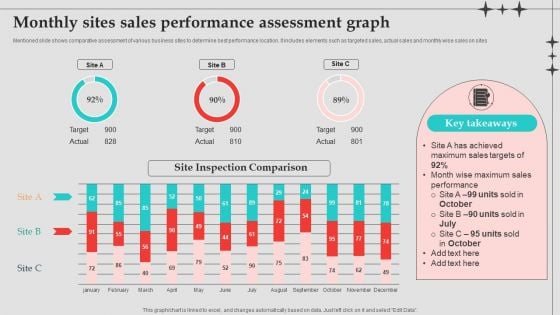
Monthly Sites Sales Performance Assessment Graph Designs PDF
Mentioned slide shows comparative assessment of various business sites to determine best performance location. It includes elements such as targeted sales, actual sales and monthly wise sales on sites. Pitch your topic with ease and precision using this Monthly Sites Sales Performance Assessment Graph Designs PDF. This layout presents information on Sales Performance, Sales Targets, Performance Assessment Graph . It is also available for immediate download and adjustment. So, changes can be made in the color, design, graphics or any other component to create a unique layout.


 Continue with Email

 Home
Home


