Comparison Bar Graph
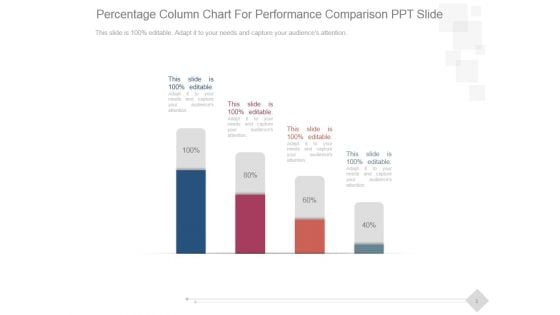
Percentage Column Chart For Performance Comparison Ppt PowerPoint Presentation Good
This is a percentage column chart for performance comparison ppt powerpoint presentation good. This is a four stage process. The stages in this process are business, marketing, technology, presentation, management.
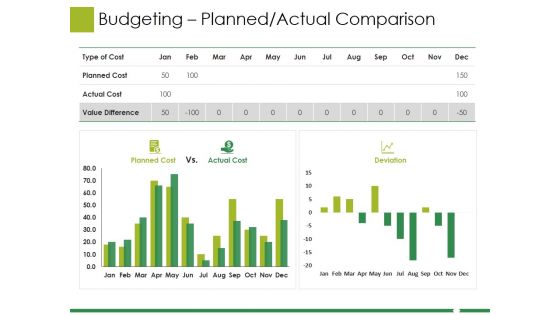
Budgeting Planned Actual Comparison Ppt PowerPoint Presentation Gallery Graphic Tips
This is a budgeting planned actual comparison ppt powerpoint presentation gallery graphic tips. This is a three stage process. The stages in this process are planned cost, actual cost, value difference.

Budgeting Planned Actual Comparison Ppt PowerPoint Presentation Portfolio Information
This is a budgeting planned actual comparison ppt powerpoint presentation portfolio information. This is a three stage process. The stages in this process are planned cost, actual cost, deviation.
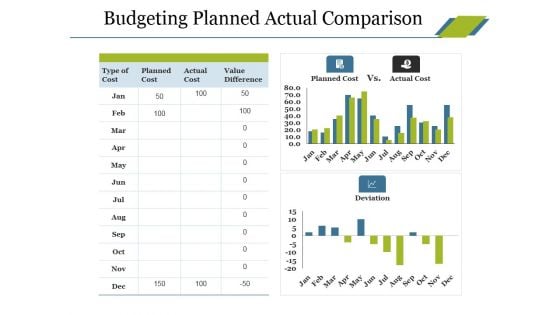
Budgeting Planned Actual Comparison Ppt PowerPoint Presentation Portfolio Display
This is a budgeting planned actual comparison ppt powerpoint presentation portfolio display. This is a three stage process. The stages in this process are type of cost, planned cost, actual cost, deviation, value difference.

Budgeting Planned Actual Comparison Ppt PowerPoint Presentation Show Background Image
This is a budgeting planned actual comparison ppt powerpoint presentation show background image. This is a three stage process. The stages in this process are planned cost, actual cost, value difference, deviation.
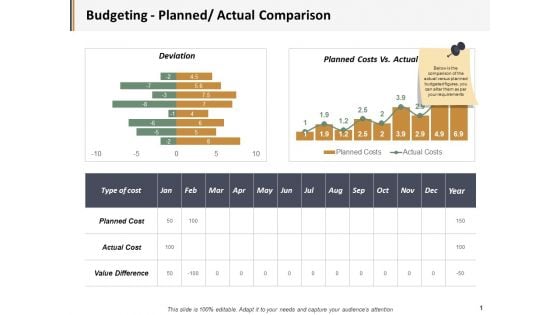
Budgeting Planned Actual Comparison Ppt PowerPoint Presentation Visual Aids Gallery
This is a budgeting planned actual comparison ppt powerpoint presentation visual aids gallery. This is a three stage process. The stages in this process are business, management, marketing, percentage, product.
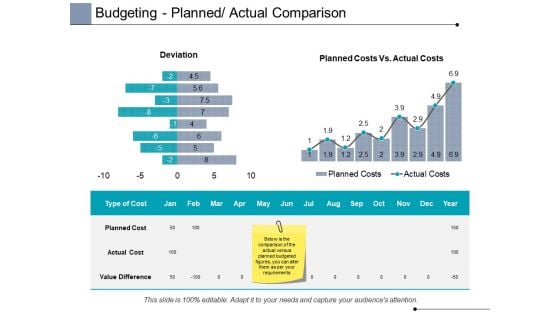
Budgeting Planned Actual Comparison Ppt PowerPoint Presentation Portfolio Ideas
This is a budgeting planned actual comparison ppt powerpoint presentation portfolio ideas. This is a two stage process. The stages in this process are finance, analysis, business, investment, marketing.
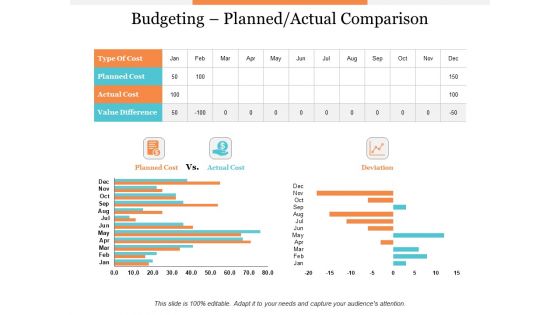
Budgeting Planned Actual Comparison Ppt PowerPoint Presentation Styles File Formats
This is a budgeting planned actual comparison ppt powerpoint presentation styles file formats. This is a three stage process. The stages in this process are product, percentage, business, management, marketing.
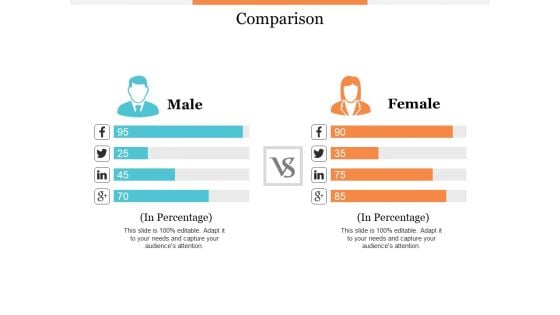
Comparison Male And Female Ppt PowerPoint Presentation Professional Skills
This is a comparison male and female ppt powerpoint presentation professional skills. This is a two stage process. The stages in this process are product, percentage, business, management, marketing.
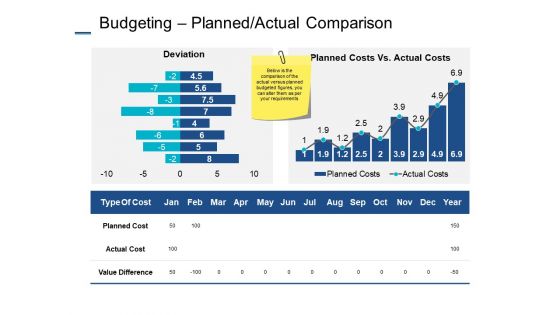
Budgeting Planned Actual Comparison Ppt PowerPoint Presentation Infographics Samples
This is a budgeting planned actual comparison ppt powerpoint presentation infographics samples. This is a two stage process. The stages in this process are deviation, planned cost, actual cost, value difference, planning.
Budgeting Planned Actual Comparison Ppt PowerPoint Presentation Icon Shapes
This is a budgeting planned actual comparison ppt powerpoint presentation icon shapes. This is a two stage process. The stages in this process are finance, marketing, management, investment, product, percentage.
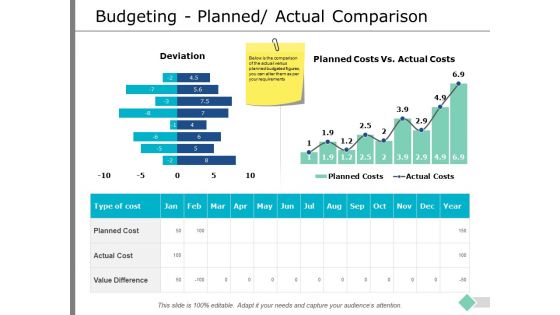
Budgeting Planned Actual Comparison Ppt PowerPoint Presentation Inspiration Gallery
This is a budgeting planned actual comparison ppt powerpoint presentation inspiration gallery. This is a two stage process. The stages in this process are finance, analysis, business, investment, marketing.
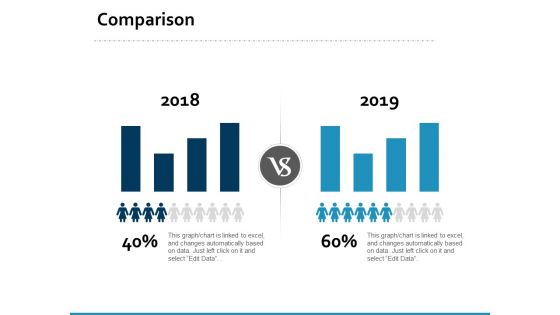
Comparison Male Female Marketing Ppt PowerPoint Presentation Outline Graphics Example
This is a comparison male female marketing ppt powerpoint presentation outline graphics example. This is a two stage process. The stages in this process are business, management, marketing, compare.
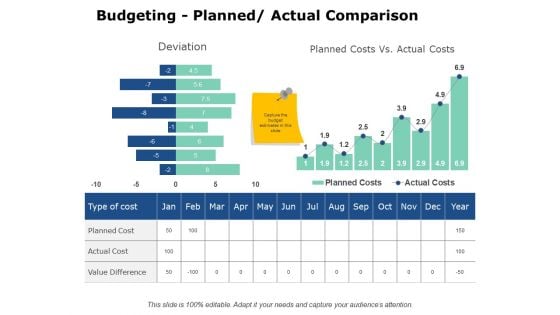
Budgeting Planned Actual Comparison Ppt PowerPoint Presentation Inspiration Outline
This is a budgeting planned actual comparison ppt powerpoint presentation inspiration outline. This is a two stage process. The stages in this process are finance, analysis, business, investment, marketing.
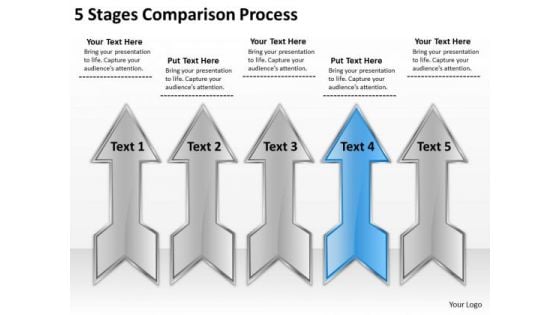
5 Stages Comparison Process Business Plan Maker PowerPoint Slides
We present our 5 stages comparison process business plan maker PowerPoint Slides .Download and present our Flow Charts PowerPoint Templates because Our PowerPoint Templates and Slides are conceived by a dedicated team. Use them and give form to your wondrous ideas. Download and present our Arrows PowerPoint Templates because Our PowerPoint Templates and Slides are created with admirable insight. Use them and give your group a sense of your logical mind. Use our Business PowerPoint Templates because You can Be the star of the show with our PowerPoint Templates and Slides. Rock the stage with your ideas. Present our Marketing PowerPoint Templates because Our PowerPoint Templates and Slides are created with admirable insight. Use them and give your group a sense of your logical mind. Download our Shapes PowerPoint Templates because Your success is our commitment. Our PowerPoint Templates and Slides will ensure you reach your goal.Use these PowerPoint slides for presentations relating to Ambition, arrows, business, chart, competition, data, finance, focus, goals, grey, growth, improvement, lead, leader, leadership, marketing, opportunity, sign, standing out, strategy, success, vision. The prominent colors used in the PowerPoint template are Blue, White, Gray. Customers tell us our 5 stages comparison process business plan maker PowerPoint Slides are visually appealing. Customers tell us our business PowerPoint templates and PPT Slides provide you with a vast range of viable options. Select the appropriate ones and just fill in your text. We assure you our 5 stages comparison process business plan maker PowerPoint Slides are designed by a team of presentation professionals. Customers tell us our goals PowerPoint templates and PPT Slides will impress their bosses and teams. Professionals tell us our 5 stages comparison process business plan maker PowerPoint Slides will make the presenter successul in his career/life. PowerPoint presentation experts tell us our finance PowerPoint templates and PPT Slides will make you look like a winner. Measure success with our 5 Stages Comparison Process Business Plan Maker PowerPoint Slides. Download without worries with our money back guaranteee.
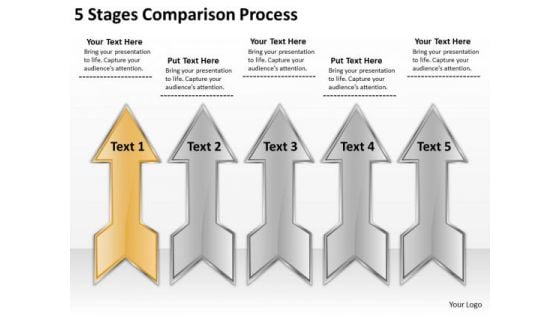
5 Stages Comparison Process Create Business Plan Free PowerPoint Slides
We present our 5 stages comparison process create business plan free PowerPoint Slides .Download our Flow Charts PowerPoint Templates because It will mark the footprints of your journey. Illustrate how they will lead you to your desired destination. Download and present our Arrows PowerPoint Templates because Watching this your Audience will Grab their eyeballs, they wont even blink. Present our Business PowerPoint Templates because Your audience will believe you are the cats whiskers. Use our Marketing PowerPoint Templates because You should Bet on your luck with our PowerPoint Templates and Slides. Be assured that you will hit the jackpot. Download our Shapes PowerPoint Templates because You can Be the star of the show with our PowerPoint Templates and Slides. Rock the stage with your ideas.Use these PowerPoint slides for presentations relating to Ambition, arrows, business, chart, competition, data, finance, focus, goals, grey, growth, improvement, lead, leader, leadership, marketing, opportunity, sign, standing out, strategy, success, vision. The prominent colors used in the PowerPoint template are Orange, White, Gray. Customers tell us our 5 stages comparison process create business plan free PowerPoint Slides look good visually. Customers tell us our goals PowerPoint templates and PPT Slides are effectively colour coded to prioritise your plans They automatically highlight the sequence of events you desire. We assure you our 5 stages comparison process create business plan free PowerPoint Slides will impress their bosses and teams. Customers tell us our business PowerPoint templates and PPT Slides will make the presenter successul in his career/life. Professionals tell us our 5 stages comparison process create business plan free PowerPoint Slides will help you be quick off the draw. Just enter your specific text and see your points hit home. PowerPoint presentation experts tell us our business PowerPoint templates and PPT Slides have awesome images to get your point across. Aim at your target with our 5 Stages Comparison Process Create Business Plan Free PowerPoint Slides. You will come out on top.
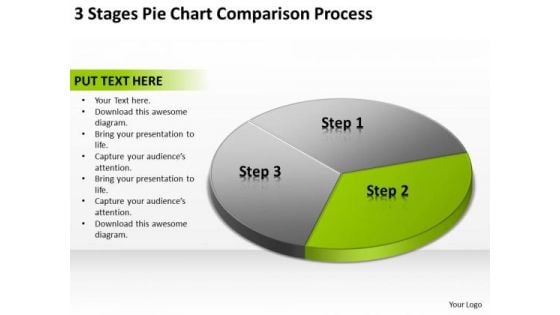
3 Stages Pie Chart Comparison Process Business Plans PowerPoint Templates
We present our 3 stages pie chart comparison process business plans PowerPoint templates.Use our Marketing PowerPoint Templates because you should Whip up a frenzy with our PowerPoint Templates and Slides. They will fuel the excitement of your team. Present our Finance PowerPoint Templates because Our PowerPoint Templates and Slides will let Your superior ideas hit the target always and everytime. Present our Arrows PowerPoint Templates because Our PowerPoint Templates and Slides are Clear and concise. Use them and dispel any doubts your team may have. Use our Circle Charts PowerPoint Templates because You can Zap them with our PowerPoint Templates and Slides. See them reel under the impact. Use our Business PowerPoint Templates because You can Double your output with our PowerPoint Templates and Slides. They make beating deadlines a piece of cake.Use these PowerPoint slides for presentations relating to Pie, chart, process, menu, website, network, statistics, item, junction, corporate, business, plan, presentation, template, circle, brochure, data, report, marketing, different, management, graph, modern, connection, sphere, options, strategy, catalog, world, spherical, segments, text, company, banner, information, navigation, structure, parts, globe, arrows, communication. The prominent colors used in the PowerPoint template are Green, Black, Gray. Our 3 Stages Pie Chart Comparison Process Business Plans PowerPoint Templates are pretty fancy. Their color combinations are fairly charming.
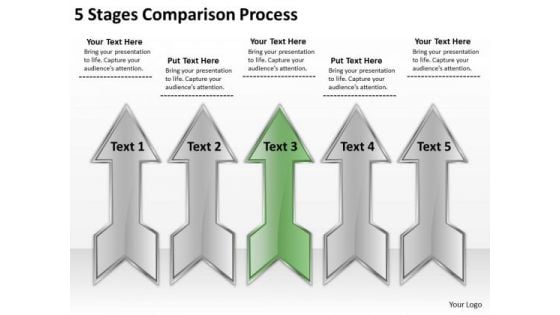
5 Stages Comparison Process Great Business Plan Examples PowerPoint Templates
We present our 5 stages comparison process great business plan examples PowerPoint templates .Download our Flow Charts PowerPoint Templates because Our PowerPoint Templates and Slides will give good value for money. They also have respect for the value of your time. Download and present our Arrows PowerPoint Templates because Our PowerPoint Templates and Slides ensures Effective communication. They help you put across your views with precision and clarity. Download our Business PowerPoint Templates because You can Be the puppeteer with our PowerPoint Templates and Slides as your strings. Lead your team through the steps of your script. Download our Marketing PowerPoint Templates because You will get more than you ever bargained for. Use our Shapes PowerPoint Templates because You can Channelise the thoughts of your team with our PowerPoint Templates and Slides. Urge them to focus on the goals you have set.Use these PowerPoint slides for presentations relating to Ambition, arrows, business, chart, competition, data, finance, focus, goals, grey, growth, improvement, lead, leader, leadership, marketing, opportunity, sign, standing out, strategy, success, vision. The prominent colors used in the PowerPoint template are Green, White, Gray. Customers tell us our 5 stages comparison process great business plan examples PowerPoint templates will make the presenter look like a pro even if they are not computer savvy. Customers tell us our finance PowerPoint templates and PPT Slides are readymade to fit into any presentation structure. We assure you our 5 stages comparison process great business plan examples PowerPoint templates are visually appealing. Customers tell us our goals PowerPoint templates and PPT Slides are effectively colour coded to prioritise your plans They automatically highlight the sequence of events you desire. Professionals tell us our 5 stages comparison process great business plan examples PowerPoint templates are second to none. PowerPoint presentation experts tell us our goals PowerPoint templates and PPT Slides will make the presenter successul in his career/life. Our 5 Stages Comparison Process Great Business Plan Examples PowerPoint Templates are essential to your well being. Their application will calm the nerves.
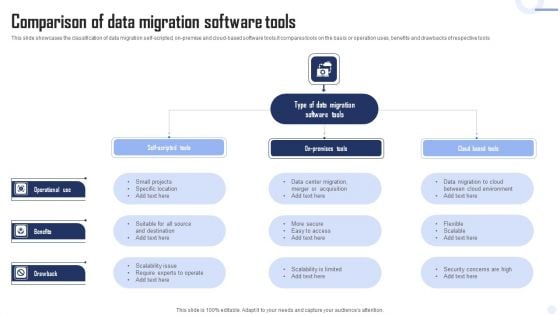
Comparison Of Data Migration Software Tools Microsoft PDF
This slide showcases the classification of data migration self-scripted, on-premise and cloud-based software tools.it compares tools on the basis or operation uses, benefits and drawbacks of respective tools Persuade your audience using this Comparison Of Data Migration Software Tools Microsoft PDF. This PPT design covers one stages, thus making it a great tool to use. It also caters to a variety of topics including Operational Use, Benefits, Drawback. Download this PPT design now to present a convincing pitch that not only emphasizes the topic but also showcases your presentation skills.

Four Vertical Columns For Percentage Comparison Ppt PowerPoint Presentation Introduction
This is a four vertical columns for percentage comparison ppt powerpoint presentation introduction. This is a four stage process. The stages in this process are business, marketing, success, management, presentation.
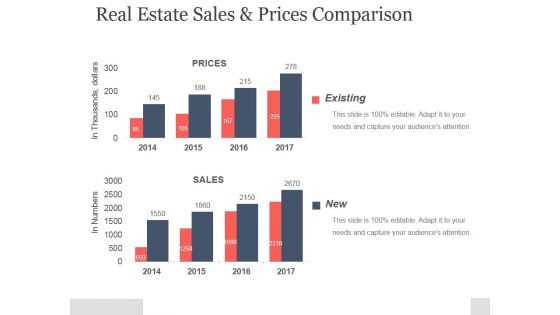
Real Estate Sales And Prices Comparison Ppt PowerPoint Presentation Example
This is a real estate sales and prices comparison ppt powerpoint presentation example. This is a two stage process. The stages in this process are existing, prices, sales, in thousands, dollars.
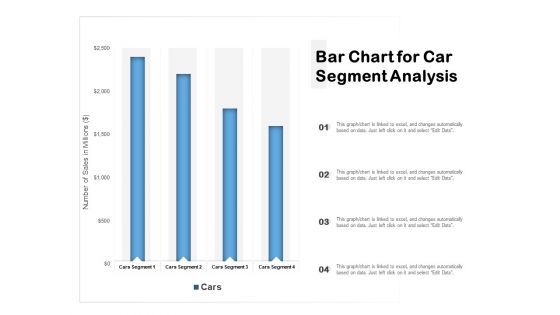
Bar Chart For Car Segment Analysis Ppt PowerPoint Presentation Show Templates PDF
Pitch your topic with ease and precision using this bar chart for car segment analysis ppt powerpoint presentation show templates pdf. This layout presents information on bar chart for car segment analysis. It is also available for immediate download and adjustment. So, changes can be made in the color, design, graphics or any other component to create a unique layout.
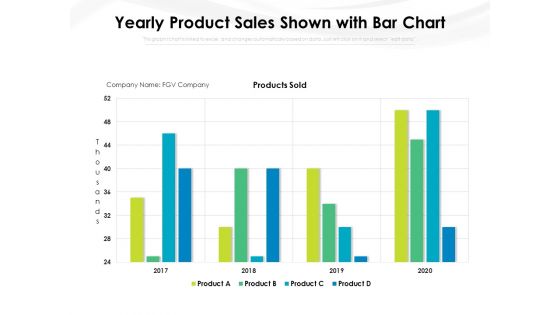
Yearly Product Sales Shown With Bar Chart Ppt PowerPoint Presentation File Gridlines PDF
Pitch your topic with ease and precision using this yearly product sales shown with bar chart ppt powerpoint presentation file gridlines pdf. This layout presents information on yearly product sales shown with bar chart. It is also available for immediate download and adjustment. So, changes can be made in the color, design, graphics or any other component to create a unique layout.
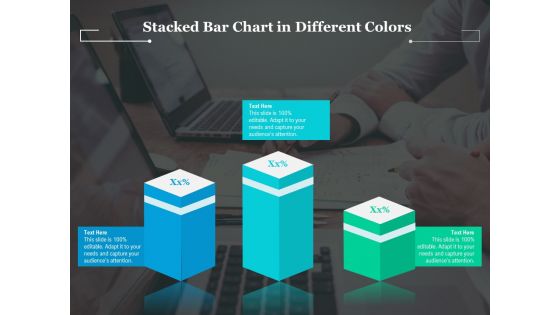
Stacked Bar Chart In Different Colors Ppt PowerPoint Presentation Gallery Maker PDF
Pitch your topic with ease and precision using this stacked bar chart in different colors ppt powerpoint presentation gallery maker pdf. This layout presents information on stacked bar chart in different colors. It is also available for immediate download and adjustment. So, changes can be made in the color, design, graphics or any other component to create a unique layout.

Horizontal Bar Chart Representing Consumer Review On Three Scale Ppt Gallery Diagrams PDF
Pitch your topic with ease and precision using this horizontal bar chart representing consumer review on three scale ppt gallery diagrams pdf. This layout presents information on horizontal bar chart representing consumer review on three scale. It is also available for immediate download and adjustment. So, changes can be made in the color, design, graphics or any other component to create a unique layout.
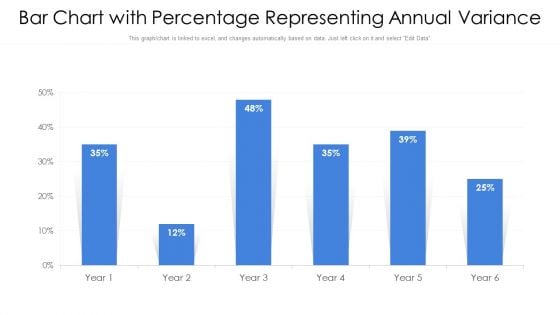
Bar Chart With Percentage Representing Annual Variance Ppt PowerPoint Presentation Gallery Portfolio PDF
Pitch your topic with ease and precision using this bar chart with percentage representing annual variance ppt powerpoint presentation gallery portfolio pdf. This layout presents information on bar chart with percentage representing annual variance. It is also available for immediate download and adjustment. So, changes can be made in the color, design, graphics or any other component to create a unique layout.

Bar Chart With Percentage Representing Inventory Ppt PowerPoint Presentation File Outfit PDF
Pitch your topic with ease and precision using this bar chart with percentage representing inventory ppt powerpoint presentation file outfit pdf. This layout presents information on bar chart with percentage representing inventory. It is also available for immediate download and adjustment. So, changes can be made in the color, design, graphics or any other component to create a unique layout.
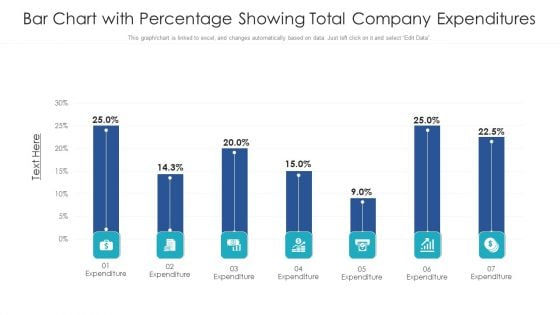
Bar Chart With Percentage Showing Total Company Expenditures Ppt PowerPoint Presentation File Background PDF
Pitch your topic with ease and precision using this bar chart with percentage showing total company expenditures ppt powerpoint presentation file background pdf. This layout presents information on bar chart with percentage showing total company expenditures. It is also available for immediate download and adjustment. So, changes can be made in the color, design, graphics or any other component to create a unique layout.
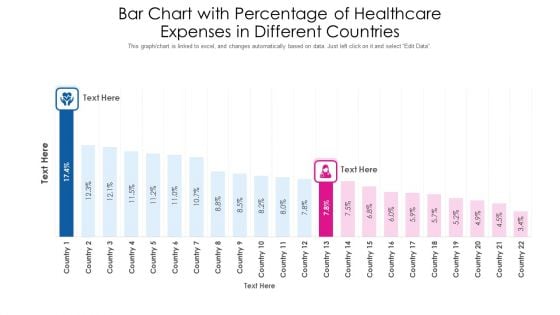
Bar Chart With Percentage Of Healthcare Expenses In Different Countries Ppt PowerPoint Presentation Gallery Tips PDF
Pitch your topic with ease and precision using this bar chart with percentage of healthcare expenses in different countries ppt powerpoint presentation gallery tips pdf. This layout presents information on bar chart with percentage of healthcare expenses in different countries. It is also available for immediate download and adjustment. So, changes can be made in the color, design, graphics or any other component to create a unique layout.
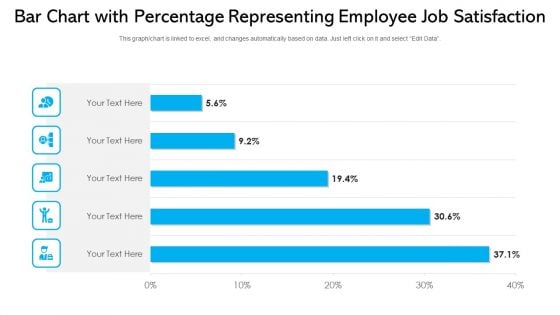
Bar Chart With Percentage Representing Employee Job Satisfaction Ppt PowerPoint Presentation File Slide Download PDF
Pitch your topic with ease and precision using this bar chart with percentage representing employee job satisfaction ppt powerpoint presentation file slide download pdf. This layout presents information on bar chart with percentage representing employee job satisfaction. It is also available for immediate download and adjustment. So, changes can be made in the color, design, graphics or any other component to create a unique layout.
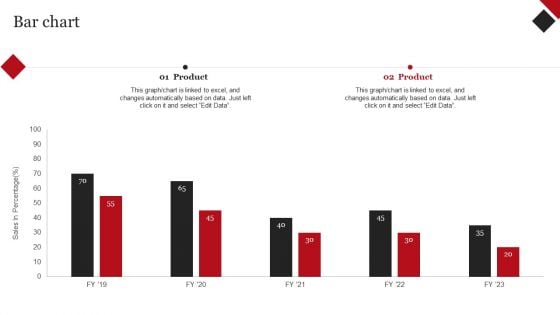
Coca Cola Emotional Marketing Strategy Bar Chart Ppt Professional Picture PDF
This Coca Cola Emotional Marketing Strategy Bar Chart Ppt Professional Picture PDF is perfect for any presentation, be it in front of clients or colleagues. It is a versatile and stylish solution for organizing your meetings. The Coca Cola Emotional Marketing Strategy Bar Chart Ppt Professional Picture PDF features a modern design for your presentation meetings. The adjustable and customizable slides provide unlimited possibilities for acing up your presentation. Slidegeeks has done all the homework before launching the product for you. So, dont wait, grab the presentation templates today
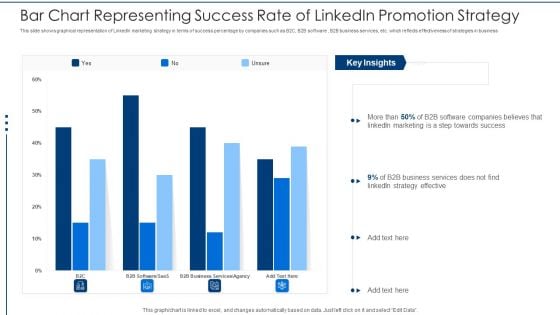
Bar Chart Representing Success Rate Of Linkedin Promotion Strategy Rules PDF
This slide shows graphical representation of LinkedIn marketing strategy in terms of success percentage by companies such as B2C, B2B software , B2B business services, etc. which reflects effectiveness of strategies in business Pitch your topic with ease and precision using this bar chart representing success rate of linkedin promotion strategy rules pdf. This layout presents information on bar chart representing success rate of linkedin promotion strategy. It is also available for immediate download and adjustment. So, changes can be made in the color, design, graphics or any other component to create a unique layout.
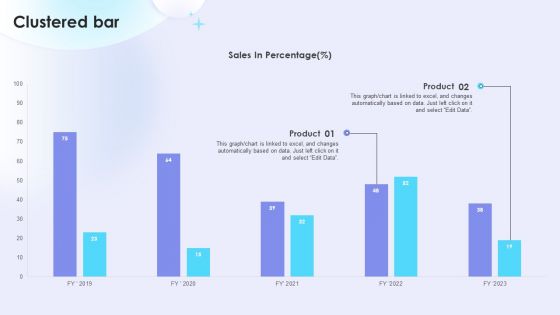
Dual Branding Campaign To Boost Sales Of Product Or Services Clustered Bar Mockup PDF
This Dual Branding Campaign To Boost Sales Of Product Or Services Clustered Bar Mockup PDF is perfect for any presentation, be it in front of clients or colleagues. It is a versatile and stylish solution for organizing your meetings. TheDual Branding Campaign To Boost Sales Of Product Or Services Clustered Bar Mockup PDF features a modern design for your presentation meetings. The adjustable and customizable slides provide unlimited possibilities for acing up your presentation. Slidegeeks has done all the homework before launching the product for you. So, do not wait, grab the presentation templates today
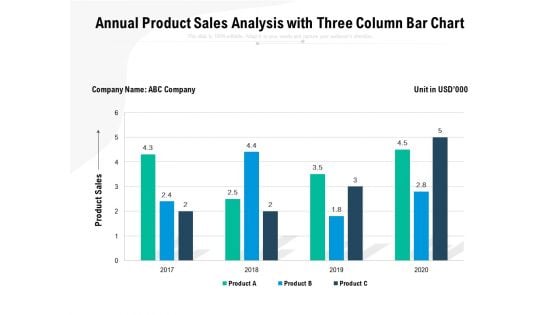
Annual Product Sales Analysis With Three Column Bar Chart Ppt PowerPoint Presentation Inspiration Layouts PDF
Pitch your topic with ease and precision using this annual product sales analysis with three column bar chart ppt powerpoint presentation inspiration layouts pdf. This layout presents information on product sales, 2017 to 2020. It is also available for immediate download and adjustment. So, changes can be made in the color, design, graphics or any other component to create a unique layout.
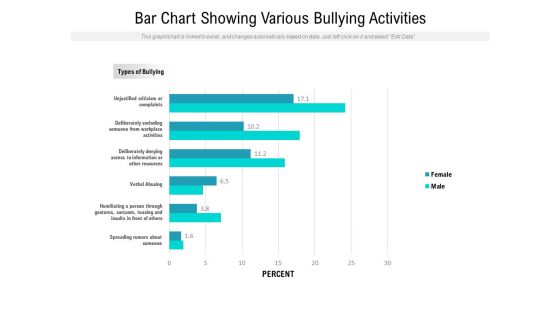
Bar Chart Showing Various Bullying Activities Ppt PowerPoint Presentation Professional Slide PDF
Pitch your topic with ease and precision using this bar chart showing various bullying activities ppt powerpoint presentation professional slide pdf. This layout presents information on unjustified criticism or complaints, deliberately excluding someone from workplace activities, deliberately denying access to information or other resources, verbal abusing, humiliating a person through gestures, sarcasm, teasing and insults in front of others, spreading rumors about someone. It is also available for immediate download and adjustment. So, changes can be made in the color, design, graphics or any other component to create a unique layout.
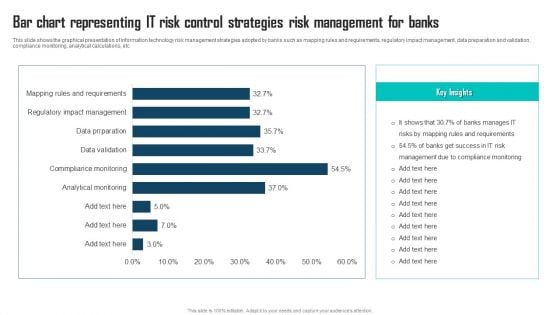
Bar Chart Representing IT Risk Control Strategies Risk Management For Banks Themes PDF
This slide shows the graphical presentation of information technology risk management strategies adopted by banks such as mapping rules and requirements, regulatory impact management, data preparation and validation, compliance monitoring, analytical calculations, etc. Pitch your topic with ease and precision using this Bar Chart Representing IT Risk Control Strategies Risk Management For Banks Themes PDF. This layout presents information on IT Risk Management, Compliance Monitoring, Manages IT Risks. It is also available for immediate download and adjustment. So, changes can be made in the color, design, graphics or any other component to create a unique layout.
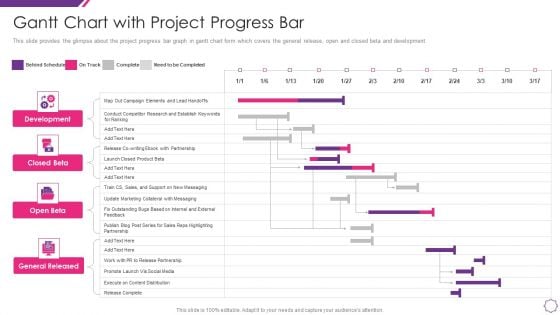
Handle Project Escalations Gantt Chart With Project Progress Bar Ppt Layouts Graphics Design PDF
This slide provides the glimpse about the project progress bar graph in gantt chart form which covers the general release, open and closed beta and development. Introducing our handle project escalations gantt chart with project progress bar ppt layouts graphics design pdf that is designed to showcase some of the vital components that will help you create timelines, roadmaps, and project plans. In addition, also communicate your project durations, milestones, tasks, subtasks, dependencies, and other attributes using this well structured handle project escalations gantt chart with project progress bar ppt layouts graphics design pdf template. You can also exhibit preeminence against time by deploying this easily adaptable slide to your business presentation. Our experts have designed this template in such a way that it is sure to impress your audience. Thus, download it and steer your project meetings, meetups, and conferences.
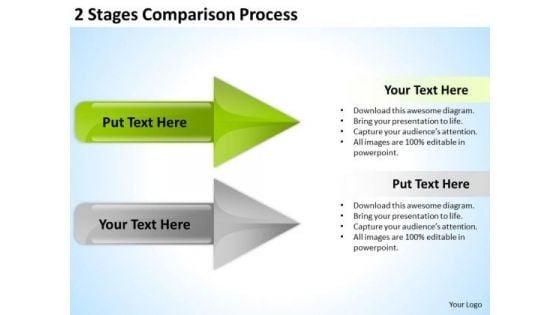
PowerPoint Arrow Shapes Comparison Process Ppt Templates Backgrounds For Slides
3d, accounting, arrow, art, bar, blue, business, calculation, chart, collection, company, design elements, diagram, directive, expense, finance, firm, forecast, future, gain, graph, grow, growth, icon, illustration, income, line, market, measure, objects, office, profit, progress, rate, set, statistic, stock, success, two, up, vector, yellow Get on the list of audience favourites. Experience adulation with our PowerPoint Arrow Shapes Comparison Process Ppt Templates Backgrounds For Slides.
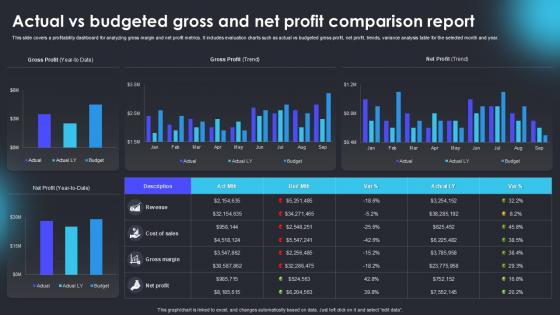
Actual Vs Budgeted Gross And Net Profit Comparison Report
Boost your pitch with our creative Actual Vs Budgeted Gross And Net Profit Comparison Report. Deliver an awe-inspiring pitch that will mesmerize everyone. Using these presentation templates you will surely catch everyones attention. You can browse the ppts collection on our website. We have researchers who are experts at creating the right content for the templates. So you do not have to invest time in any additional work. Just grab the template now and use them. This PowerPoint template is designed to present a detailed comparison between actual financial performance and budgeted projections for gross and net profit. It includes charts, graphs, and tables to effectively illustrate variances, percentage differences, and key financial insights. The template helps in identifying discrepancies, evaluating financial strategies, and guiding corrective measures. Ideal for finance professionals, analysts, and business executives for quarterly, annual, or project-based financial reviews.
Antihistamine Comparison Chart In Powerpoint And Google Slides Cpb
Presenting our innovatively-designed set of slides titled Antihistamine Comparison Chart In Powerpoint And Google Slides Cpb. This completely editable PowerPoint graphic exhibits Antihistamine Comparison Chart that will help you convey the message impactfully. It can be accessed with Google Slides and is available in both standard screen and widescreen aspect ratios. Apart from this, you can download this well-structured PowerPoint template design in different formats like PDF, JPG, and PNG. So, click the download button now to gain full access to this PPT design. Our Antihistamine Comparison Chart In Powerpoint And Google Slides Cpb are topically designed to provide an attractive backdrop to any subject. Use them to look like a presentation pro.
Comparison Templates In Powerpoint And Google Slides Cpb
Presenting our innovatively-designed set of slides titled Comparison Templates In Powerpoint And Google Slides Cpb. This completely editable PowerPoint graphic exhibits Comparison Templates that will help you convey the message impactfully. It can be accessed with Google Slides and is available in both standard screen and widescreen aspect ratios. Apart from this, you can download this well-structured PowerPoint template design in different formats like PDF, JPG, and PNG. So, click the download button now to gain full access to this PPT design. Our Comparison Templates In Powerpoint And Google Slides Cpb are topically designed to provide an attractive backdrop to any subject. Use them to look like a presentation pro.
Height Comparison Generator In Powerpoint And Google Slides Cpb
Presenting our innovatively-designed set of slides titled Height Comparison Generator In Powerpoint And Google Slides Cpb. This completely editable PowerPoint graphic exhibits Height Comparison Generator that will help you convey the message impactfully. It can be accessed with Google Slides and is available in both standard screen and widescreen aspect ratios. Apart from this, you can download this well-structured PowerPoint template design in different formats like PDF, JPG, and PNG. So, click the download button now to gain full access to this PPT design. Our Height Comparison Generator In Powerpoint And Google Slides Cpb are topically designed to provide an attractive backdrop to any subject. Use them to look like a presentation pro.

Card Comparison In Powerpoint And Google Slides Cpb
Presenting our innovatively designed set of slides titled Card Comparison In Powerpoint And Google Slides Cpb. This completely editable PowerPoint graphic exhibits Card Comparison that will help you convey the message impactfully. It can be accessed with Google Slides and is available in both standard screen and widescreen aspect ratios. Apart from this, you can download this well structured PowerPoint template design in different formats like PDF, JPG, and PNG. So, click the download button now to gain full access to this PPT design. Our Card Comparison In Powerpoint And Google Slides Cpb are topically designed to provide an attractive backdrop to any subject. Use them to look like a presentation pro.
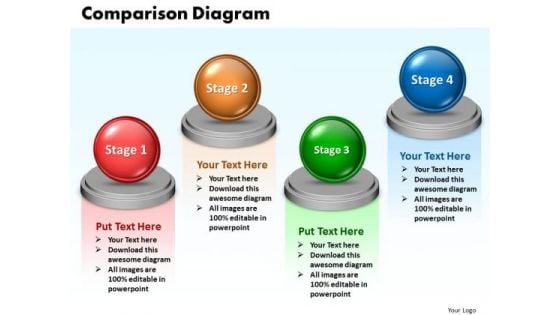
Ppt Comparison Network Diagram PowerPoint Template 4 Phase Templates
PPT comparison network diagram powerpoint template 4 phase Templates-This PowerPoint diagram slide shows four opposing views. You can use the This PowerPoint diagram slide to represent views from different functions on an issue.-PPT comparison network diagram powerpoint template 4 phase Templates-Abstract, Achievement, Business, Chart, Comparison, Concepts, Data, Descriptive, Design, Development, Diagram, Element, Figure, Finance, Financial, Graph, Graphic, Growth, Icon, Ideas, Improvement, Investment, Market, Money, Progress, Raise, Real, Report, Revenue, Sale, Shape, Sign, Silhouette, Stock, Success, Symbol, Technology Reveal the depth of your knowledge. Showcase your erudition on our Ppt Comparison Network Diagram PowerPoint Template 4 Phase Templates.
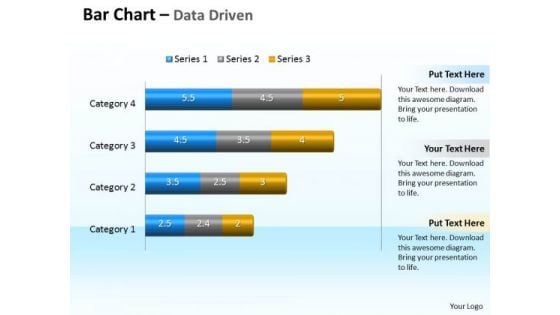
Data Analysis Programs 3d Bar Chart To Compare Categories PowerPoint Templates
Discover Decisive Moments With Our data analysis programs 3d bar chart to compare categories Powerpoint Templates . They Help Make That Crucial Difference.
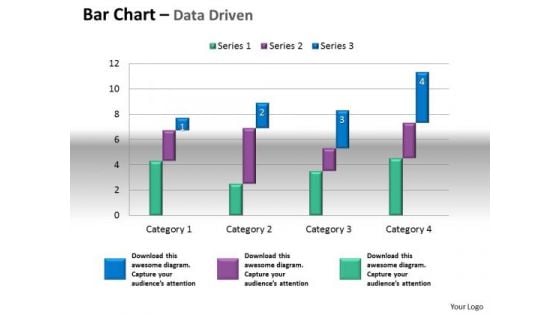
Microsoft Excel Data Analysis Bar Chart To Compare Quantities PowerPoint Templates
Our microsoft excel data analysis bar chart to compare quantities Powerpoint Templates Leave No One In Doubt. Provide A Certainty To Your Views.
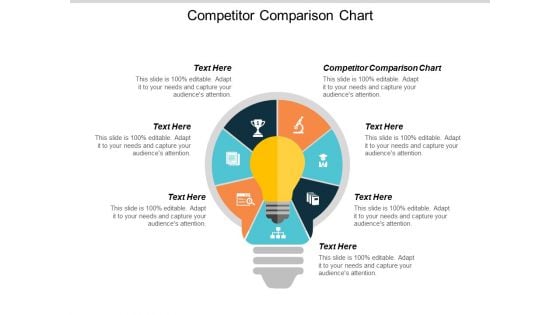
Competitor Comparison Chart Ppt Powerpoint Presentation Professional File Formats Cpb
This is a competitor comparison chart ppt powerpoint presentation professional file formats cpb. This is a seven stage process. The stages in this process are competitor comparison chart.
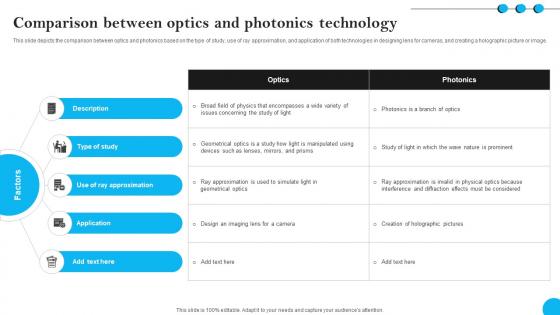
Fibers IT Comparison Between Optics And Photonics Technology
This slide depicts the comparison between optics and photonics based on the type of study, use of ray approximation, and application of both technologies in designing lens for cameras, and creating a holographic picture or image. Find highly impressive Fibers IT Comparison Between Optics And Photonics Technology on Slidegeeks to deliver a meaningful presentation. You can save an ample amount of time using these presentation templates. No need to worry to prepare everything from scratch because Slidegeeks experts have already done a huge research and work for you. You need to download Fibers IT Comparison Between Optics And Photonics Technology for your upcoming presentation. All the presentation templates are 100 percent editable and you can change the color and personalize the content accordingly. Download now This slide depicts the comparison between optics and photonics based on the type of study, use of ray approximation, and application of both technologies in designing lens for cameras, and creating a holographic picture or image.
Triptans Comparison Chart In Powerpoint And Google Slides Cpb
Presenting our innovatively designed set of slides titled Triptans Comparison Chart In Powerpoint And Google Slides Cpb This completely editable PowerPoint graphic exhibits Triptans Comparison Chart that will help you convey the message impactfully. It can be accessed with Google Slides and is available in both standard screen and widescreen aspect ratios. Apart from this, you can download this well structured PowerPoint template design in different formats like PDF, JPG, and PNG. So, click the download button now to gain full access to this PPT design. Our Triptans Comparison Chart In Powerpoint And Google Slides Cpb are topically designed to provide an attractive backdrop to any subject. Use them to look like a presentation pro.
Fitness Watch Comparison Chart In Powerpoint And Google Slides Cpb
Introducing our well designed Fitness Watch Comparison Chart In Powerpoint And Google Slides Cpb. This PowerPoint design presents information on topics like Fitness Watch Comparison Chart. As it is predesigned it helps boost your confidence level. It also makes you a better presenter because of its high quality content and graphics. This PPT layout can be downloaded and used in different formats like PDF, PNG, and JPG. Not only this, it is available in both Standard Screen and Widescreen aspect ratios for your convenience. Therefore, click on the download button now to persuade and impress your audience. Our Fitness Watch Comparison Chart In Powerpoint And Google Slides Cpb are topically designed to provide an attractive backdrop to any subject. Use them to look like a presentation pro.
Cost Comparison Ppt PowerPoint Presentation Icon Styles Cpb
This is a cost comparison ppt powerpoint presentation icon styles cpb. This is a five stage process. The stages in this process are cost comparison.
Comparison Chart Template Powerpoint In Powerpoint And Google Slides Cpb
Introducing our well-designed Comparison Chart Template Powerpoint In Powerpoint And Google Slides Cpb. This PowerPoint design presents information on topics like Comparison Chart Template Powerpoint. As it is predesigned it helps boost your confidence level. It also makes you a better presenter because of its high-quality content and graphics. This PPT layout can be downloaded and used in different formats like PDF, PNG, and JPG. Not only this, it is available in both Standard Screen and Widescreen aspect ratios for your convenience. Therefore, click on the download button now to persuade and impress your audience. Our Comparison Chart Template Powerpoint In Powerpoint And Google Slides Cpb are topically designed to provide an attractive backdrop to any subject. Use them to look like a presentation pro.
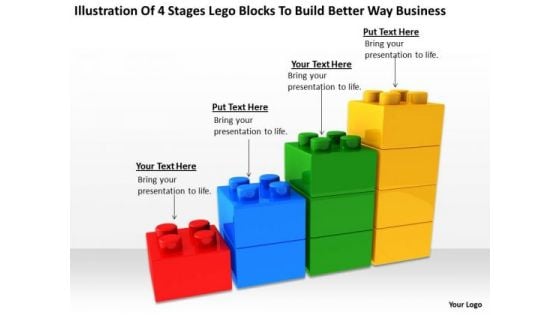
4 Stages Lego Blocks To Build Better Way Business Sports Bar Plan PowerPoint Slides
We present our 4 stages lego blocks to build better way business sports bar plan PowerPoint Slides.Download our Process and Flows PowerPoint Templates because It can Conjure up grand ideas with our magical PowerPoint Templates and Slides. Leave everyone awestruck by the end of your presentation. Download our Flow Charts PowerPoint Templates because Our PowerPoint Templates and Slides will definately Enhance the stature of your presentation. Adorn the beauty of your thoughts with their colourful backgrounds. Download and present our Business PowerPoint Templates because Our PowerPoint Templates and Slides offer you the needful to organise your thoughts. Use them to list out your views in a logical sequence. Present our Marketing PowerPoint Templates because Our PowerPoint Templates and Slides are created with admirable insight. Use them and give your group a sense of your logical mind. Download our Success PowerPoint Templates because Our PowerPoint Templates and Slides will help you be quick off the draw. Just enter your specific text and see your points hit home.Use these PowerPoint slides for presentations relating to Lego, building, concept, standard, electric, brick, economy, conservation, bar, eco, power, pollution, consumption, render, diagram, electricity, ecology, level, effectiveness, scale, idea, graph, protection, energy, comparison, object, efficiency, chart, protect, efficient, rating, norm, color, toy, friendly, saving, background, environment, ecological, construction, game, block, effective. The prominent colors used in the PowerPoint template are Yellow, Green, Blue. Our 4 Stages Lego Blocks To Build Better Way Business Sports Bar Plan PowerPoint Slides make the audience ache for more. They will ask for your views again and again.
Kindle Tablet Comparison Chart In Powerpoint And Google Slides Cpb
Introducing our well designed Kindle Tablet Comparison Chart In Powerpoint And Google Slides Cpb This PowerPoint design presents information on topics like Kindle Tablet Comparison Chart As it is predesigned it helps boost your confidence level. It also makes you a better presenter because of its high quality content and graphics. This PPT layout can be downloaded and used in different formats like PDF, PNG, and JPG. Not only this, it is available in both Standard Screen and Widescreen aspect ratios for your convenience. Therefore, click on the download button now to persuade and impress your audience. Our Kindle Tablet Comparison Chart In Powerpoint And Google Slides Cpb are topically designed to provide an attractive backdrop to any subject. Use them to look like a presentation pro.
Processor Comparison Chart In Powerpoint And Google Slides Cpb
Introducing our well-designed Processor Comparison Chart In Powerpoint And Google Slides Cpb. This PowerPoint design presents information on topics like Processor Comparison Chart. As it is predesigned it helps boost your confidence level. It also makes you a better presenter because of its high-quality content and graphics. This PPT layout can be downloaded and used in different formats like PDF, PNG, and JPG. Not only this, it is available in both Standard Screen and Widescreen aspect ratios for your convenience. Therefore, click on the download button now to persuade and impress your audience. Our Processor Comparison Chart In Powerpoint And Google Slides Cpb are topically designed to provide an attractive backdrop to any subject. Use them to look like a presentation pro.
Online Mattress Comparison In Powerpoint And Google Slides Cpb
Presenting our innovatively designed set of slides titled Online Mattress Comparison In Powerpoint And Google Slides Cpb. This completely editable PowerPoint graphic exhibits Online Mattress Comparison that will help you convey the message impactfully. It can be accessed with Google Slides and is available in both standard screen and widescreen aspect ratios. Apart from this, you can download this well structured PowerPoint template design in different formats like PDF, JPG, and PNG. So, click the download button now to gain full access to this PPT design. Our Online Mattress Comparison In Powerpoint And Google Slides Cpb are topically designed to provide an attractive backdrop to any subject. Use them to look like a presentation pro.
Robot Vacuum Comparison In Powerpoint And Google Slides Cpb
Presenting our innovatively designed set of slides titled Robot Vacuum Comparison In Powerpoint And Google Slides Cpb. This completely editable PowerPoint graphic exhibits Robot Vacuum Comparison that will help you convey the message impactfully. It can be accessed with Google Slides and is available in both standard screen and widescreen aspect ratios. Apart from this, you can download this well structured PowerPoint template design in different formats like PDF, JPG, and PNG. So, click the download button now to gain full access to this PPT design. Our Robot Vacuum Comparison In Powerpoint And Google Slides Cpb are topically designed to provide an attractive backdrop to any subject. Use them to look like a presentation pro.
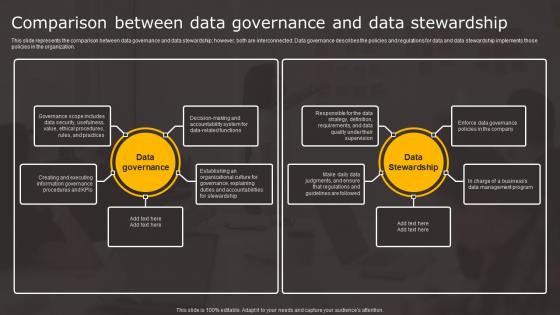
Data Stewardship In Business Processes Comparison Between Data Professional Pdf
This slide represents the comparison between data governance and data stewardship however, both are interconnected. Data governance describes the policies and regulations for data and data stewardship implements those policies in the organization. This Data Stewardship In Business Processes Comparison Between Data Professional Pdf from Slidegeeks makes it easy to present information on your topic with precision. It provides customization options, so you can make changes to the colors, design, graphics, or any other component to create a unique layout. It is also available for immediate download, so you can begin using it right away. Slidegeeks has done good research to ensure that you have everything you need to make your presentation stand out. Make a name out there for a brilliant performance. This slide represents the comparison between data governance and data stewardship however, both are interconnected. Data governance describes the policies and regulations for data and data stewardship implements those policies in the organization.
Processors Comparison In Powerpoint And Google Slides Cpb
Introducing our well designed Processors Comparison In Powerpoint And Google Slides Cpb. This PowerPoint design presents information on topics like Processors Comparison. As it is predesigned it helps boost your confidence level. It also makes you a better presenter because of its high-quality content and graphics. This PPT layout can be downloaded and used in different formats like PDF, PNG, and JPG. Not only this, it is available in both Standard Screen and Widescreen aspect ratios for your convenience. Therefore, click on the download button now to persuade and impress your audience. Our Processors Comparison In Powerpoint And Google Slides Cpb are topically designed to provide an attractive backdrop to any subject. Use them to look like a presentation pro.
Health Comparison In Powerpoint And Google Slides Cpb
Introducing our well-designed Health Comparison In Powerpoint And Google Slides Cpb. This PowerPoint design presents information on topics like Health Comparison. As it is predesigned it helps boost your confidence level. It also makes you a better presenter because of its high-quality content and graphics. This PPT layout can be downloaded and used in different formats like PDF, PNG, and JPG. Not only this, it is available in both Standard Screen and Widescreen aspect ratios for your convenience. Therefore, click on the download button now to persuade and impress your audience. Our Health Comparison In Powerpoint And Google Slides Cpb are topically designed to provide an attractive backdrop to any subject. Use them to look like a presentation pro.


 Continue with Email

 Home
Home


