Comparison Bar Graph

Pie Graph Layer Of Marketing Expenditure Themes PDF
Pitch your topic with ease and precision using this pie graph layer of marketing expenditure themes pdf. This layout presents information on online advertising, trade shows, sales training, catalogs and brochures. It is also available for immediate download and adjustment. So, changes can be made in the color, design, graphics or any other component to create a unique layout.
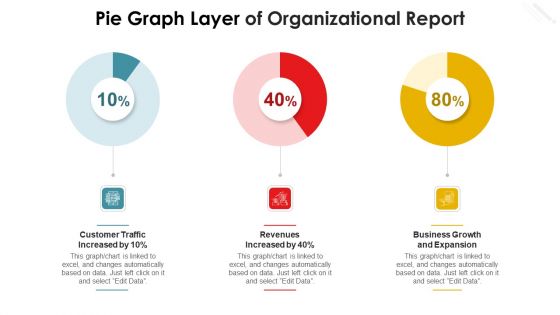
Pie Graph Layer Of Organizational Report Themes PDF
Pitch your topic with ease and precision using this pie graph layer of organizational report themes pdf. This layout presents information on revenues increased by, business growth and expansion, customer traffic increased by. It is also available for immediate download and adjustment. So, changes can be made in the color, design, graphics or any other component to create a unique layout.
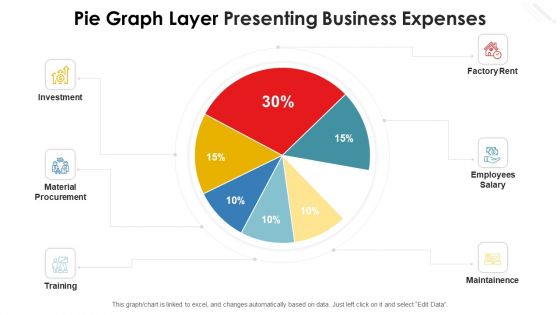
Pie Graph Layer Presenting Business Expenses Topics PDF
Pitch your topic with ease and precision using this pie graph layer presenting business expenses topics pdf. This layout presents information on investment, material procurement, training, employees salary, factory rent. It is also available for immediate download and adjustment. So, changes can be made in the color, design, graphics or any other component to create a unique layout.
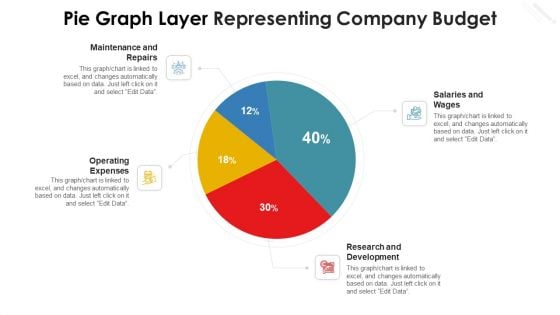
Pie Graph Layer Representing Company Budget Sample PDF
Pitch your topic with ease and precision using this pie graph layer representing company budget sample pdf. This layout presents information on maintenance and repairs, operating expenses, research and development, salaries and wages. It is also available for immediate download and adjustment. So, changes can be made in the color, design, graphics or any other component to create a unique layout.
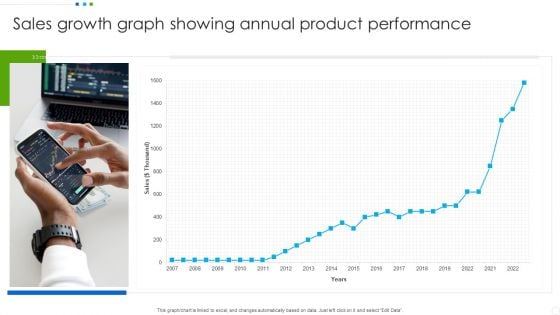
Sales Growth Graph Showing Annual Product Performance Slides PDF
Pitch your topic with ease and precision using this Sales Growth Graph Showing Annual Product Performance Slides PDF. This layout presents information on Sales Growth, Product Performance. It is also available for immediate download and adjustment. So, changes can be made in the color, design, graphics or any other component to create a unique layout.
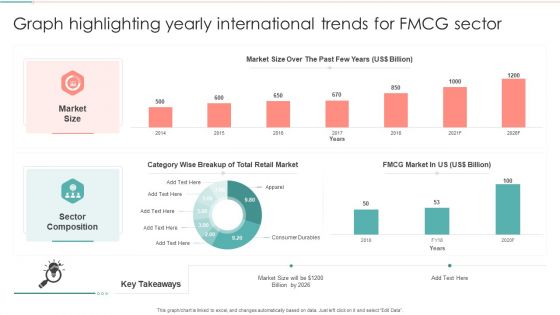
Graph Highlighting Yearly International Trends For FMCG Sector Information PDF
Pitch your topic with ease and precision using this Graph Highlighting Yearly International Trends For FMCG Sector Information PDF. This layout presents information on Sector Composition, Wise Breakup, Retail Market. It is also available for immediate download and adjustment. So, changes can be made in the color, design, graphics or any other component to create a unique layout.
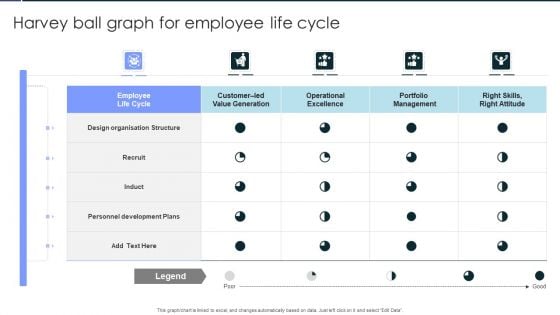
Harvey Ball Graph For Employee Life Cycle Pictures PDF
Pitch your topic with ease and precision using this Harvey Ball Graph For Employee Life Cycle Pictures PDF. This layout presents information on Employee Life Cycle, Design Organisation Structure, Personnel Development Plans . It is also available for immediate download and adjustment. So, changes can be made in the color, design, graphics or any other component to create a unique layout.
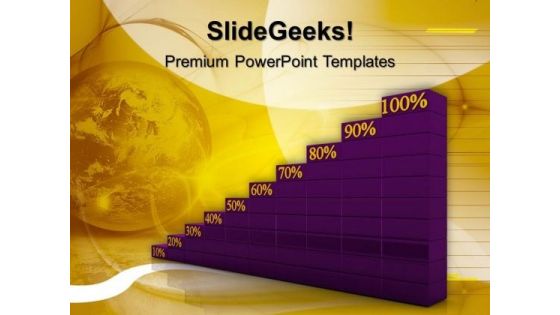
Percentage Graph Progress Business PowerPoint Templates And PowerPoint Themes 1012
Percentage Graph Progress Business PowerPoint Templates And PowerPoint Themes 1012-Using This Beautiful PowerPoint Template you will be able to illustrate the Growth, Progress, development, advancement, improvement, evolution, headway, steps forward, movement, evolvement etc. Our template will help pinpoint their viability. Refine them all as you take them through the numerous filtering stages of the funnel of your quality control process.-Percentage Graph Progress Business PowerPoint Templates And PowerPoint Themes 1012-This PowerPoint template can be used for presentations relating to-Graph Percent Going Up, Success, Business, Finance, Marketing, Money Your address will be the feature. Our Percentage Graph Progress Business PowerPoint Templates And PowerPoint Themes 1012 will ensure the cheers.
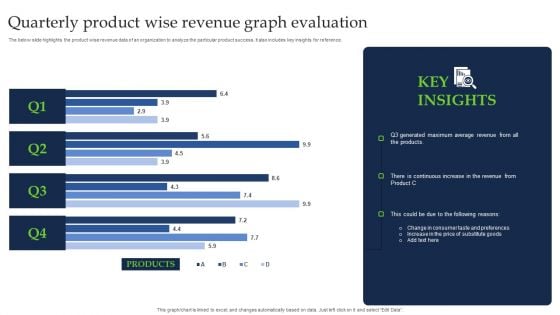
Quarterly Product Wise Revenue Graph Evaluation Brochure PDF
The below slide highlights the product wise revenue data of an organization to analyze the particular product success. It also includes key insights for reference. Pitch your topic with ease and precision using this Quarterly Product Wise Revenue Graph Evaluation Brochure PDF. This layout presents information on Products, Average Revenue. It is also available for immediate download and adjustment. So, changes can be made in the color, design, graphics or any other component to create a unique layout.
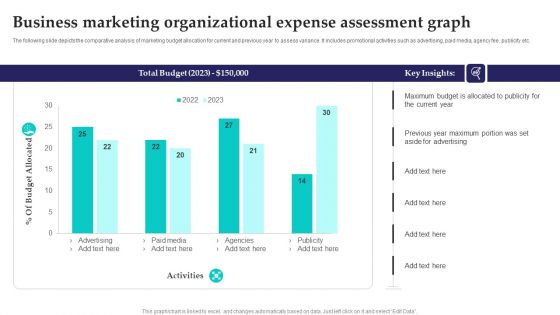
Business Marketing Organizational Expense Assessment Graph Information PDF
The following slide depicts the comparative analysis of marketing budget allocation for current and previous year to assess variance. It includes promotional activities such as advertising, paid media, agency fee, publicity etc. Showcasing this set of slides titled Business Marketing Organizational Expense Assessment Graph Information PDF. The topics addressed in these templates are Paid Media, Advertising, Budget Allocated. All the content presented in this PPT design is completely editable. Download it and make adjustments in color, background, font etc. as per your unique business setting.
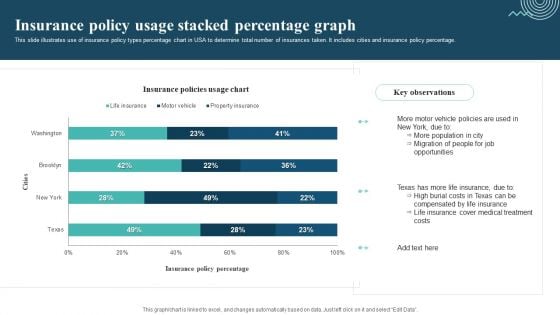
Insurance Policy Usage Stacked Percentage Graph Template PDF
This slide illustrates use of insurance policy types percentage chart in USA to determine total number of insurances taken. It includes cities and insurance policy percentage. Pitch your topic with ease and precision using this Insurance Policy Usage Stacked Percentage Graph Template PDF. This layout presents information on Motor Vehicle Policies, More Population, Migration Of People. It is also available for immediate download and adjustment. So, changes can be made in the color, design, graphics or any other component to create a unique layout.
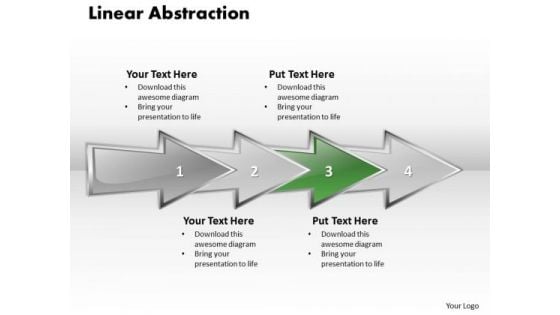
Ppt Linear Abstraction Arrow Animated Graph PowerPoint 2007 Templates
PPT linear abstraction arrow animated graph powerpoint 2007 Templates-Use this diagram to show a progression or sequential steps in a task, process, or workflow. They help to lay the base of your trend of thought and enhance the essence of your viable ideas. Create captivating presentations to deliver comparative and weighted arguments.-PPT linear abstraction arrow animated graph powerpoint 2007 Templates-analysis, arrow, background, business, chart, communication, concept, construction, delivery, design, development, engineering, fabrication, feasibiliti, generated, growth, idea, industry, making, production, products, science, sequence, shape Realign your team with our Ppt Linear Abstraction Arrow Animated Graph PowerPoint 2007 Templates. Download without worries with our money back guaranteee.
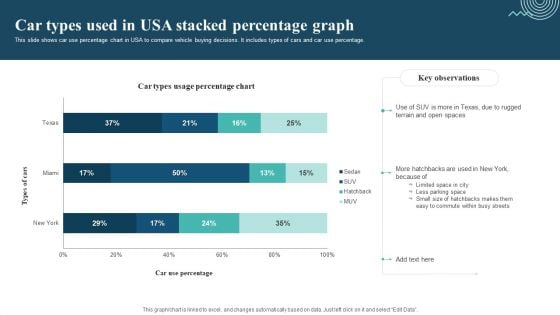
Car Types Used In Usa Stacked Percentage Graph Sample PDF
This slide shows car use percentage chart in USA to compare vehicle buying decisions. It includes types of cars and car use percentage. Pitch your topic with ease and precision using this Car Types Used In Usa Stacked Percentage Graph Sample PDF. This layout presents information on Limited Space In City, Less Parking Space, Easy To Commute. It is also available for immediate download and adjustment. So, changes can be made in the color, design, graphics or any other component to create a unique layout.
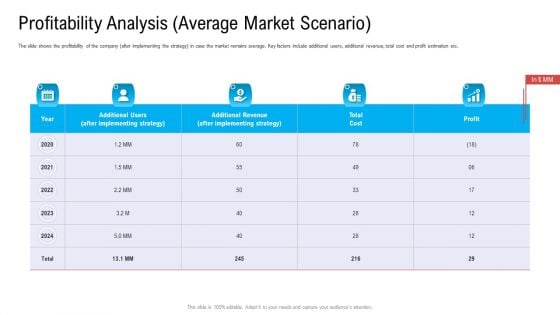
Profitability Analysis Average Market Scenario Ppt Diagram Graph Charts PDF
The slide shows the profitability of the company after implementing the strategy in case the market remains average. Key factors include additional users, additional revenue, total cost and profit estimation etc. Deliver an awe inspiring pitch with this creative profitability analysis average market scenario ppt diagram graph charts pdf bundle. Topics like implementing strategy, additional revenue, total cost, profit can be discussed with this completely editable template. It is available for immediate download depending on the needs and requirements of the user.
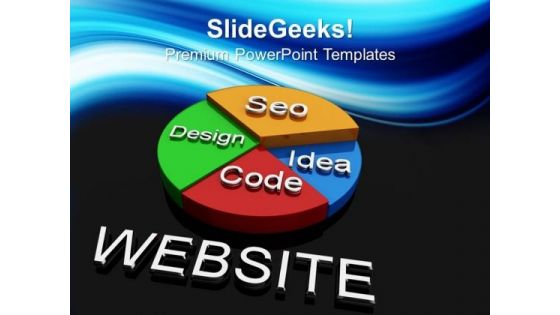
Website Graph Concept Communication PowerPoint Templates And PowerPoint Themes 1112
We present our Website Graph Concept Communication PowerPoint Templates And PowerPoint Themes 1112.Use our Success PowerPoint Templates because, You have it all down to a nicety, slice by slice, layer by layer. Use our Marketing PowerPoint Templates because, Illustrate these thoughts with this slide. Use our Design PowerPoint Templates because, Business 3D Circular Puzzle:- Your business and plans for its growth consist of processes that are highly co-related. Use our Business PowerPoint Templates because,Marketing Strategy Business Template:- Maximising sales of your product is the intended destination. Use our Symbol PowerPoint Templates because, Emphasise the benefits of healthy food habits and lifestyles in respect of vital organs of the human anatomy.Use these PowerPoint slides for presentations relating to Website graph concept business design success marketing symbol . The prominent colors used in the PowerPoint template are Blue, Red, Green Our Website Graph Concept Communication PowerPoint Templates And PowerPoint Themes 1112 will boost even a faint hope. They build up the belief in positive action.
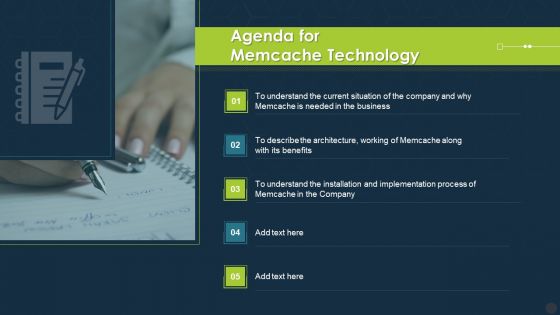
Agenda For Memcache Technology Ppt Diagram Graph Charts PDF
This is a agenda for memcache technology ppt diagram graph charts pdf template with various stages. Focus and dispense information on five stages using this creative set, that comes with editable features. It contains large content boxes to add your information on topics like benefits, implementation, business. You can also showcase facts, figures, and other relevant content using this PPT layout. Grab it now.
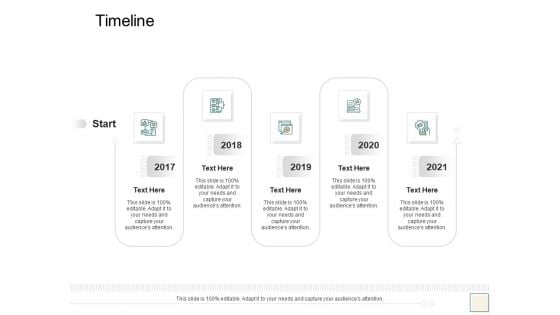
B2B Trade Management Timeline Ppt Diagram Graph Charts PDF
This is a b2b trade management timeline ppt diagram graph charts pdf template with various stages. Focus and dispense information on five stages using this creative set, that comes with editable features. It contains large content boxes to add your information on topics like timeline, 2017 to 2021. You can also showcase facts, figures, and other relevant content using this PPT layout. Grab it now.
Growth Graph Business Success PowerPoint Templates And PowerPoint Themes 1112
We present our Growth Graph Business Success PowerPoint Templates And PowerPoint Themes 1112.Use our Marketing PowerPoint Templates because, It is in your DNA to analyse possible causes to the minutest detail. Use our Money PowerPoint Templates because,Saves your time a prized possession, an ideal aid to give an ideal presentation. Use our Business PowerPoint Templates because, Amplify on your views and plans for getting ahead and then the manner in which you intend staying ahead. Use our Success PowerPoint Templates because, Illustrate your plans on using the many social media modes available to inform soceity at large of the benefits of your product. Use our Finance PowerPoint Templates because, Business ethics is an essential element in your growth.Use these PowerPoint slides for presentations relating to Business growth , success, marketing, money, business, finance. The prominent colors used in the PowerPoint template are Gray, White, Black Open up the windows of your mind. Unlatch them with our Growth Graph Business Success PowerPoint Templates And PowerPoint Themes 1112.

Human Resource Graph Ppt PowerPoint Presentation Complete With Slides
This Human Resource Graph Ppt PowerPoint Presentation Complete With Slides acts as backup support for your ideas, vision, thoughts, etc. Use it to present a thorough understanding of the topic. This PPT slideshow can be utilized for both in-house and outside presentations depending upon your needs and business demands. Entailing tweleve slides with a consistent design and theme, this template will make a solid use case. As it is intuitively designed, it suits every business vertical and industry. All you have to do is make a few tweaks in the content or any other component to design unique presentations. The biggest advantage of this complete deck is that it can be personalized multiple times once downloaded. The color, design, shapes, and other elements are free to modify to add personal touches. You can also insert your logo design in this PPT layout. Therefore a well-thought and crafted presentation can be delivered with ease and precision by downloading this Human Resource Graph Ppt PowerPoint Presentation Complete With Slides PPT slideshow.

Trend Graph Ppt PowerPoint Presentation Complete Deck With Slides
This Trend Graph Ppt PowerPoint Presentation Complete Deck With Slides acts as backup support for your ideas, vision, thoughts, etc. Use it to present a thorough understanding of the topic. This PPT slideshow can be utilized for both in-house and outside presentations depending upon your needs and business demands. Entailing twelve slides with a consistent design and theme, this template will make a solid use case. As it is intuitively designed, it suits every business vertical and industry. All you have to do is make a few tweaks in the content or any other component to design unique presentations. The biggest advantage of this complete deck is that it can be personalized multiple times once downloaded. The color, design, shapes, and other elements are free to modify to add personal touches. You can also insert your logo design in this PPT layout. Therefore a well-thought and crafted presentation can be delivered with ease and precision by downloading this Trend Graph Ppt PowerPoint Presentation Complete Deck With Slides PPT slideshow.
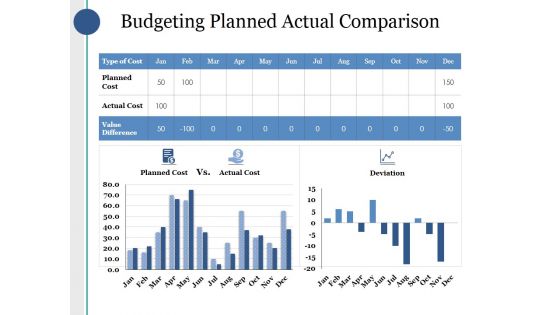
Budgeting Planned Actual Comparison Ppt PowerPoint Presentation Portfolio Background
This is a budgeting planned actual comparison ppt powerpoint presentation portfolio background. This is a three stage process. The stages in this process are planned cost, actual cost, value difference, deviation, bar graph.
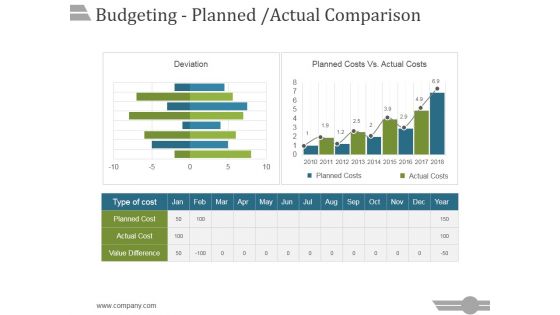
Budgeting Planned Actual Comparison Ppt PowerPoint Presentation Portfolio
This is a budgeting planned actual comparison ppt powerpoint presentation portfolio. This is a three stage process. The stages in this process are business, strategy, marketing, analysis, success, bar graph.
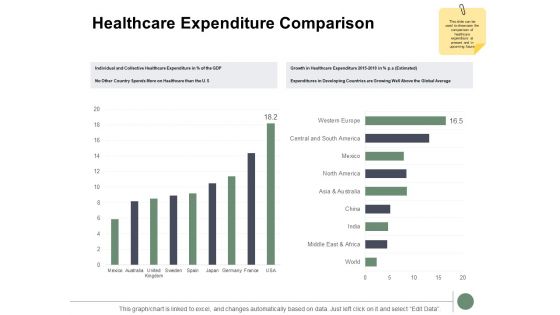
Healthcare Expenditure Comparison Ppt PowerPoint Presentation Gallery Examples
Presenting this set of slides with name healthcare expenditure comparison ppt powerpoint presentation gallery examples. The topics discussed in these slides are bar graph, finance, marketing, analysis, investment. This is a completely editable PowerPoint presentation and is available for immediate download. Download now and impress your audience.
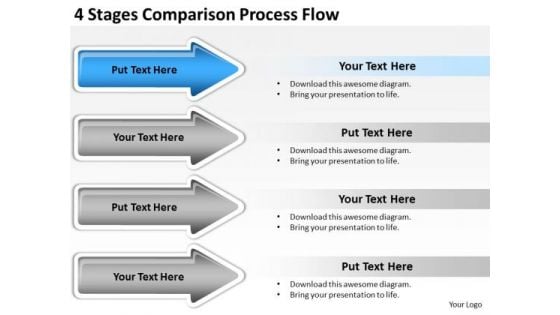
Arrows Stages Comparison Process Flow PowerPoint Templates Backgrounds For Slides
We present our arrows stages comparison process flow PowerPoint templates backgrounds for slides.Use our Flow Charts PowerPoint Templates because You can Inspire your team with our PowerPoint Templates and Slides. Let the force of your ideas flow into their minds. Download our Process and Flows PowerPoint Templates because You are working at that stage with an air of royalty. Let our PowerPoint Templates and Slides be the jewels in your crown. Use our Marketing PowerPoint Templates because You can Zap them with our PowerPoint Templates and Slides. See them reel under the impact. Use our Business PowerPoint Templates because You can Be the puppeteer with our PowerPoint Templates and Slides as your strings. Lead your team through the steps of your script. Present our Shapes PowerPoint Templates because Our PowerPoint Templates and Slides will Activate the energies of your audience. Get their creative juices flowing with your words.Use these PowerPoint slides for presentations relating to Accounting, arrow, bar, blue, business, chart, collection, company, diagram, directive, finance, forecast, future, growth, icon, illustration, market, measure, profit, progress, statistic, stock, success. The prominent colors used in the PowerPoint template are Blue, Gray, White. People tell us our arrows stages comparison process flow PowerPoint templates backgrounds for slides will make you look like a winner. Presenters tell us our company PowerPoint templates and PPT Slides have awesome images to get your point across. Customers tell us our arrows stages comparison process flow PowerPoint templates backgrounds for slides will help them to explain complicated concepts. Customers tell us our bar PowerPoint templates and PPT Slides will save the presenter time. Professionals tell us our arrows stages comparison process flow PowerPoint templates backgrounds for slides will make the presenter look like a pro even if they are not computer savvy. Use our company PowerPoint templates and PPT Slides will save the presenter time. Suggest ideas with our Arrows Stages Comparison Process Flow PowerPoint Templates Backgrounds For Slides. Download without worries with our money back guaranteee.
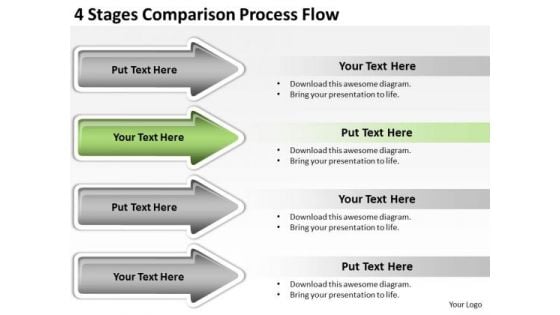
Advantages Of Parallel Processing 4 Stages Comparison Flow PowerPoint Templates
We present our advantages of parallel processing 4 stages comparison flow PowerPoint templates.Download and present our Arrows PowerPoint Templates because you can Add colour to your speech with our PowerPoint Templates and Slides. Your presentation will leave your audience speechless. Use our Business PowerPoint Templates because Our PowerPoint Templates and Slides will Embellish your thoughts. They will help you illustrate the brilliance of your ideas. Use our Steps PowerPoint Templates because Our PowerPoint Templates and Slides will help you be quick off the draw. Just enter your specific text and see your points hit home. Present our Process and Flows PowerPoint Templates because It will Strengthen your hand with your thoughts. They have all the aces you need to win the day. Download our Flow Charts PowerPoint Templates because Our PowerPoint Templates and Slides help you meet the demand of the Market. Just browse and pick the slides that appeal to your intuitive senses.Use these PowerPoint slides for presentations relating to Accounting, arrow, art, bar, blue, business, calculation, chart, collection,company, elements, diagram, directive, expense, finance, firm, forecast,future, gain, graph, grow, growth, icon, illustration, income, line, market, measure,objects, office, profit, progress, rate, set, statistic, stock, success, two, up, . The prominent colors used in the PowerPoint template are Green lime , White, Gray. The feedback we get is that our advantages of parallel processing 4 stages comparison flow PowerPoint templates are readymade to fit into any presentation structure. Professionals tell us our blue PowerPoint templates and PPT Slides will make you look like a winner. Use our advantages of parallel processing 4 stages comparison flow PowerPoint templates are the best it can get when it comes to presenting. Presenters tell us our bar PowerPoint templates and PPT Slides will impress their bosses and teams. You can be sure our advantages of parallel processing 4 stages comparison flow PowerPoint templates are effectively colour coded to prioritise your plans They automatically highlight the sequence of events you desire. PowerPoint presentation experts tell us our chart PowerPoint templates and PPT Slides will impress their bosses and teams. Eliminate doubts with our Advantages Of Parallel Processing 4 Stages Comparison Flow PowerPoint Templates. Download without worries with our money back guaranteee.
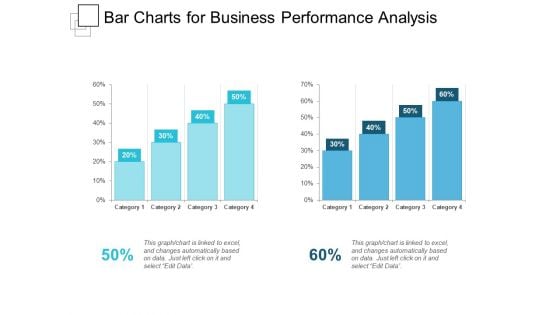
Bar Charts For Business Performance Analysis Ppt PowerPoint Presentation Show Slideshow
This is a bar charts for business performance analysis ppt powerpoint presentation show slideshow. This is a two stage process. The stages in this process are compare, comparison of two, competitive analysis.
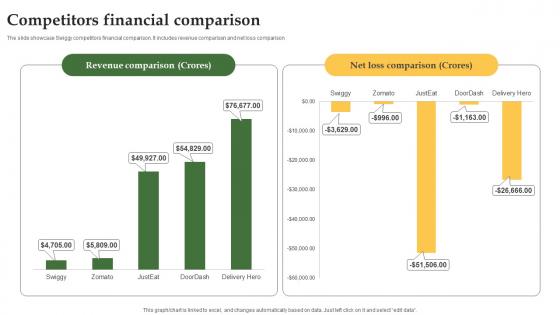
Competitors Financial Comparison Grocery Delivery Company Profile CP SS V
The slide showcase Swiggy competitors financial comparison. It includes revenue comparison and net loss comparison. Do you have to make sure that everyone on your team knows about any specific topic I yes, then you should give Competitors Financial Comparison Grocery Delivery Company Profile CP SS V a try. Our experts have put a lot of knowledge and effort into creating this impeccable Competitors Financial Comparison Grocery Delivery Company Profile CP SS V. You can use this template for your upcoming presentations, as the slides are perfect to represent even the tiniest detail. You can download these templates from the Slidegeeks website and these are easy to edit. So grab these today The slide showcase Swiggy competitors financial comparison. It includes revenue comparison and net loss comparison.
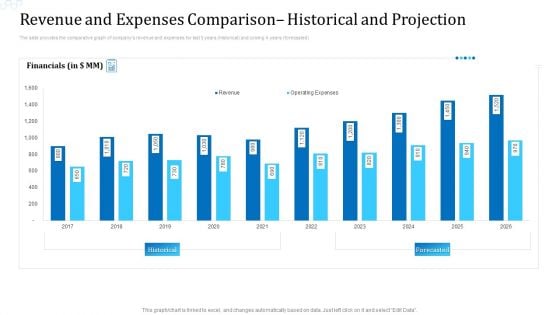
Revenue And Expenses Comparison Historical And Projection Designs PDF
The slide provides the comparative graph of companys revenue and expenses for last 5 years historical and coming 4 years forecasted. Deliver an awe inspiring pitch with this creative revenue and expenses comparison historical and projection designs pdf bundle. Topics like revenue and expenses comparison historical and projection can be discussed with this completely editable template. It is available for immediate download depending on the needs and requirements of the user.
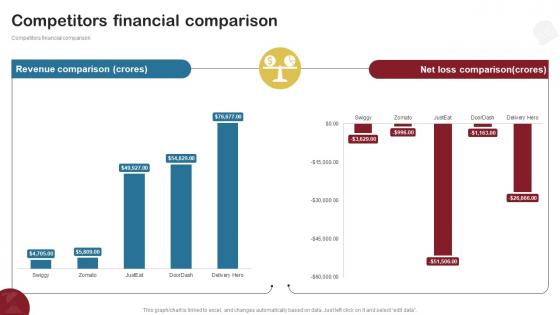
Competitors Financial Comparison Food Delivery Company Profile CP SS V
Competitors financial comparison. Do you have to make sure that everyone on your team knows about any specific topic I yes, then you should give Competitors Financial Comparison Food Delivery Company Profile CP SS V a try. Our experts have put a lot of knowledge and effort into creating this impeccable Competitors Financial Comparison Food Delivery Company Profile CP SS V. You can use this template for your upcoming presentations, as the slides are perfect to represent even the tiniest detail. You can download these templates from the Slidegeeks website and these are easy to edit. So grab these today Competitors financial comparison.
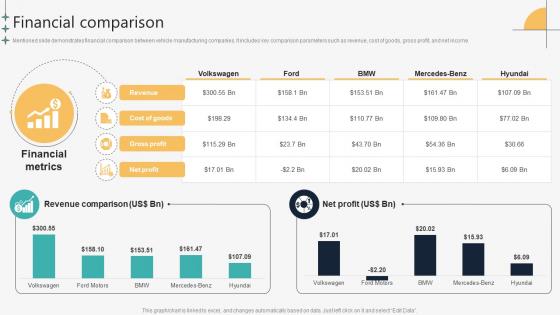
Financial Comparison Automotive Manufacturing Company Profile CP SS V
Mentioned slide demonstrates financial comparison between vehicle manufacturing companies. It includes key comparison parameters such as revenue, cost of goods, gross profit, and net income.Are you in need of a template that can accommodate all of your creative concepts This one is crafted professionally and can be altered to fit any style. Use it with Google Slides or PowerPoint. Include striking photographs, symbols, depictions, and other visuals. Fill, move around, or remove text boxes as desired. Test out color palettes and font mixtures. Edit and save your work, or work with colleagues. Download Financial Comparison Automotive Manufacturing Company Profile CP SS V and observe how to make your presentation outstanding. Give an impeccable presentation to your group and make your presentation unforgettable. Mentioned slide demonstrates financial comparison between vehicle manufacturing companies. It includes key comparison parameters such as revenue, cost of goods, gross profit, and net income.
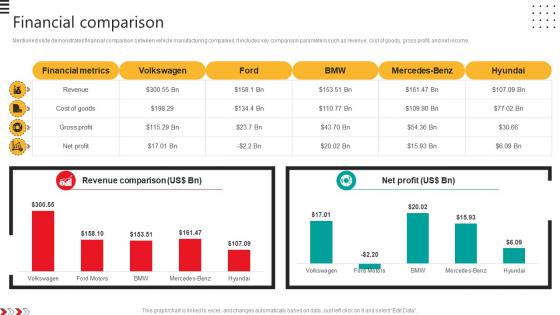
Financial Comparison Automobile Development Company Profile CP SS V
Mentioned slide demonstrates financial comparison between vehicle manufacturing companies. It includes key comparison parameters such as revenue, cost of goods, gross profit, and net income.Are you in need of a template that can accommodate all of your creative concepts This one is crafted professionally and can be altered to fit any style. Use it with Google Slides or PowerPoint. Include striking photographs, symbols, depictions, and other visuals. Fill, move around, or remove text boxes as desired. Test out color palettes and font mixtures. Edit and save your work, or work with colleagues. Download Financial Comparison Automobile Development Company Profile CP SS V and observe how to make your presentation outstanding. Give an impeccable presentation to your group and make your presentation unforgettable. Mentioned slide demonstrates financial comparison between vehicle manufacturing companies. It includes key comparison parameters such as revenue, cost of goods, gross profit, and net income.
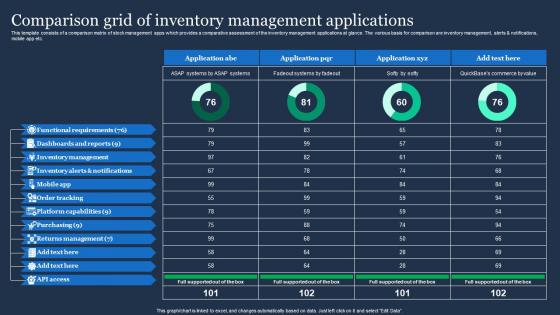
Comparison Grid Of Inventory Management Applications Clipart Pdf
This template consists of a comparison matrix of stock management apps which provides a comparative assessment of the inventory management applications at glance. The various basis for comparison are inventory management, alerts and notifications, mobile app etc. Showcasing this set of slides titled Comparison Grid Of Inventory Management Applications Clipart Pdf. The topics addressed in these templates are Functional Requirements, Dashboards And Reports, Inventory Management. All the content presented in this PPT design is completely editable. Download it and make adjustments in color, background, font etc. as per your unique business setting. This template consists of a comparison matrix of stock management apps which provides a comparative assessment of the inventory management applications at glance. The various basis for comparison are inventory management, alerts and notifications, mobile app etc.
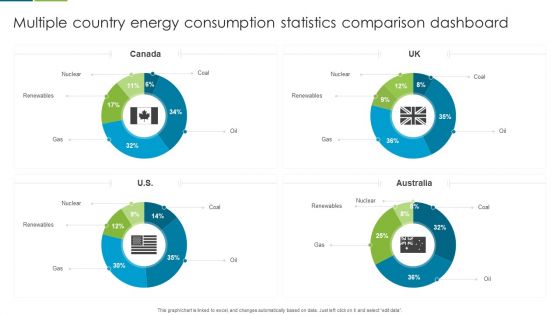
Multiple Country Energy Consumption Statistics Comparison Dashboard Formats PDF
This graph or chart is linked to excel, and changes automatically based on data. Just left click on it and select edit data. Pitch your topic with ease and precision using this Multiple Country Energy Consumption Statistics Comparison Dashboard Formats PDF. This layout presents information on Nuclear, Renewables, Gas. It is also available for immediate download and adjustment. So, changes can be made in the color, design, graphics or any other component to create a unique layout.
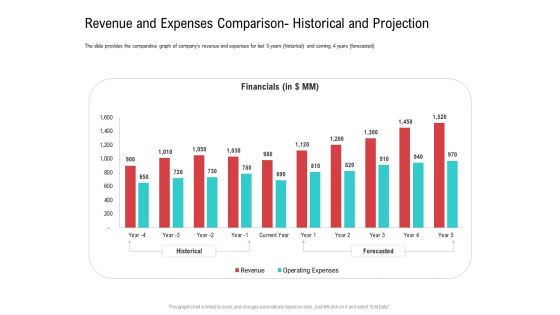
Revenue And Expenses Comparison Historical And Projection Professional PDF
The slide provides the comparative graph of companys revenue and expenses for last 5 years historical and coming 4 years forecasted. Deliver and pitch your topic in the best possible manner with this revenue and expenses comparison historical and projection professional pdf. Use them to share invaluable insights on revenue, financial, operating expenses and impress your audience. This template can be altered and modified as per your expectations. So, grab it now.
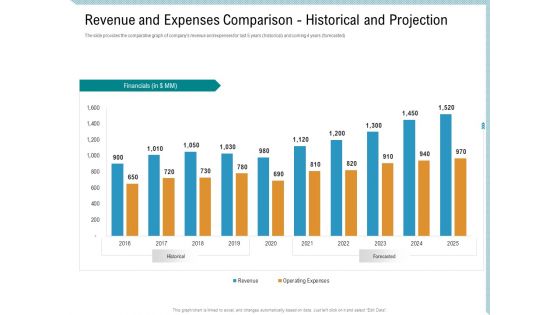
Revenue And Expenses Comparison Historical And Projection Structure PDF
The slide provides the comparative graph of companys revenue and expenses for last 5 years historical and coming 4 years forecasted. Deliver an awe-inspiring pitch with this creative revenue and expenses comparison historical and projection structure pdf bundle. Topics like financials, revenue, operating expenses can be discussed with this completely editable template. It is available for immediate download depending on the needs and requirements of the user.
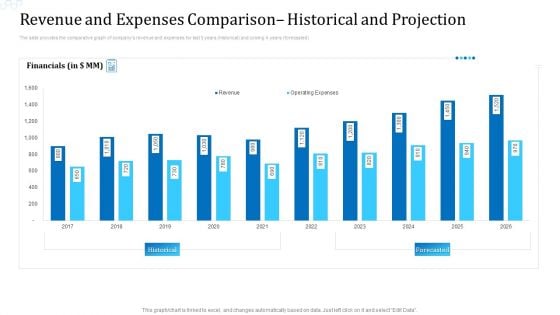
Revenue And Expenses Comparison Historical And Projection Mockup PDF
The slide provides the comparative graph of companys revenue and expenses for last 5 years historical and coming 4 years forecasted. Deliver an awe inspiring pitch with this creative revenue and expenses comparison historical and projection mockup pdf bundle. Topics like financials, revenue, expenses can be discussed with this completely editable template. It is available for immediate download depending on the needs and requirements of the user.
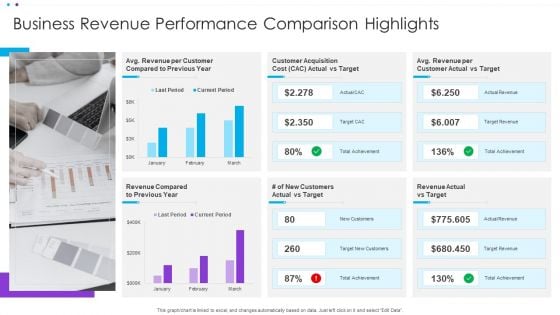
Business Revenue Performance Comparison Highlights Ppt Summary Rules PDF
This graph or chart is linked to excel, and changes automatically based on data. Just left click on it and select Edit Data. Showcasing this set of slides titled Business Revenue Performance Comparison Highlights Ppt Summary Rules PDF. The topics addressed in these templates are Customer Acquisition, Customer Actual, Revenue Compared. All the content presented in this PPT design is completely editable. Download it and make adjustments in color, background, font etc. as per your unique business setting.
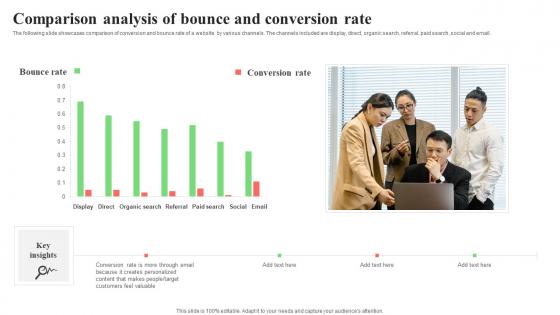
Comparison Analysis Of Bounce And Conversion Rate Topics Pdf
The following slide showcases comparison of conversion and bounce rate of a website by various channels. The channels included are display, direct, organic search, referral, paid search, social and email. Pitch your topic with ease and precision using this Comparison Analysis Of Bounce And Conversion Rate Topics Pdf. This layout presents information on Organic Search, Referral, Paid Search. It is also available for immediate download and adjustment. So, changes can be made in the color, design, graphics or any other component to create a unique layout. The following slide showcases comparison of conversion and bounce rate of a website by various channels. The channels included are display, direct, organic search, referral, paid search, social and email.
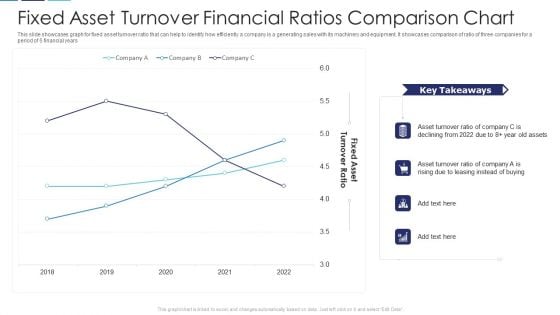
Fixed Asset Turnover Financial Ratios Comparison Chart Structure PDF
This slide showcases graph for fixed asset turnover ratio that can help to identify how efficiently a company is a generating sales with its machinery and equipment. It showcases comparison of ratio of three companies for a period of 5 financial years Showcasing this set of slides titled fixed asset turnover financial ratios comparison chart structure pdf. The topics addressed in these templates are fixed asset turnover financial ratios comparison chart. All the content presented in this PPT design is completely editable. Download it and make adjustments in color, background, font etc. as per your unique business setting.

Dividend Payout Financial Ratios Chart Comparison Themes PDF
This slide showcases dividend payout ratio graph that can help organization to determine the percentage of the companys earnings that is paid out to shareholders by way of dividend. It showcases comparison for a period of 8 years Showcasing this set of slides titled dividend payout financial ratios chart comparison themes pdf. The topics addressed in these templates are dividend payout financial ratios chart comparison. All the content presented in this PPT design is completely editable. Download it and make adjustments in color, background, font etc. as per your unique business setting.
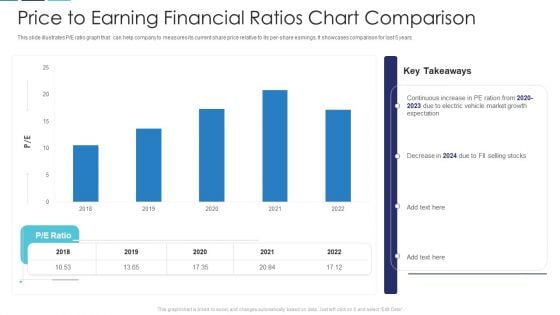
Price To Earning Financial Ratios Chart Comparison Slides PDF
This slide illustrates P or E ratio graph that can help company to measures its current share price relative to its per-share earnings. It showcases comparison for last 5 years Showcasing this set of slides titled price to earning financial ratios chart comparison slides pdf. The topics addressed in these templates are price to earning financial ratios chart comparison. All the content presented in this PPT design is completely editable. Download it and make adjustments in color, background, font etc. as per your unique business setting.
Company Turnover Financial Ratios Chart Comparison Icons PDF
This slide illustrates graph for turnover ratios that are accounts receivable, inventory turnover, accounts payable turnover, fixed asset turnover and total assets turnover ratio. It showcases comparison of three companies. Pitch your topic with ease and precision using this company turnover financial ratios chart comparison icons pdf. This layout presents information on company turnover financial ratios chart comparison. It is also available for immediate download and adjustment. So, changes can be made in the color, design, graphics or any other component to create a unique layout.
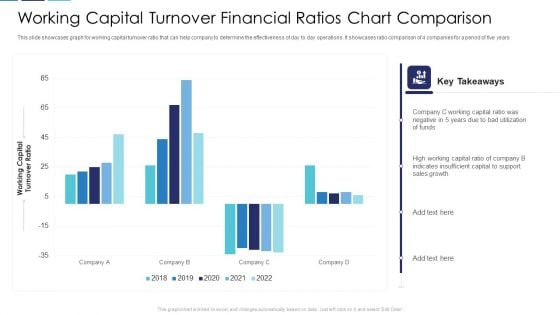
Working Capital Turnover Financial Ratios Chart Comparison Clipart PDF
This slide showcases graph for working capital turnover ratio that can help company to determine the effectiveness of day to day operations. It showcases ratio comparison of 4 companies for a period of five years Pitch your topic with ease and precision using this working capital turnover financial ratios chart comparison clipart pdf. This layout presents information on working capital turnover financial ratios chart comparison. It is also available for immediate download and adjustment. So, changes can be made in the color, design, graphics or any other component to create a unique layout.
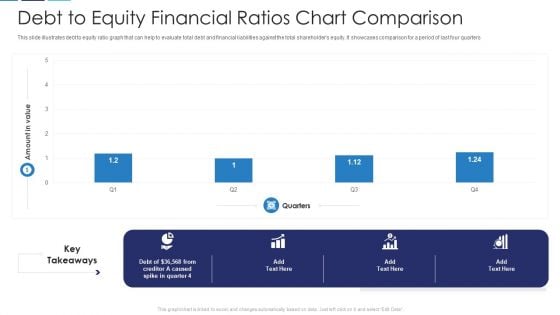
Debt To Equity Financial Ratios Chart Comparison Download PDF
This slide illustrates debt to equity ratio graph that can help to evaluate total debt and financial liabilities against the total shareholders equity. It showcases comparison for a period of last four quarters Pitch your topic with ease and precision using this debt to equity financial ratios chart comparison download pdf. This layout presents information on debt to equity financial ratios chart comparison. It is also available for immediate download and adjustment. So, changes can be made in the color, design, graphics or any other component to create a unique layout.
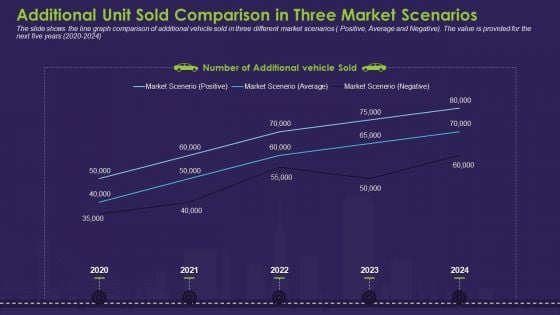
Additional Unit Sold Comparison In Three Market Scenarios Introduction PDF
The slide shows the line graph comparison of additional vehicle sold in three different market scenarios Positive, Average and Negative. The value is provided for the next five years 2020 to 2024.Deliver an awe-inspiring pitch with this creative additional unit sold comparison in three market scenarios introduction pdf. bundle. Topics like market scenario, positive, market scenario average, market scenario negative, 2020 to 2024 can be discussed with this completely editable template. It is available for immediate download depending on the needs and requirements of the user.
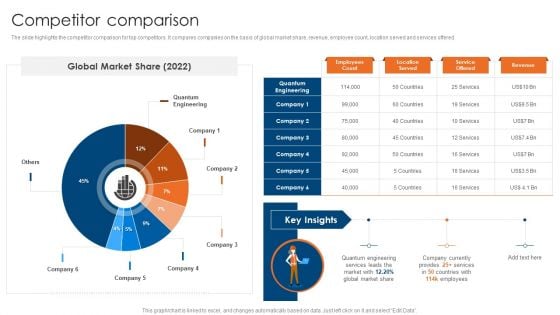
Engineering Consultancy Works Company Profile Competitor Comparison Designs PDF
The slide highlights the competitor comparison for top competitors. It compares companies on the basis of global market share, revenue, employee count, location served and services offered. Deliver an awe inspiring pitch with this creative Engineering Consultancy Works Company Profile Competitor Comparison Designs PDF bundle. Topics like Competitor, Comparison, Global Market can be discussed with this completely editable template. It is available for immediate download depending on the needs and requirements of the user.
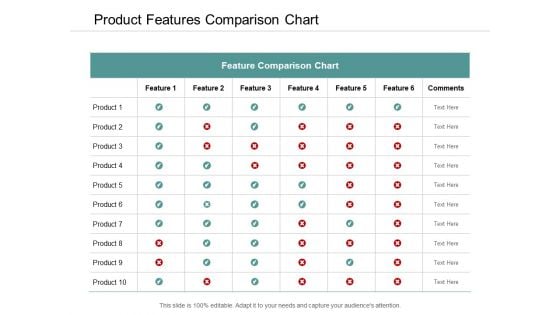
Product Features Comparison Chart Ppt Powerpoint Presentation Model Template
This is a product features comparison chart ppt powerpoint presentation model template. This is a six stage process. The stages in this process are comparison chart, comparison table, comparison matrix.
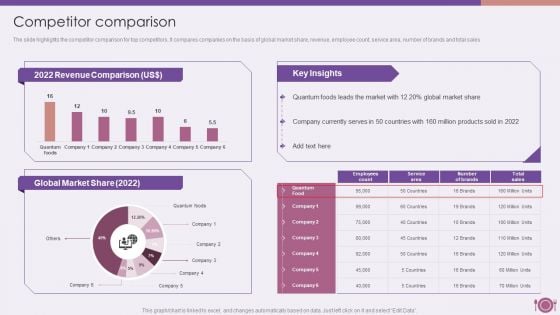
Packaged Food Firm Description Competitor Comparison Rules PDF
The slide highlights the competitor comparison for top competitors. It compares companies on the basis of global market share, revenue, employee count, service area, number of brands and total sales.Deliver and pitch your topic in the best possible manner with this Packaged Food Firm Description Competitor Comparison Rules PDF. Use them to share invaluable insights on Revenue Comparison, Key Insights, Quantum Foods and impress your audience. This template can be altered and modified as per your expectations. So, grab it now.
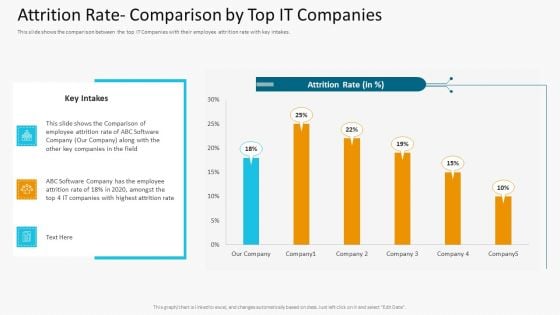
Attrition Rate Comparison By Top IT Companies Information PDF
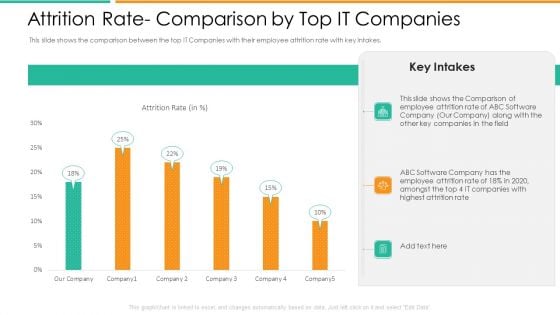
This slide shows the comparison between the top IT Companies with their employee attrition rate with key intakes. Deliver and pitch your topic in the best possible manner with this attrition rate comparison by top it companies information pdf. Use them to share invaluable insights on attrition rate comparison by top it companies and impress your audience. This template can be altered and modified as per your expectations. So, grab it now.
Attrition Rate Comparison By Top It Companies Background PDF
This slide shows the comparison between the top IT Companies with their employee attrition rate with key intakes. Deliver and pitch your topic in the best possible manner with this attrition rate comparison by top it companies background pdf. Use them to share invaluable insights on attrition rate comparison by top it companies and impress your audience. This template can be altered and modified as per your expectations. So, grab it now.
Advertising Services Company Profile Market Share Comparison Rules PDF
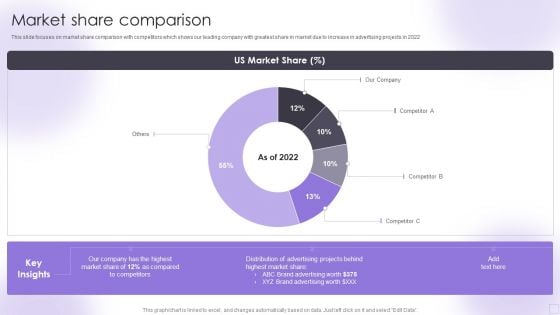
This slide focuses on market share comparison with competitors which shows our leading company with greatest share in market due to increase in advertising projects in 2022. Deliver an awe inspiring pitch with this creative Advertising Services Company Profile Market Share Comparison Rules PDF bundle. Topics like Market Share Comparison can be discussed with this completely editable template. It is available for immediate download depending on the needs and requirements of the user.
Financial Performance Comparison With Competitors Ppt Outline Gallery PDF
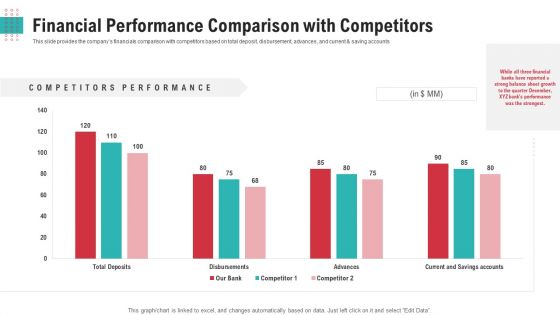
This slide provides the companys financials comparison with competitors based on total deposit, disbursement, advances, and current and saving accounts.Deliver an awe-inspiring pitch with this creative financial performance comparison with competitors ppt outline gallery pdf. bundle. Topics like financial performance comparison with competitors can be discussed with this completely editable template. It is available for immediate download depending on the needs and requirements of the user
Financial Performance Comparison With Competitors Ppt Show Graphics Tutorials PDF
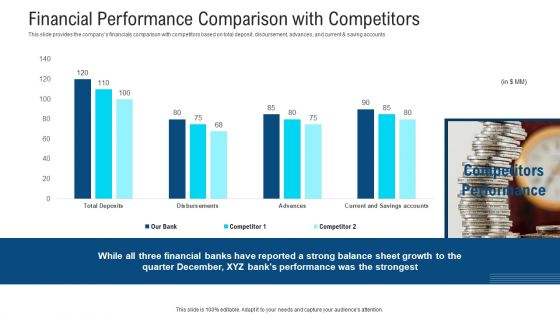
This slide provides the companys financials comparison with competitors based on total deposit, disbursement, advances, and current and saving accounts.Deliver and pitch your topic in the best possible manner with this financial performance comparison with competitors ppt show graphics tutorials pdf. Use them to share invaluable insights on financial performance comparison with competitors and impress your audience. This template can be altered and modified as per your expectations. So, grab it now.
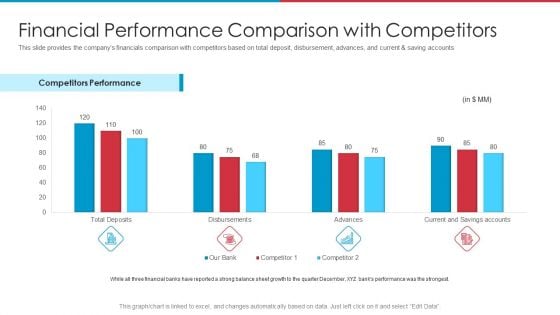
After IPO Equity Financial Performance Comparison With Competitors Brochure PDF
This slide provides the companys financials comparison with competitors based on total deposit, disbursement, advances, and current and saving accounts. Deliver an awe-inspiring pitch with this creative after ipo equity financial performance comparison with competitors brochure pdf bundle. Topics like competitors performance, growth, performance, financial, comparison can be discussed with this completely editable template. It is available for immediate download depending on the needs and requirements of the user.
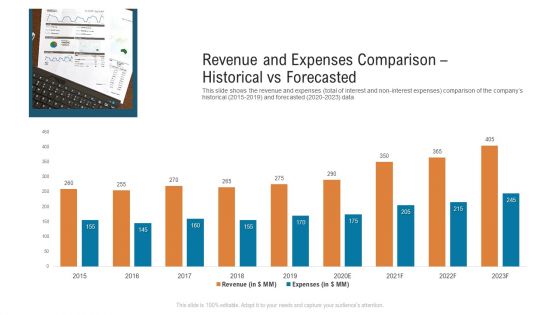
Revenue And Expenses Comparison Historical Vs Forecasted Microsoft PDF
This slide shows the revenue and expenses total of interest and non interest expenses comparison of the companys historical 2015 2019 and forecasted 2020 2023 data. Deliver and pitch your topic in the best possible manner with this revenue and expenses comparison historical vs forecasted microsoft pdf. Use them to share invaluable insights on revenue and expenses comparison historical vs forecasted and impress your audience. This template can be altered and modified as per your expectations. So, grab it now.
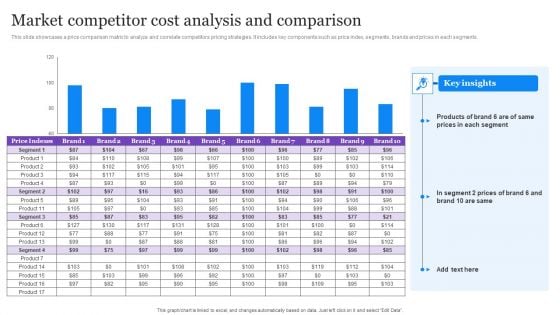
Market Competitor Cost Analysis And Comparison Demonstration PDF
This slide showcases a price comparison matrix to analyze and correlate competitors pricing strategies. It includes key components such as price index, segments, brands and prices in each segments. Showcasing this set of slides titled Market Competitor Cost Analysis And Comparison Demonstration PDF. The topics addressed in these templates are Market Competitor, Cost Analysis And Comparison. All the content presented in this PPT design is completely editable. Download it and make adjustments in color, background, font etc. as per your unique business setting.
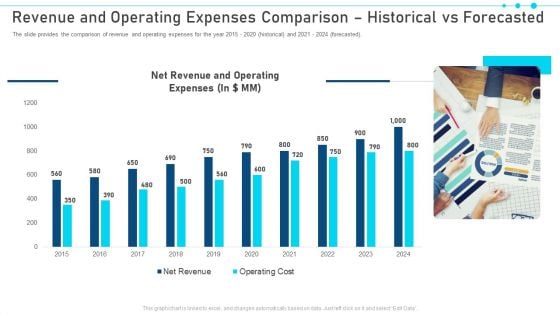
Revenue And Operating Expenses Comparison Historical Vs Forecasted Pictures PDF
The slide provides the comparison of revenue and operating expenses for the year 2015 2020 historical and 2021 2024 forecasted. Deliver an awe-inspiring pitch with this creative revenue and operating expenses comparison historical vs forecasted pictures pdf. bundle. Topics like revenue and operating expenses comparison historical vs forecasted can be discussed with this completely editable template. It is available for immediate download depending on the needs and requirements of the user.
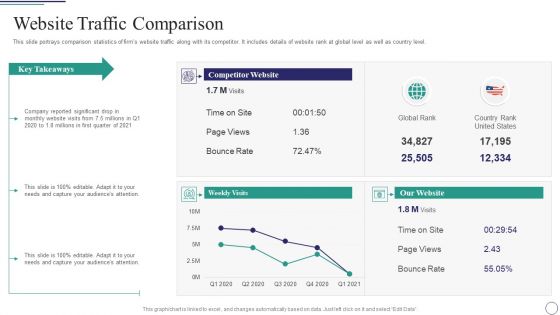
Successful Brand Development Plan Website Traffic Comparison Guidelines PDF
This slide portrays comparison statistics of firms website traffic along with its competitor. It includes details of website rank at global level as well as country level.Deliver an awe inspiring pitch with this creative successful brand development plan website traffic comparison guidelines pdf bundle. Topics like website traffic comparison can be discussed with this completely editable template. It is available for immediate download depending on the needs and requirements of the user.
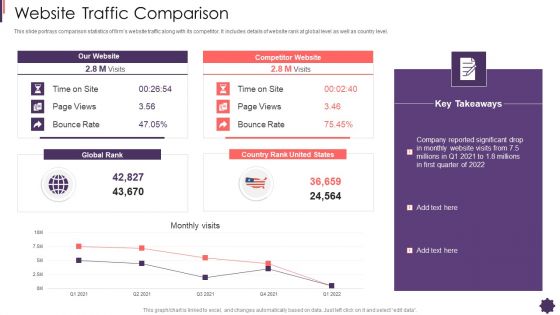
Website Traffic Comparison Brand Techniques Structure Microsoft PDF
This slide portrays comparison statistics of firms website traffic along with its competitor. It includes details of website rank at global level as well as country level. Deliver and pitch your topic in the best possible manner with this website traffic comparison brand techniques structure microsoft pdf. Use them to share invaluable insights on website traffic comparison and impress your audience. This template can be altered and modified as per your expectations. So, grab it now.
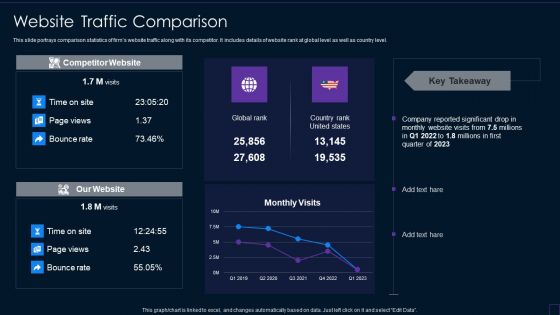
Brand Development Manual Website Traffic Comparison Professional PDF
This slide portrays comparison statistics of firms website traffic along with its competitor. It includes details of website rank at global level as well as country level.Deliver an awe inspiring pitch with this creative Brand Development Manual Website Traffic Comparison Professional PDF bundle. Topics like Website Traffic Comparison can be discussed with this completely editable template. It is available for immediate download depending on the needs and requirements of the user.


 Continue with Email

 Home
Home


