Data Analytics Icons
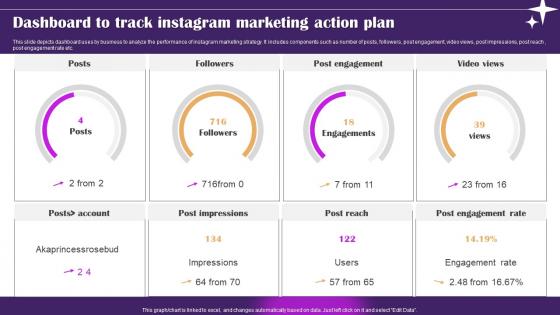
Dashboard To Track Instagram Marketing Action Plan Ppt Professional Image pdf
This slide depicts dashboard uses by business to analyze the performance of instagram marketing strategy. It includes components such as number of posts, followers, post engagement, video views, post impressions, post reach, post engagement rate etc. Showcasing this set of slides titled Dashboard To Track Instagram Marketing Action Plan Ppt Professional Image pdf. The topics addressed in these templates are Post Engagement, Video Views. All the content presented in this PPT design is completely editable. Download it and make adjustments in color, background, font etc. as per your unique business setting. This slide depicts dashboard uses by business to analyze the performance of instagram marketing strategy. It includes components such as number of posts, followers, post engagement, video views, post impressions, post reach , post engagement rate etc.
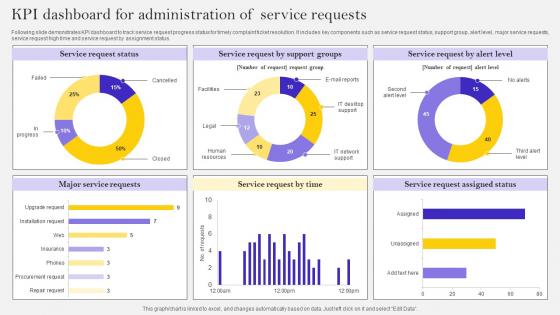
KPI Dashboard For Administration Of Service Requests Ppt Show Inspiration Pdf
Following slide demonstrates KPI dashboard to track service request progress status for timely complaint ticket resolution. It includes key components such as service request status, support group, alert level, major service requests, service request high time and service request by assignment status. Showcasing this set of slides titled KPI Dashboard For Administration Of Service Requests Ppt Show Inspiration Pdf. The topics addressed in these templates are Major Service Requests, Service Request, High Time. All the content presented in this PPT design is completely editable. Download it and make adjustments in color, background, font etc. as per your unique business setting. Following slide demonstrates KPI dashboard to track service request progress status for timely complaint ticket resolution. It includes key components such as service request status, support group, alert level, major service requests, service request high time and service request by assignment status.

Facebook Marketing Plan KPI Dashboard To Monitor Facebook Marketing Strategy SS V
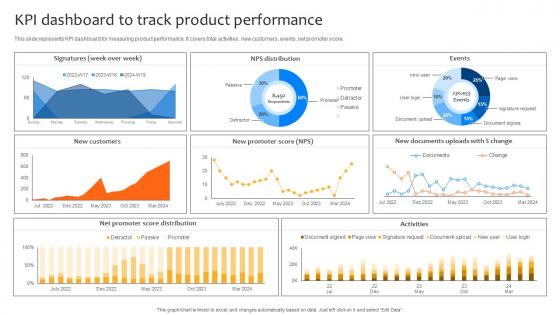
Deploying Strategies For Business KPI Dashboard To Track Product Performance Strategy SS V
This slide represents KPI dashboard for measuring product performance. It covers total activities, new customers, events, net promoter score. Coming up with a presentation necessitates that the majority of the effort goes into the content and the message you intend to convey. The visuals of a PowerPoint presentation can only be effective if it supplements and supports the story that is being told. Keeping this in mind our experts created Deploying Strategies For Business KPI Dashboard To Track Product Performance Strategy SS V to reduce the time that goes into designing the presentation. This way, you can concentrate on the message while our designers take care of providing you with the right template for the situation. This slide represents KPI dashboard for measuring product performance. It covers total activities, new customers, events, net promoter score.
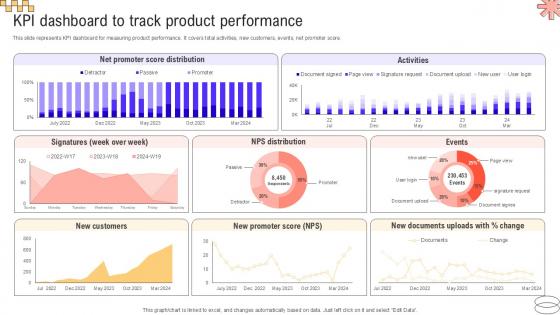
KPI Dashboard To Track Product Implementing Geographic Extension PPT Example Strategy SS V
This slide represents KPI dashboard for measuring product performance. It covers total activities, new customers, events, net promoter score. Coming up with a presentation necessitates that the majority of the effort goes into the content and the message you intend to convey. The visuals of a PowerPoint presentation can only be effective if it supplements and supports the story that is being told. Keeping this in mind our experts created KPI Dashboard To Track Product Implementing Geographic Extension PPT Example Strategy SS V to reduce the time that goes into designing the presentation. This way, you can concentrate on the message while our designers take care of providing you with the right template for the situation. This slide represents KPI dashboard for measuring product performance. It covers total activities, new customers, events, net promoter score.
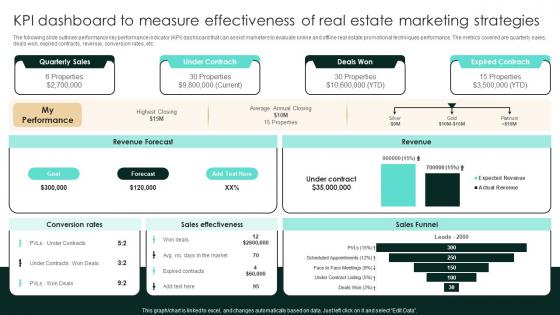
KPI Dashboard To Measure Effectiveness Of Real Estate Marketing Strategic Real Estate Structure Pdf
The following slide outlines performance key performance indicator KPI dashboard that can assist marketers to evaluate online and offline real estate promotional techniques performance. The metrics covered are quarterly sales, deals won, expired contracts, revenue, conversion rates, etc. Here you can discover an assortment of the finest PowerPoint and Google Slides templates. With these templates, you can create presentations for a variety of purposes while simultaneously providing your audience with an eye-catching visual experience. Download KPI Dashboard To Measure Effectiveness Of Real Estate Marketing Strategic Real Estate Structure Pdf to deliver an impeccable presentation. These templates will make your job of preparing presentations much quicker, yet still, maintain a high level of quality. Slidegeeks has experienced researchers who prepare these templates and write high-quality content for you. Later on, you can personalize the content by editing the KPI Dashboard To Measure Effectiveness Of Real Estate Marketing Strategic Real Estate Structure Pdf The following slide outlines performance key performance indicator KPI dashboard that can assist marketers to evaluate online and offline real estate promotional techniques performance. The metrics covered are quarterly sales, deals won, expired contracts, revenue, conversion rates, etc.
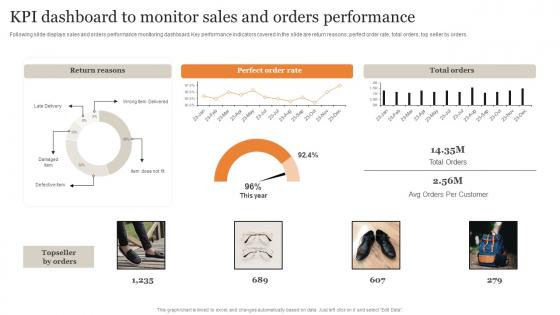
KPI Dashboard To Monitor Sales And Orders Performance Ultimate Guide Implementing Demonstration Pdf
Following slide displays sales and orders performance monitoring dashboard. Key performance indicators covered in the slide are return reasons, perfect order rate, total orders, top seller by orders. Here you can discover an assortment of the finest PowerPoint and Google Slides templates. With these templates, you can create presentations for a variety of purposes while simultaneously providing your audience with an eye-catching visual experience. Download KPI Dashboard To Monitor Sales And Orders Performance Ultimate Guide Implementing Demonstration Pdf to deliver an impeccable presentation. These templates will make your job of preparing presentations much quicker, yet still, maintain a high level of quality. Slidegeeks has experienced researchers who prepare these templates and write high-quality content for you. Later on, you can personalize the content by editing the KPI Dashboard To Monitor Sales And Orders Performance Ultimate Guide Implementing Demonstration Pdf Following slide displays sales and orders performance monitoring dashboard. Key performance indicators covered in the slide are return reasons, perfect order rate, total orders, top seller by orders.

Salon Marketing Plan To Optimize Dashboard Monitoring Sales And Revenue Strategy SS V
This slide presents a dashboard tracking revenue and sales by products and services. It includes KPIs such as revenue by service and products, units sold, monthly revenue. Formulating a presentation can take up a lot of effort and time, so the content and message should always be the primary focus. The visuals of the PowerPoint can enhance the presenters message, so our Salon Marketing Plan To Optimize Dashboard Monitoring Sales And Revenue Strategy SS V was created to help save time. Instead of worrying about the design, the presenter can concentrate on the message while our designers work on creating the ideal templates for whatever situation is needed. Slidegeeks has experts for everything from amazing designs to valuable content, we have put everything into Salon Marketing Plan To Optimize Dashboard Monitoring Sales And Revenue Strategy SS V. This slide presents a dashboard tracking revenue and sales by products and services. It includes KPIs such as revenue by service and products, units sold, monthly revenue.
Erp Management Dashboard For Tracking Gross Erp And Digital Transformation For Maximizing DT SS V
This slide presents a ERP integrated finance monitoring dashboard that helps in tracking gross and net profit margin of business. It monitors KPIs such as balance, quick ratio, current ratio, total income, total expenses, accounts payable.Here you can discover an assortment of the finest PowerPoint and Google Slides templates. With these templates, you can create presentations for a variety of purposes while simultaneously providing your audience with an eye-catching visual experience. Download Erp Management Dashboard For Tracking Gross Erp And Digital Transformation For Maximizing DT SS V to deliver an impeccable presentation. These templates will make your job of preparing presentations much quicker, yet still, maintain a high level of quality. Slidegeeks has experienced researchers who prepare these templates and write high-quality content for you. Later on, you can personalize the content by editing the Erp Management Dashboard For Tracking Gross Erp And Digital Transformation For Maximizing DT SS V. This slide presents a ERP integrated finance monitoring dashboard that helps in tracking gross and net profit margin of business. It monitors KPIs such as balance, quick ratio, current ratio, total income, total expenses, accounts payable.
Cyber Phishing Attacks Tracking Dashboard Man In The Middle Phishing IT
This slide represents the dashboard to track cyber phishing attacks. The purpose of this slide is to provide a graphical representation of cyber attacks occurred in a specific time span. It also depicts the organizations health risk. Formulating a presentation can take up a lot of effort and time, so the content and message should always be the primary focus. The visuals of the PowerPoint can enhance the presenters message, so our Cyber Phishing Attacks Tracking Dashboard Man In The Middle Phishing IT was created to help save time. Instead of worrying about the design, the presenter can concentrate on the message while our designers work on creating the ideal templates for whatever situation is needed. Slidegeeks has experts for everything from amazing designs to valuable content, we have put everything into Cyber Phishing Attacks Tracking Dashboard Man In The Middle Phishing IT This slide represents the dashboard to track cyber phishing attacks. The purpose of this slide is to provide a graphical representation of cyber attacks occurred in a specific time span. It also depicts the organizations health risk.
KPI Dashboard For Tracking Business Investment Portfolio Investment Fund PPT Example
Mentioned slide demonstrates the key performance indicator dashboard of the business financial portfolio.It includes key elements such as portfolio value, yield cost ratio, annual dividends, unrealized gains, investment style, investment allocation by sectors, etc. Here you can discover an assortment of the finest PowerPoint and Google Slides templates. With these templates, you can create presentations for a variety of purposes while simultaneously providing your audience with an eye catching visual experience. Download KPI Dashboard For Tracking Business Investment Portfolio Investment Fund PPT Example to deliver an impeccable presentation. These templates will make your job of preparing presentations much quicker, yet still, maintain a high level of quality. Slidegeeks has experienced researchers who prepare these templates and write high quality content for you. Later on, you can personalize the content by editing the KPI Dashboard For Tracking Business Investment Portfolio Investment Fund PPT Example. Mentioned slide demonstrates the key performance indicator dashboard of the business financial portfolio.It includes key elements such as portfolio value, yield cost ratio, annual dividends, unrealized gains, investment style, investment allocation by sectors, etc.

Digital Technologies For Insurance Claim Management System And Resolution Diagrams Pdf
The following slide represents digital technologies in claim management. It includes various examples such as chatbots, big data, internet of things, customer self service and natural language processing. Pitch your topic with ease and precision using this Digital Technologies For Insurance Claim Management System And Resolution Diagrams Pdf This layout presents information on Customer, Self Service, Internet Of Things It is also available for immediate download and adjustment. So, changes can be made in the color, design, graphics or any other component to create a unique layout. The following slide represents digital technologies in claim management. It includes various examples such as chatbots, big data, internet of things, customer self service and natural language processing.
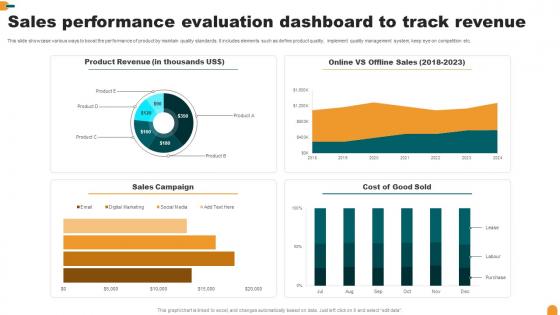
Sales Performance Evaluation Dashboard To Track Revenue Summary Pdf
This slide showcase various ways to boost the performance of product by maintain quality standards. It includes elements such as define product quality, implement quality management system, keep eye on competition etc.Pitch your topic with ease and precision using this Sales Performance Evaluation Dashboard To Track Revenue Summary Pdf This layout presents information on Sales Campaign, Product Revenue, Cost Good Sold It is also available for immediate download and adjustment. So, changes can be made in the color, design, graphics or any other component to create a unique layout. This slide showcase various ways to boost the performance of product by maintain quality standards. It includes elements such as define product quality, implement quality management system, keep eye on competition etc.
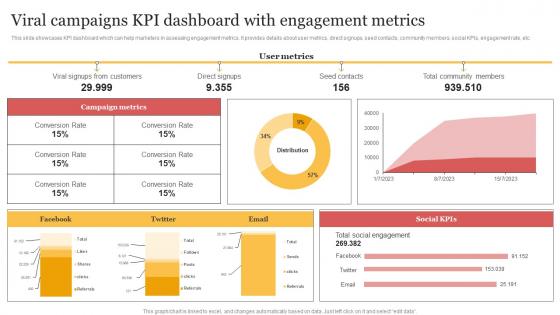
Viral Campaigns KPI Dashboard With Engagement Metrics Organizing Buzzworthy Social Portrait Pdf
This slide showcases KPI dashboard which can help marketers in assessing engagement metrics. It provides details about user metrics, direct signups, seed contacts, community members, social KPIs, engagement rate, etc. This Viral Campaigns KPI Dashboard With Engagement Metrics Organizing Buzzworthy Social Portrait Pdf from Slidegeeks makes it easy to present information on your topic with precision. It provides customization options, so you can make changes to the colors, design, graphics, or any other component to create a unique layout. It is also available for immediate download, so you can begin using it right away. Slidegeeks has done good research to ensure that you have everything you need to make your presentation stand out. Make a name out there for a brilliant performance. This slide showcases KPI dashboard which can help marketers in assessing engagement metrics. It provides details about user metrics, direct signups, seed contacts, community members, social KPIs, engagement rate, etc.
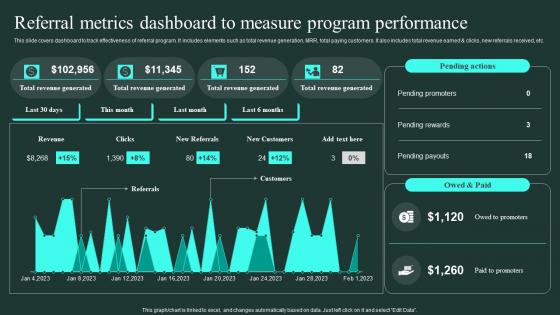
Referral Metrics Dashboard To Measure Program Performance Word Of Mouth Marketing Portrait Pdf
This slide covers dashboard to track effectiveness of referral program. It includes elements such as total revenue generation, MRR, total paying customers. It also includes total revenue earned And clicks, new referrals received, etc. This Referral Metrics Dashboard To Measure Program Performance Word Of Mouth Marketing Portrait Pdf from Slidegeeks makes it easy to present information on your topic with precision. It provides customization options, so you can make changes to the colors, design, graphics, or any other component to create a unique layout. It is also available for immediate download, so you can begin using it right away. Slidegeeks has done good research to ensure that you have everything you need to make your presentation stand out. Make a name out there for a brilliant performance. This slide covers dashboard to track effectiveness of referral program. It includes elements such as total revenue generation, MRR, total paying customers. It also includes total revenue earned and clicks, new referrals received, etc.
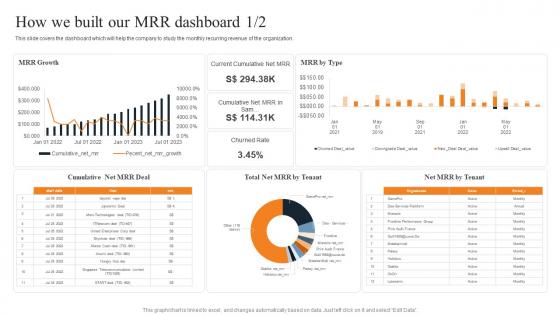
How We Built Our MRR Dashboard Layered Pricing Strategy For Managed Services Mockup Pdf
This slide covers the dashboard which will help the company to study the monthly recurring revenue of the organization. This How We Built Our MRR Dashboard Layered Pricing Strategy For Managed Services Mockup Pdf from Slidegeeks makes it easy to present information on your topic with precision. It provides customization options, so you can make changes to the colors, design, graphics, or any other component to create a unique layout. It is also available for immediate download, so you can begin using it right away. Slidegeeks has done good research to ensure that you have everything you need to make your presentation stand out. Make a name out there for a brilliant performance. This slide covers the dashboard which will help the company to study the monthly recurring revenue of the organization.
Bounce Rate KPI Tracking Dashboard With Average Pages And Time Inspiration Pdf
The following slide showcases dashboard that helps to identify the average time spent on page by visitors and the bounce rate. It also includes page load time, bounce rate by browser and details on internet explorer. Pitch your topic with ease and precision using this Bounce Rate KPI Tracking Dashboard With Average Pages And Time Inspiration Pdf. This layout presents information on Page Load Time, Bounce Rate, Internet Explorer. It is also available for immediate download and adjustment. So, changes can be made in the color, design, graphics or any other component to create a unique layout. The following slide showcases dashboard that helps to identify the average time spent on page by visitors and the bounce rate. It also includes page load time, bounce rate by browser and details on internet explorer.
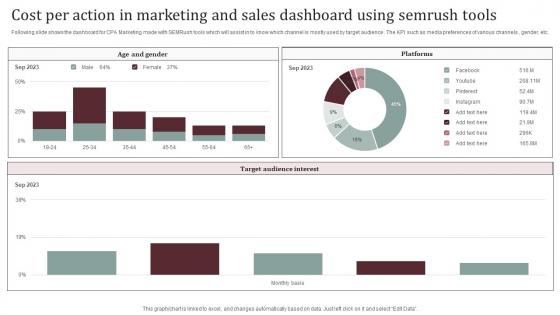
Cost Per Action In Marketing And Sales Dashboard Using Semrush Tools Summary Pdf
Following slide shows the dashboard for CPA Marketing made with SEMRush tools which will assist in to know which channel is mostly used by target audience . The KPI such as media preferences of various channels, gender, etc. Pitch your topic with ease and precision using this Cost Per Action In Marketing And Sales Dashboard Using Semrush Tools Summary Pdf. This layout presents information on Platforms, Target Audience Interest. It is also available for immediate download and adjustment. So, changes can be made in the color, design, graphics or any other component to create a unique layout. Following slide shows the dashboard for CPA Marketing made with SEMRush tools which will assist in to know which channel is mostly used by target audience . The KPI such as media preferences of various channels, gender, etc.
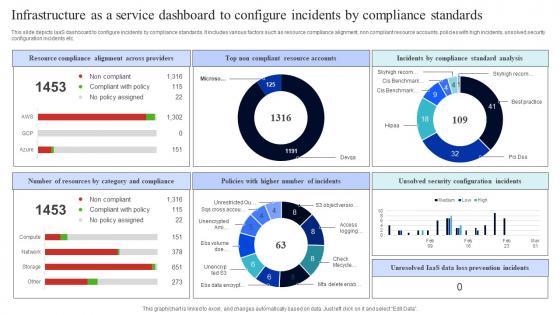
Infrastructure As A Service Dashboard To Configure Incidents By Compliance Standards Rules Pdf
This slide depicts IaaS dashboard to configure incidents by compliance standards. It includes various factors such as resource compliance alignment, non compliant resource accounts, policies with high incidents, unsolved security configuration incidents etc. Pitch your topic with ease and precision using this Infrastructure As A Service Dashboard To Configure Incidents By Compliance Standards Rules Pdf. This layout presents information on Resource Compliance Alignment, Across Providers, Top Non Compliant, Resource Accounts. It is also available for immediate download and adjustment. So, changes can be made in the color, design, graphics or any other component to create a unique layout. This slide depicts IaaS dashboard to configure incidents by compliance standards. It includes various factors such as resource compliance alignment, non compliant resource accounts, policies with high incidents, unsolved security configuration incidents etc.
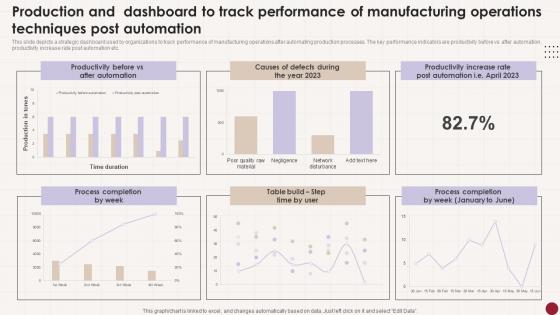
Production And Dashboard To Track Performance Of Manufacturing Operations Techniques Post Automation Tips Pdf
This slide depicts a strategic dashboard used by organizations to track performance of manufacturing operations after automating production processes. The key performance indicators are productivity before vs after automation, productivity increase rate post automation etc. Pitch your topic with ease and precision using this Production And Dashboard To Track Performance Of Manufacturing Operations Techniques Post Automation Tips Pdf This layout presents information on Productivity Before, After Automation, Process Completion It is also available for immediate download and adjustment. So, changes can be made in the color, design, graphics or any other component to create a unique layout. This slide depicts a strategic dashboard used by organizations to track performance of manufacturing operations after automating production processes. The key performance indicators are productivity before vs after automation, productivity increase rate post automation etc.
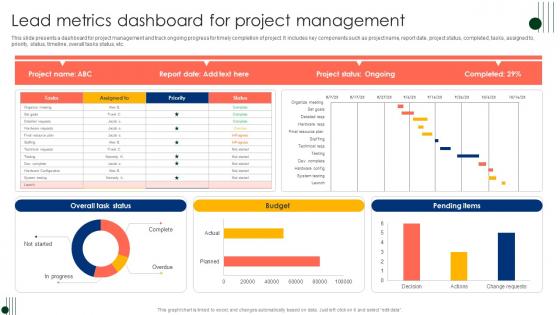
Lead Metrics Dashboard For Project Management Ppt Inspiration Example Introduction Pdf
This slide presents a dashboard for project management and track ongoing progress for timely completion of project. It includes key components such as project name, report date, project status, completed, tasks, assigned to, priority, status, timeline, overall tasks status, etc. Pitch your topic with ease and precision using this Lead Metrics Dashboard For Project Management Ppt Inspiration Example Introduction Pdf. This layout presents information on Project Status, Completed, Tasks, Assigned To. It is also available for immediate download and adjustment. So, changes can be made in the color, design, graphics or any other component to create a unique layout. This slide presents a dashboard for project management and track ongoing progress for timely completion of project. It includes key components such as project name, report date, project status, completed, tasks, assigned to, priority, status, timeline, overall tasks status, etc.
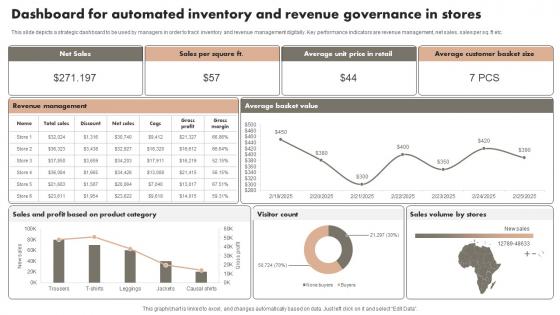
Dashboard For Automated Inventory And Revenue Governance In Stores Microsoft Pdf
This slide depicts a strategic dashboard to be used by managers in order to track inventory and revenue management digitally. Key performance indicators are revenue management, net sales, sales per sq. ft etc. Pitch your topic with ease and precision using this Dashboard For Automated Inventory And Revenue Governance In Stores Microsoft Pdf. This layout presents information on Net Sales, Stores, Category. It is also available for immediate download and adjustment. So, changes can be made in the color, design, graphics or any other component to create a unique layout. This slide depicts a strategic dashboard to be used by managers in order to track inventory and revenue management digitally. Key performance indicators are revenue management, net sales, sales per sq. ft etc.
Kpi Dashboard For Tracking Social Media Campaign Results Powerful Marketing Techniques Strategy SS V
This slide covers the dashboard for analyzing social media marketing campaigns. It includes metrics such as tweets, followers, followings, listed favorites, reach, views, Facebook engagement, clicks, likes, Instagram photos, etc. This Kpi Dashboard For Tracking Social Media Campaign Results Powerful Marketing Techniques Strategy SS V from Slidegeeks makes it easy to present information on your topic with precision. It provides customization options, so you can make changes to the colors, design, graphics, or any other component to create a unique layout. It is also available for immediate download, so you can begin using it right away. Slidegeeks has done good research to ensure that you have everything you need to make your presentation stand out. Make a name out there for a brilliant performance. This slide covers the dashboard for analyzing social media marketing campaigns. It includes metrics such as tweets, followers, followings, listed favorites, reach, views, Facebook engagement, clicks, likes, Instagram photos, etc.

Erp Management Dashboard To Optimize Marketing Erp And Digital Transformation For Maximizing DT SS V
This slide present an ERP management dashboard to help monitor the sales and marketing initiatives and boost business performance. It tracks sales overview, visitors, and campaign performance.This Erp Management Dashboard To Optimize Marketing Erp And Digital Transformation For Maximizing DT SS V from Slidegeeks makes it easy to present information on your topic with precision. It provides customization options, so you can make changes to the colors, design, graphics, or any other component to create a unique layout. It is also available for immediate download, so you can begin using it right away. Slidegeeks has done good research to ensure that you have everything you need to make your presentation stand out. Make a name out there for a brilliant performance. This slide present an ERP management dashboard to help monitor the sales and marketing initiatives and boost business performance. It tracks sales overview, visitors, and campaign performance.
SD Wan Network Performance Tracking Dashboard Wide Area Network Services Portrait Pdf
This slide represents the SD-WAN network performance tracking dashboard. The purpose of this slide is to demonstrate the performance of the SD-WAN network. The main components include control status, site health, transport interface distribution, WAN edge inventory, edge health, and so on. Slidegeeks has constructed SD Wan Network Performance Tracking Dashboard Wide Area Network Services Portrait Pdf after conducting extensive research and examination. These presentation templates are constantly being generated and modified based on user preferences and critiques from editors. Here, you will find the most attractive templates for a range of purposes while taking into account ratings and remarks from users regarding the content. This is an excellent jumping-off point to explore our content and will give new users an insight into our top-notch PowerPoint Templates. This slide represents the SD-WAN network performance tracking dashboard. The purpose of this slide is to demonstrate the performance of the SD-WAN network. The main components include control status, site health, transport interface distribution, WAN edge inventory, edge health, and so on.
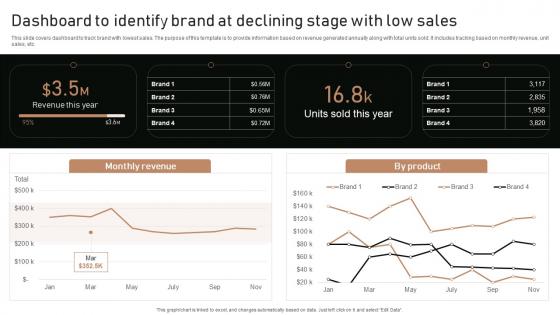
Execution Of Product Lifecycle Dashboard To Identify Brand At Declining Stage Ideas Pdf
This slide covers dashboard to track brand with lowest sales. The purpose of this template is to provide information based on revenue generated annually along with total units sold. It includes tracking based on monthly revenue, unit sales, etc. Get a simple yet stunning designed Execution Of Product Lifecycle Dashboard To Identify Brand At Declining Stage Ideas Pdf. It is the best one to establish the tone in your meetings. It is an excellent way to make your presentations highly effective. So, download this PPT today from Slidegeeks and see the positive impacts. Our easy-to-edit Execution Of Product Lifecycle Dashboard To Identify Brand At Declining Stage Ideas Pdf can be your go-to option for all upcoming conferences and meetings. So, what are you waiting for Grab this template today. This slide covers dashboard to track brand with lowest sales. The purpose of this template is to provide information based on revenue generated annually along with total units sold. It includes tracking based on monthly revenue, unit sales, etc.
How To Create Cost Effective Dashboard For Tracking Facebook Post Strategy SS V
The following slide outlines dashboard through which advertisers can manage Facebook post performance and optimize their marketing strategy. Information covered in this slide is related to key metrics such as impressions per post, engagement rate, click-through rate CTR, likes, etc. Do you have an important presentation coming up Are you looking for something that will make your presentation stand out from the rest Look no further than How To Create Cost Effective Dashboard For Tracking Facebook Post Strategy SS V. With our professional designs, you can trust that your presentation will pop and make delivering it a smooth process. And with Slidegeeks, you can trust that your presentation will be unique and memorable. So why wait Grab How To Create Cost Effective Dashboard For Tracking Facebook Post Strategy SS V today and make your presentation stand out from the rest The following slide outlines dashboard through which advertisers can manage Facebook post performance and optimize their marketing strategy. Information covered in this slide is related to key metrics such as impressions per post, engagement rate, click-through rate CTR, likes, etc.
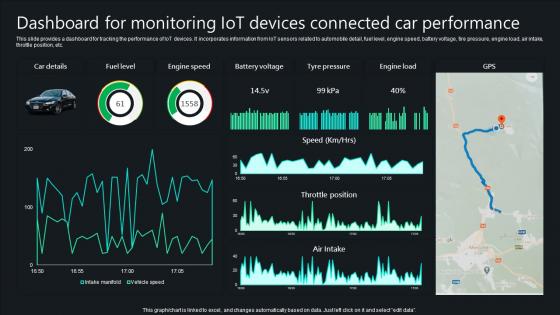
Unlocking Potential IoTs Application Dashboard For Monitoring IoT Devices Connected Car IoT SS V
This slide provides a dashboard for tracking the performance of IoT devices. It incorporates information from IoT sensors related to automobile detail, fuel level, engine speed, battery voltage, tire pressure, engine load, air intake, throttle position, etc. Crafting an eye-catching presentation has never been more straightforward. Let your presentation shine with this tasteful yet straightforward Unlocking Potential IoTs Application Dashboard For Monitoring IoT Devices Connected Car IoT SS V template. It offers a minimalistic and classy look that is great for making a statement. The colors have been employed intelligently to add a bit of playfulness while still remaining professional. Construct the ideal Unlocking Potential IoTs Application Dashboard For Monitoring IoT Devices Connected Car IoT SS V that effortlessly grabs the attention of your audience Begin now and be certain to wow your customers This slide provides a dashboard for tracking the performance of IoT devices. It incorporates information from IoT sensors related to automobile detail, fuel level, engine speed, battery voltage, tire pressure, engine load, air intake, throttle position, etc.
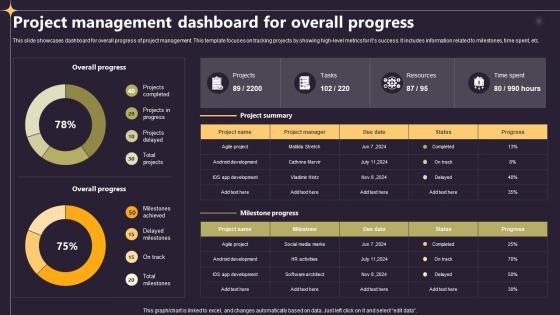
Closing A Project By Fulfilling Project Management Dashboard For Overall Progress PM SS V
This slide showcases dashboard for overall progress of project management. This template focuses on tracking projects by showing high-level metrics for its success. It includes information related to milestones, time spent, etc. This modern and well-arranged Closing A Project By Fulfilling Overview Of Planning Project In An Organisation PM SS V provides lots of creative possibilities. It is very simple to customize and edit with the Powerpoint Software. Just drag and drop your pictures into the shapes. All facets of this template can be edited with Powerpoint, no extra software is necessary. Add your own material, put your images in the places assigned for them, adjust the colors, and then you can show your slides to the world, with an animated slide included. This slide showcases dashboard for overall progress of project management. This template focuses on tracking projects by showing high-level metrics for its success. It includes information related to milestones, time spent, etc.
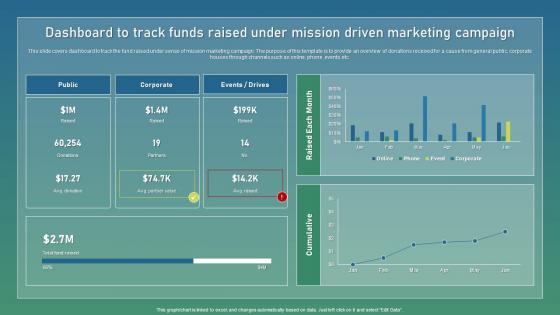
Dashboard To Track Funds Raised Strategic Guide For Sustainable Inspiration Pdf
This slide covers dashboard to track the fund raised under sense of mission marketing campaign. The purpose of this template is to provide an overview of donations received for a cause from general public, corporate houses through channels such as online, phone, events,etc. Find highly impressive Dashboard To Track Funds Raised Strategic Guide For Sustainable Inspiration Pdf on Slidegeeks to deliver a meaningful presentation. You can save an ample amount of time using these presentation templates. No need to worry to prepare everything from scratch because Slidegeeks experts have already done a huge research and work for you. You need to download Dashboard To Track Funds Raised Strategic Guide For Sustainable Inspiration Pdf for your upcoming presentation. All the presentation templates are 100 percent editable and you can change the color and personalize the content accordingly. Download now. This slide covers dashboard to track the fund raised under sense of mission marketing campaign. The purpose of this template is to provide an overview of donations received for a cause from general public, corporate houses through channels such as online, phone, events,etc.
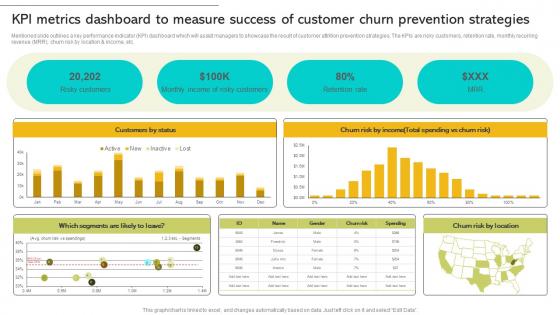
Implementing Strategies To Enhance Kpi Metrics Dashboard To Measure Success Of Customer Churn Ideas PDF
Mentioned slide outlines a key performance indicator KPI dashboard which will assist managers to showcase the result of customer attrition prevention strategies. The KPIs are risky customers, retention rate, monthly recurring revenue MRR, churn risk by location and income, etc. Explore a selection of the finest Implementing Strategies To Enhance Kpi Metrics Dashboard To Measure Success Of Customer Churn Ideas PDF here. With a plethora of professionally designed and pre-made slide templates, you can quickly and easily find the right one for your upcoming presentation. You can use our Implementing Strategies To Enhance Kpi Metrics Dashboard To Measure Success Of Customer Churn Ideas PDF to effectively convey your message to a wider audience. Slidegeeks has done a lot of research before preparing these presentation templates. The content can be personalized and the slides are highly editable. Grab templates today from Slidegeeks. Mentioned slide outlines a key performance indicator KPI dashboard which will assist managers to showcase the result of customer attrition prevention strategies. The KPIs are risky customers, retention rate, monthly recurring revenue MRR, churn risk by location and income, etc.
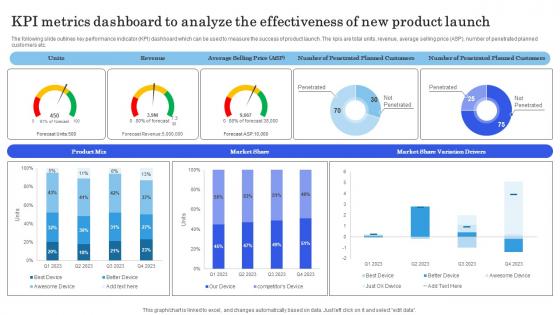
Launching New Commodity Kpi Metrics Dashboard To Analyze The Effectiveness Demonstration Pdf
The following slide outlines key performance indicator KPI dashboard which can be used to measure the success of product launch. The kpis are total units, revenue, average selling price ASP, number of penetrated planned customers etc. Explore a selection of the finest Launching New Commodity Kpi Metrics Dashboard To Analyze The Effectiveness Demonstration Pdf here. With a plethora of professionally designed and pre-made slide templates, you can quickly and easily find the right one for your upcoming presentation. You can use our Launching New Commodity Kpi Metrics Dashboard To Analyze The Effectiveness Demonstration Pdf to effectively convey your message to a wider audience. Slidegeeks has done a lot of research before preparing these presentation templates. The content can be personalized and the slides are highly editable. Grab templates today from Slidegeeks. The following slide outlines key performance indicator KPI dashboard which can be used to measure the success of product launch. The kpis are total units, revenue, average selling price ASP, number of penetrated planned customers etc.
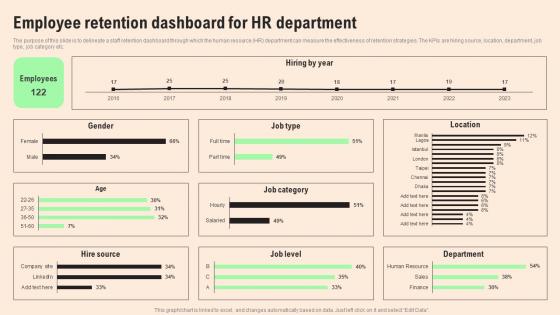
Employee Retention Dashboard HR Retention Techniques For Business Owners Background Pdf
The purpose of this slide is to delineate a staff retention dashboard through which the human resource HR department can measure the effectiveness of retention strategies. The KPIs are hiring source, location, department, job type, job category etc. Explore a selection of the finest Employee Retention Dashboard HR Retention Techniques For Business Owners Background Pdf here. With a plethora of professionally designed and pre made slide templates, you can quickly and easily find the right one for your upcoming presentation. You can use our Employee Retention Dashboard HR Retention Techniques For Business Owners Background Pdf to effectively convey your message to a wider audience. Slidegeeks has done a lot of research before preparing these presentation templates. The content can be personalized and the slides are highly editable. Grab templates today from Slidegeeks. The purpose of this slide is to delineate a staff retention dashboard through which the human resource HR department can measure the effectiveness of retention strategies. The KPIs are hiring source, location, department, job type, job category etc.
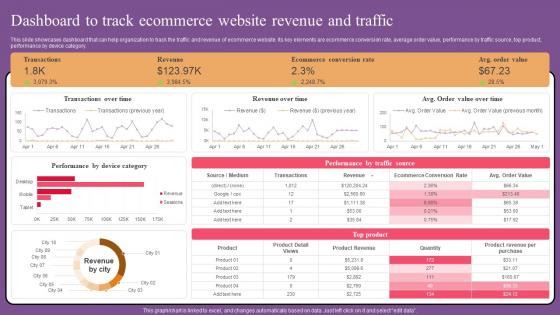
Dashboard Track Ecommerce Website Optimization To Improve Product Sale Professional Pdf
This slide showcases dashboard that can help organization to track the traffic and revenue of ecommerce website. Its key elements are ecommerce conversion rate, average order value, performance by traffic source, top product, performance by device category. Find highly impressive Dashboard Track Ecommerce Website Optimization To Improve Product Sale Professional Pdf on Slidegeeks to deliver a meaningful presentation. You can save an ample amount of time using these presentation templates. No need to worry to prepare everything from scratch because Slidegeeks experts have already done a huge research and work for you. You need to download Dashboard Track Ecommerce Website Optimization To Improve Product Sale Professional Pdf for your upcoming presentation. All the presentation templates are 100 percent editable and you can change the color and personalize the content accordingly. Download now This slide showcases dashboard that can help organization to track the traffic and revenue of ecommerce website. Its key elements are ecommerce conversion rate, average order value, performance by traffic source, top product, performance by device category.
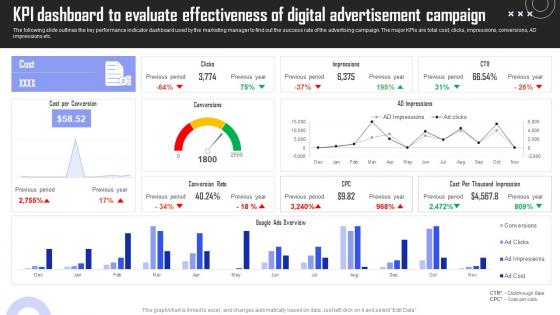
KPI Dashboard Evaluate Brand Building Techniques To Gain Competitive Edge Template Pdf
The following slide outlines the key performance indicator dashboard used by the marketing manager to find out the success rate of the advertising campaign. The major KPIs are total cost, clicks, impressions, conversions, AD impressions etc. Explore a selection of the finest KPI Dashboard Evaluate Brand Building Techniques To Gain Competitive Edge Template Pdf here. With a plethora of professionally designed and pre made slide templates, you can quickly and easily find the right one for your upcoming presentation. You can use our KPI Dashboard Evaluate Brand Building Techniques To Gain Competitive Edge Template Pdf to effectively convey your message to a wider audience. Slidegeeks has done a lot of research before preparing these presentation templates. The content can be personalized and the slides are highly editable. Grab templates today from Slidegeeks. The following slide outlines the key performance indicator dashboard used by the marketing manager to find out the success rate of the advertising campaign. The major KPIs are total cost, clicks, impressions, conversions, AD impressions etc.
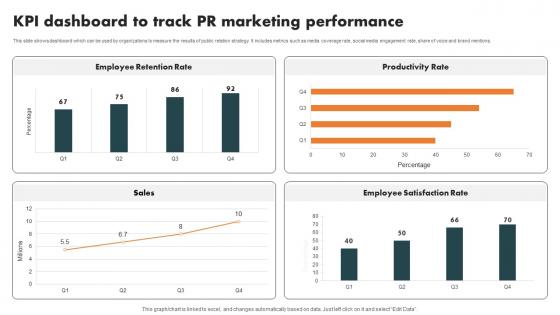
KPI Dashboard Track Pr Internal Branding Strategy For Enhanced Advocacy Infographics Pdf
This slide shows dashboard which can be used by organizations to measure the results of public relation strategy. It includes metrics such as media coverage rate, social media engagement rate, share of voice and brand mentions. Explore a selection of the finest KPI Dashboard Track Pr Internal Branding Strategy For Enhanced Advocacy Infographics Pdf here. With a plethora of professionally designed and pre made slide templates, you can quickly and easily find the right one for your upcoming presentation. You can use our KPI Dashboard Track Pr Internal Branding Strategy For Enhanced Advocacy Infographics Pdf to effectively convey your message to a wider audience. Slidegeeks has done a lot of research before preparing these presentation templates. The content can be personalized and the slides are highly editable. Grab templates today from Slidegeeks. This slide shows dashboard which can be used by organizations to measure the results of public relation strategy. It includes metrics such as media coverage rate, social media engagement rate, share of voice and brand mentions.
Dashboard Tracking Ambassador Implementing Social Media Tactics For Boosting WOM Demonstration Pdf
This slide covers the KPI dashboard for companies to evaluate the performance of ambassador marketing campaigns. It includes metrics such as the number of brand ambassadors, the total number of shares, clicks, CPS, revenue, commissions, etc.Find highly impressive Dashboard Tracking Ambassador Implementing Social Media Tactics For Boosting WOM Demonstration Pdf on Slidegeeks to deliver a meaningful presentation. You can save an ample amount of time using these presentation templates. No need to worry to prepare everything from scratch because Slidegeeks experts have already done a huge research and work for you. You need to download Dashboard Tracking Ambassador Implementing Social Media Tactics For Boosting WOM Demonstration Pdf for your upcoming presentation. All the presentation templates are 100 percent editable and you can change the color and personalize the content accordingly. Download now This slide covers the KPI dashboard for companies to evaluate the performance of ambassador marketing campaigns. It includes metrics such as the number of brand ambassadors, the total number of shares, clicks, CPS, revenue, commissions, etc.
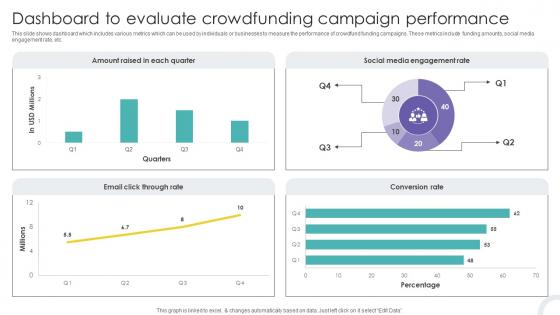
Dashboard To Evaluate Crowdfunding Campaign Crowdfunding Strategies To Raise Funds Fin SS V
This slide shows dashboard which includes various metrics which can be used by individuals or businesses to measure the performance of crowdfund funding campaigns. These metrics include funding amounts, social media engagement rate, etc. Find highly impressive Dashboard To Evaluate Crowdfunding Campaign Crowdfunding Strategies To Raise Funds Fin SS V on Slidegeeks to deliver a meaningful presentation. You can save an ample amount of time using these presentation templates. No need to worry to prepare everything from scratch because Slidegeeks experts have already done a huge research and work for you. You need to download Dashboard To Evaluate Crowdfunding Campaign Crowdfunding Strategies To Raise Funds Fin SS V for your upcoming presentation. All the presentation templates are 100 percent editable and you can change the color and personalize the content accordingly. Download now This slide shows dashboard which includes various metrics which can be used by individuals or businesses to measure the performance of crowdfund funding campaigns. These metrics include funding amounts, social media engagement rate, etc.
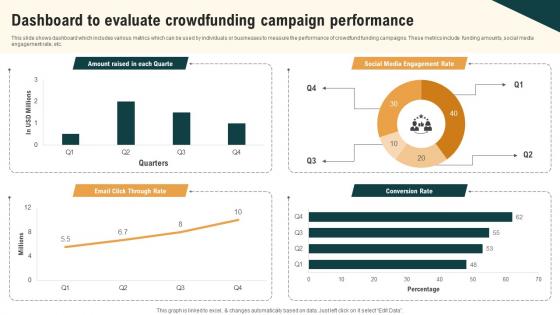
Dashboard To Evaluate Crowdfunding Campaign Real Estate Crowdfunding To Unlock Fin SS V
This slide shows dashboard which includes various metrics which can be used by individuals or businesses to measure the performance of crowdfund funding campaigns. These metrics include funding amounts, social media engagement rate, etc. Find highly impressive Dashboard To Evaluate Crowdfunding Campaign Real Estate Crowdfunding To Unlock Fin SS V on Slidegeeks to deliver a meaningful presentation. You can save an ample amount of time using these presentation templates. No need to worry to prepare everything from scratch because Slidegeeks experts have already done a huge research and work for you. You need to download Dashboard To Evaluate Crowdfunding Campaign Real Estate Crowdfunding To Unlock Fin SS V for your upcoming presentation. All the presentation templates are 100 percent editable and you can change the color and personalize the content accordingly. Download now This slide shows dashboard which includes various metrics which can be used by individuals or businesses to measure the performance of crowdfund funding campaigns. These metrics include funding amounts, social media engagement rate, etc.
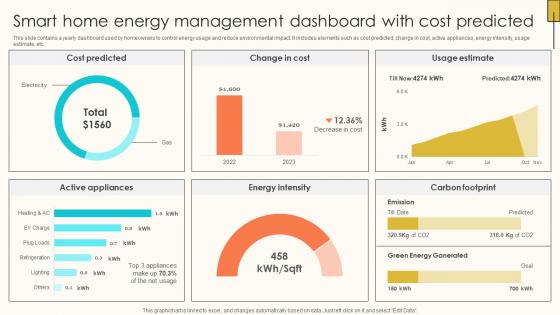
Smart Home Energy Management Dashboard Internet Of Things Solutions To Enhance Energy IoT SS V
This slide contains a yearly dashboard used by homeowners to control energy usage and reduce environmental impact. It includes elements such as cost predicted, change in cost, active appliances, energy intensity, usage estimate, etc. Explore a selection of the finest Smart Home Energy Management Dashboard Internet Of Things Solutions To Enhance Energy IoT SS V here. With a plethora of professionally designed and pre-made slide templates, you can quickly and easily find the right one for your upcoming presentation. You can use our Smart Home Energy Management Dashboard Internet Of Things Solutions To Enhance Energy IoT SS V to effectively convey your message to a wider audience. Slidegeeks has done a lot of research before preparing these presentation templates. The content can be personalized and the slides are highly editable. Grab templates today from Slidegeeks. This slide contains a yearly dashboard used by homeowners to control energy usage and reduce environmental impact. It includes elements such as cost predicted, change in cost, active appliances, energy intensity, usage estimate, etc.
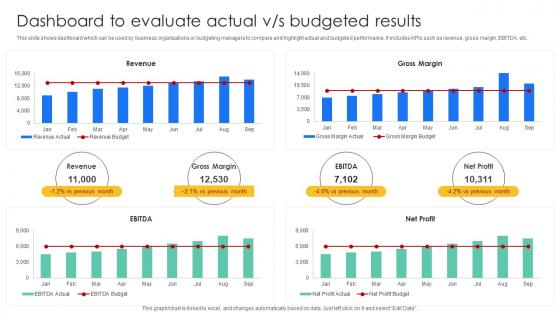
Dashboard To Evaluate Actual Vs Budgeted Results Effective And Efficient Tools To Develop Fin SS V
This slide shows dashboard which can be used by business organizations or budgeting managers to compare and highlight actual and budgeted performance. It includes KPIs such as revenue, gross margin, EBITDA, etc. Find highly impressive Dashboard To Evaluate Actual Vs Budgeted Results Effective And Efficient Tools To Develop Fin SS V on Slidegeeks to deliver a meaningful presentation. You can save an ample amount of time using these presentation templates. No need to worry to prepare everything from scratch because Slidegeeks experts have already done a huge research and work for you. You need to download Dashboard To Evaluate Actual Vs Budgeted Results Effective And Efficient Tools To Develop Fin SS V for your upcoming presentation. All the presentation templates are 100 percent editable and you can change the color and personalize the content accordingly. Download now This slide shows dashboard which can be used by business organizations or budgeting managers to compare and highlight actual and budgeted performance. It includes KPIs such as revenue, gross margin, EBITDA, etc.
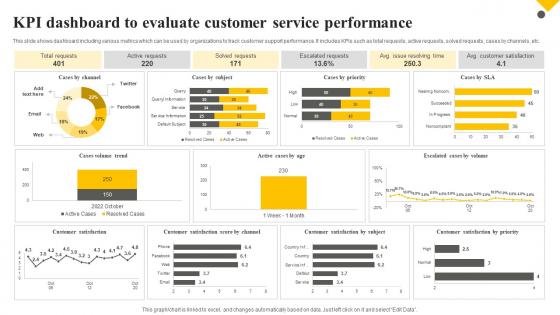
Client Support Plan To Increase Customer Kpi Dashboard To Evaluate Customer Service Performance Strategy SS V
This slide shows dashboard including various metrics which can be used by organizations to track customer support performance. It includes KPIs such as total requests, active requests, solved requests, cases by channels, etc. Find highly impressive Client Support Plan To Increase Customer Kpi Dashboard To Evaluate Customer Service Performance Strategy SS V on Slidegeeks to deliver a meaningful presentation. You can save an ample amount of time using these presentation templates. No need to worry to prepare everything from scratch because Slidegeeks experts have already done a huge research and work for you. You need to download Client Support Plan To Increase Customer Kpi Dashboard To Evaluate Customer Service Performance Strategy SS V for your upcoming presentation. All the presentation templates are 100 percent editable and you can change the color and personalize the content accordingly. Download now This slide shows dashboard including various metrics which can be used by organizations to track customer support performance. It includes KPIs such as total requests, active requests, solved requests, cases by channels, etc.
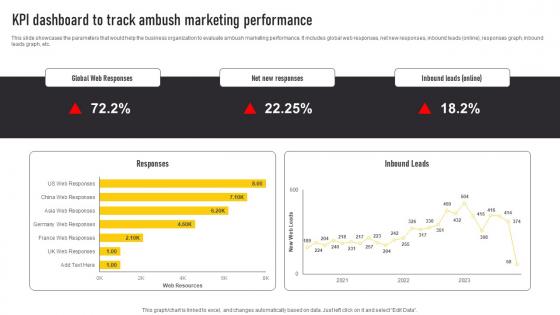
KPI Dashboard To Track Ambush Marketing Performance Automate Guerrilla Promotional Formats Pdf
This slide showcases the parameters that would help the business organization to evaluate ambush marketing performance. It includes global web responses, net new responses, inbound leads online, responses graph, inbound leads graph, etc. Explore a selection of the finest KPI Dashboard To Track Ambush Marketing Performance Automate Guerrilla Promotional Formats Pdf here. With a plethora of professionally designed and pre-made slide templates, you can quickly and easily find the right one for your upcoming presentation. You can use our KPI Dashboard To Track Ambush Marketing Performance Automate Guerrilla Promotional Formats Pdf to effectively convey your message to a wider audience. Slidegeeks has done a lot of research before preparing these presentation templates. The content can be personalized and the slides are highly editable. Grab templates today from Slidegeeks. This slide showcases the parameters that would help the business organization to evaluate ambush marketing performance. It includes global web responses, net new responses, inbound leads online, responses graph, inbound leads graph, etc.
Dashboard For Tracking Viral Marketing Techniques For Generating Brand Awareness Graphics Pdf
This slide showcases the parameters for business organizations to evaluate viral marketing performance. It includes KPIs such as user metrics, campaign metrics, social metrics, engagement rate, viral sign ups, etc. Find highly impressive Dashboard For Tracking Viral Marketing Techniques For Generating Brand Awareness Graphics Pdf on Slidegeeks to deliver a meaningful presentation. You can save an ample amount of time using these presentation templates. No need to worry to prepare everything from scratch because Slidegeeks experts have already done a huge research and work for you. You need to download Dashboard For Tracking Viral Marketing Techniques For Generating Brand Awareness Graphics Pdf for your upcoming presentation. All the presentation templates are 100 percent editable and you can change the color and personalize the content accordingly. Download now This slide showcases the parameters for business organizations to evaluate viral marketing performance. It includes KPIs such as user metrics, campaign metrics, social metrics, engagement rate, viral sign ups, etc.
Dashboard For Tracking Viral Marketing Tracking Word Mouth Marketing Inspiration PDF
This slide showcases the parameters for business organizations to evaluate viral marketing performance. It includes KPIs such as user metrics, campaign metrics, social metrics, engagement rate, viral sign-ups, etc. Find highly impressive Dashboard For Tracking Viral Marketing Tracking Word Mouth Marketing Inspiration PDF on Slidegeeks to deliver a meaningful presentation. You can save an ample amount of time using these presentation templates. No need to worry to prepare everything from scratch because Slidegeeks experts have already done a huge research and work for you. You need to download Dashboard For Tracking Viral Marketing Tracking Word Mouth Marketing Inspiration PDF for your upcoming presentation. All the presentation templates are 100 percent editable and you can change the color and personalize the content accordingly. Download now This slide showcases the parameters for business organizations to evaluate viral marketing performance. It includes KPIs such as user metrics, campaign metrics, social metrics, engagement rate, viral sign-ups, etc.
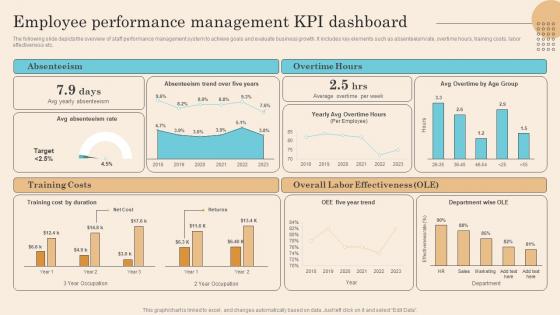
Employee Performance Management Kpi Dashboard Executing Successful Staff Performance Elements Pdf
The following slide depicts the overview of staff performance management system to achieve goals and evaluate business growth. It includes key elements such as absenteeism rate, overtime hours, training costs, labor effectiveness etc. Find highly impressive Employee Performance Management Kpi Dashboard Executing Successful Staff Performance Elements Pdf on Slidegeeks to deliver a meaningful presentation. You can save an ample amount of time using these presentation templates. No need to worry to prepare everything from scratch because Slidegeeks experts have already done a huge research and work for you. You need to download Employee Performance Management Kpi Dashboard Executing Successful Staff Performance Elements Pdf for your upcoming presentation. All the presentation templates are 100 percent editable and you can change the color and personalize the content accordingly. Download now. The following slide depicts the overview of staff performance management system to achieve goals and evaluate business growth. It includes key elements such as absenteeism rate, overtime hours, training costs, labor effectiveness etc.
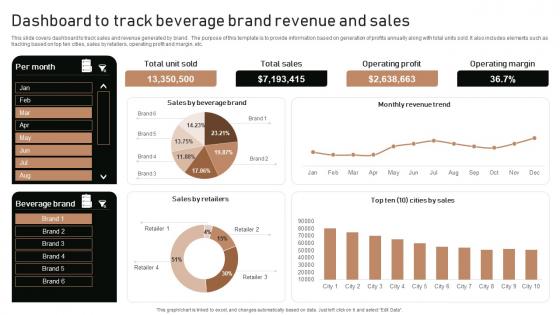
Execution Of Product Lifecycle Dashboard To Track Beverage Brand Revenue And Sales Ideas Pdf
This slide covers dashboard to track sales and revenue generated by brand . The purpose of this template is to provide information based on generation of profits annually along with total units sold. It also includes elements such as tracking based on top ten cities, sales by retailers, operating profit and margin, etc. From laying roadmaps to briefing everything in detail, our templates are perfect for you. You can set the stage with your presentation slides. All you have to do is download these easy-to-edit and customizable templates. Execution Of Product Lifecycle Dashboard To Track Beverage Brand Revenue And Sales Ideas Pdf will help you deliver an outstanding performance that everyone would remember and praise you for. Do download this presentation today. This slide covers dashboard to track sales and revenue generated by brand . The purpose of this template is to provide information based on generation of profits annually along with total units sold. It also includes elements such as tracking based on top ten cities, sales by retailers, operating profit and margin, etc.
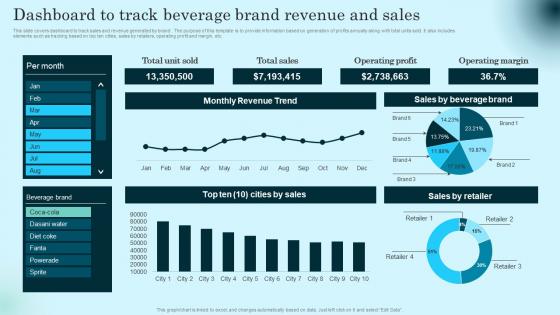
Dashboard To Track Beverage Brand Revenue Comprehensive Guide To Product Lifecycle Graphics Pdf
This slide covers dashboard to track sales and revenue generated by brand . The purpose of this template is to provide information based on generation of profits annually along with total units sold. It also includes elements such as tracking based on top ten cities, sales by retailers, operating profit and margin, etc. Present like a pro with Dashboard To Track Beverage Brand Revenue Comprehensive Guide To Product Lifecycle Graphics Pdf Create beautiful presentations together with your team, using our easy to use presentation slides. Share your ideas in real time and make changes on the fly by downloading our templates. So whether you are in the office, on the go, or in a remote location, you can stay in sync with your team and present your ideas with confidence. With Slidegeeks presentation got a whole lot easier. Grab these presentations today. This slide covers dashboard to track sales and revenue generated by brand . The purpose of this template is to provide information based on generation of profits annually along with total units sold. It also includes elements such as tracking based on top ten cities, sales by retailers, operating profit and margin, etc.
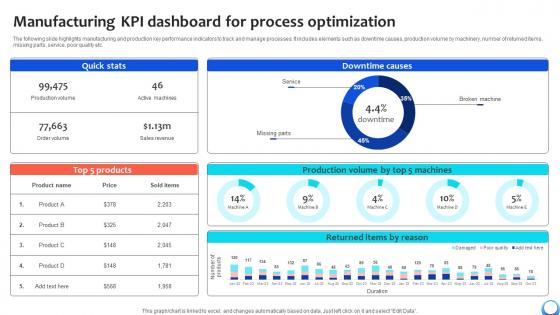
Manufacturing KPI Dashboard For Process Optimization Automating Production Process Strategy SS V
The following slide highlights manufacturing and production key performance indicators to track and manage processes. It includes elements such as downtime causes, production volume by machinery, number of returned items, missing parts, service, poor quality etc. Formulating a presentation can take up a lot of effort and time, so the content and message should always be the primary focus. The visuals of the PowerPoint can enhance the presenters message, so our Manufacturing KPI Dashboard For Process Optimization Automating Production Process Strategy SS V was created to help save time. Instead of worrying about the design, the presenter can concentrate on the message while our designers work on creating the ideal templates for whatever situation is needed. Slidegeeks has experts for everything from amazing designs to valuable content, we have put everything into Manufacturing KPI Dashboard For Process Optimization Automating Production Process Strategy SS V The following slide highlights manufacturing and production key performance indicators to track and manage processes. It includes elements such as downtime causes, production volume by machinery, number of returned items, missing parts, service, poor quality etc.
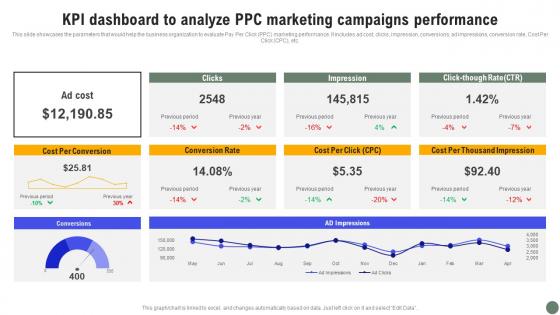
KPI Dashboard To Analyze PPC Exhaustive Guide Of Pay Per Click Advertising Initiatives Inspiration Pdf
This slide showcases the parameters that would help the business organization to evaluate Pay Per Click PPC marketing performance. It includes ad cost, clicks, impression, conversions, ad impressions, conversion rate, Cost Per Click CPC, etc. Formulating a presentation can take up a lot of effort and time, so the content and message should always be the primary focus. The visuals of the PowerPoint can enhance the presenters message, so our KPI Dashboard To Analyze PPC Exhaustive Guide Of Pay Per Click Advertising Initiatives Inspiration Pdf was created to help save time. Instead of worrying about the design, the presenter can concentrate on the message while our designers work on creating the ideal templates for whatever situation is needed. Slidegeeks has experts for everything from amazing designs to valuable content, we have put everything into KPI Dashboard To Analyze PPC Exhaustive Guide Of Pay Per Click Advertising Initiatives Inspiration Pdf This slide showcases the parameters that would help the business organization to evaluate Pay Per Click PPC marketing performance. It includes ad cost, clicks, impression, conversions, ad impressions, conversion rate, Cost Per Click CPC, etc.

KPI Dashboard Highlighting Digital Marketing Strategies Improve Enterprise Sales Pictures Pdf
The following slide showcases a comprehensive key performance indicator KPI dashboard which can be used to showcase the outcome of marketing campaign. The major metrics covered in the slide are brand mentions, customer lifetime value CLV, customer acquisition cost CAC, net promoter score NPS, etc. Boost your pitch with our creative KPI Dashboard Highlighting Digital Marketing Strategies Improve Enterprise Sales Pictures Pdf. Deliver an awe inspiring pitch that will mesmerize everyone. Using these presentation templates you will surely catch everyones attention. You can browse the ppts collection on our website. We have researchers who are experts at creating the right content for the templates. So you do not have to invest time in any additional work. Just grab the template now and use them. The following slide showcases a comprehensive key performance indicator KPI dashboard which can be used to showcase the outcome of marketing campaign. The major metrics covered in the slide are brand mentions, customer lifetime value CLV, customer acquisition cost CAC, net promoter score NPS, etc.
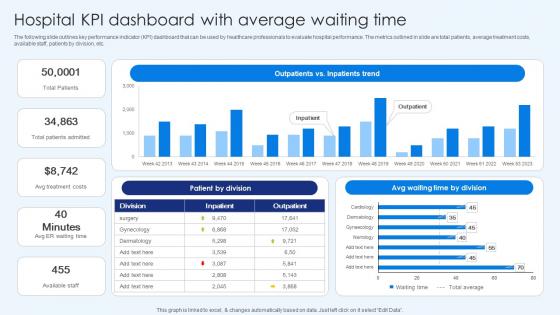
Hospital Kpi Dashboard With Average Waiting Time Healthcare Promotion Ideas Pdf
The following slide outlines key performance indicator KPI dashboard that can be used by healthcare professionals to evaluate hospital performance. The metrics outlined in slide are total patients, average treatment costs, available staff, patients by division, etc. Coming up with a presentation necessitates that the majority of the effort goes into the content and the message you intend to convey. The visuals of a PowerPoint presentation can only be effective if it supplements and supports the story that is being told. Keeping this in mind our experts created Hospital KPI Dashboard With Average Waiting Time Healthcare Promotion Ideas Pdf to reduce the time that goes into designing the presentation. This way, you can concentrate on the message while our designers take care of providing you with the right template for the situation. The following slide outlines key performance indicator KPI dashboard that can be used by healthcare professionals to evaluate hospital performance. The metrics outlined in slide are total patients, average treatment costs, available staff, patients by division, etc.
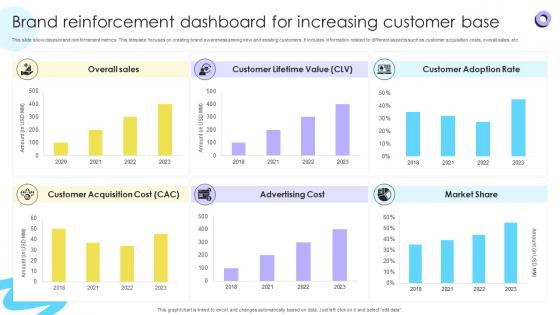
Brand Reinforcement Dashboard For Increasing Encouraging Repetitive Customer Purchase Ppt Presentation
This slide showcases brand reinforcement metrics. This template focuses on creating brand awareness among new and existing customers. It includes information related to different aspects such as customer acquisition costs, overall sales, etc. Slidegeeks is one of the best resources for PowerPoint templates. You can download easily and regulate Brand Reinforcement Dashboard For Increasing Encouraging Repetitive Customer Purchase Ppt Presentation for your personal presentations from our wonderful collection. A few clicks is all it takes to discover and get the most relevant and appropriate templates. Use our Templates to add a unique zing and appeal to your presentation and meetings. All the slides are easy to edit and you can use them even for advertisement purposes. This slide showcases brand reinforcement metrics. This template focuses on creating brand awareness among new and existing customers. It includes information related to different aspects such as customer acquisition costs, overall sales, etc.
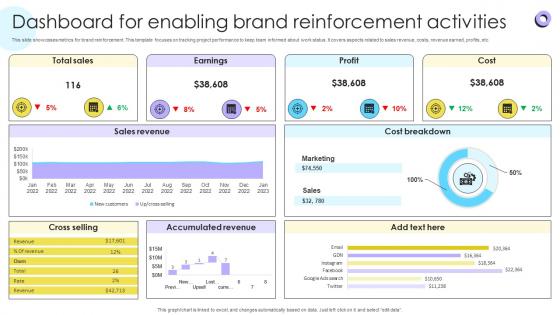
Dashboard For Enabling Brand Reinforcement Encouraging Repetitive Customer Purchase Ppt Slide
This slide showcases metrics for brand reinforcement. This template focuses on tracking project performance to keep team informed about work status. It covers aspects related to sales revenue, costs, revenue earned, profits, etc. From laying roadmaps to briefing everything in detail, our templates are perfect for you. You can set the stage with your presentation slides. All you have to do is download these easy-to-edit and customizable templates. Dashboard For Enabling Brand Reinforcement Encouraging Repetitive Customer Purchase Ppt Slide will help you deliver an outstanding performance that everyone would remember and praise you for. Do download this presentation today. This slide showcases metrics for brand reinforcement. This template focuses on tracking project performance to keep team informed about work status. It covers aspects related to sales revenue, costs, revenue earned, profits, etc.
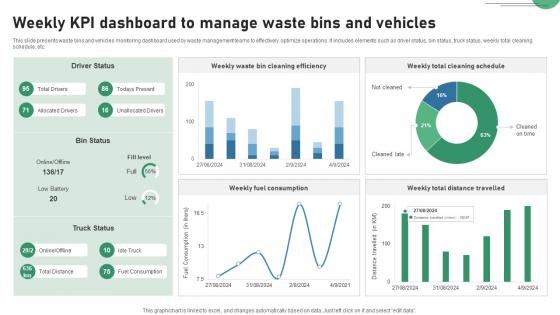
Weekly KPI Dashboard To Manage Waste Bins And Vehicles IOT Applications In Smart Waste IoT SS V
This slide presents waste bins and vehicles monitoring dashboard used by waste management teams to effectively optimize operations. It includes elements such as driver status, bin status, truck status, weekly total cleaning schedule, etc. Find highly impressive Weekly KPI Dashboard To Manage Waste Bins And Vehicles IOT Applications In Smart Waste IoT SS V on Slidegeeks to deliver a meaningful presentation. You can save an ample amount of time using these presentation templates. No need to worry to prepare everything from scratch because Slidegeeks experts have already done a huge research and work for you. You need to download Weekly KPI Dashboard To Manage Waste Bins And Vehicles IOT Applications In Smart Waste IoT SS V for your upcoming presentation. All the presentation templates are 100 percent editable and you can change the color and personalize the content accordingly. Download now. This slide presents waste bins and vehicles monitoring dashboard used by waste management teams to effectively optimize operations. It includes elements such as driver status, bin status, truck status, weekly total cleaning schedule, etc.
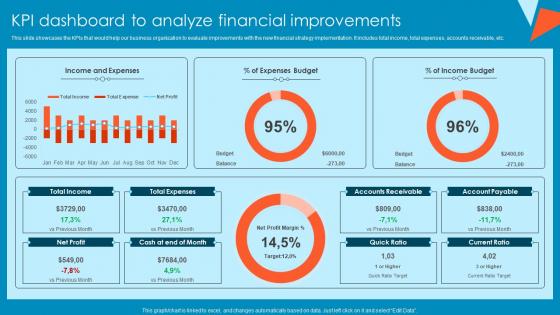
KPI Dashboard To Analyze Financial Improvements Tactical Financial Governance Brochure Pdf
This slide showcases the KPIs that would help our business organization to evaluate improvements with the new financial strategy implementation. It includes total income, total expenses, accounts receivable, etc.Boost your pitch with our creative KPI Dashboard To Analyze Financial Improvements Tactical Financial Governance Brochure Pdf. Deliver an awe-inspiring pitch that will mesmerize everyone. Using these presentation templates you will surely catch everyones attention. You can browse the ppts collection on our website. We have researchers who are experts at creating the right content for the templates. So you do not have to invest time in any additional work. Just grab the template now and use them. This slide showcases the KPIs that would help our business organization to evaluate improvements with the new financial strategy implementation. It includes total income, total expenses, accounts receivable, etc.
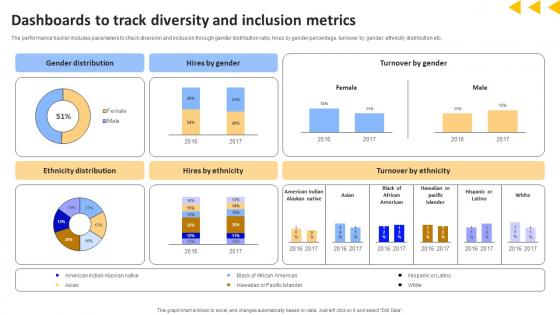
Workforce Productivity Improvement Dashboards To Track Diversity And Inclusion Metrics Structure Pdf
The performance tracker includes parameters to check diversion and inclusion through gender distribution ratio, hires by gender percentage, turnover by gender, ethnicity distribution etc. Coming up with a presentation necessitates that the majority of the effort goes into the content and the message you intend to convey. The visuals of a PowerPoint presentation can only be effective if it supplements and supports the story that is being told. Keeping this in mind our experts created Workforce Productivity Improvement Dashboards To Track Diversity And Inclusion Metrics Structure Pdf to reduce the time that goes into designing the presentation. This way, you can concentrate on the message while our designers take care of providing you with the right template for the situation. The performance tracker includes parameters to check diversion and inclusion through gender distribution ratio, hires by gender percentage, turnover by gender, ethnicity distribution etc.
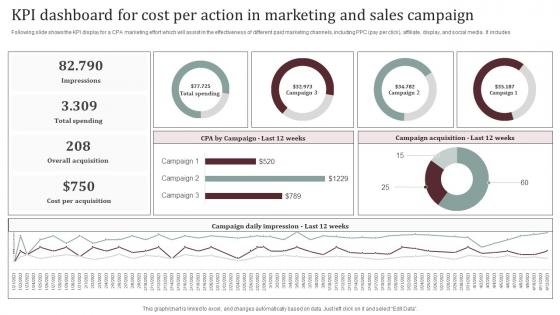
KPI Dashboard For Cost Per Action In Marketing And Sales Campaign Sample Pdf
Following slide shows the KPI display for a CPA marketing effort which will assist in the effectiveness of different paid marketing channels, including PPC pay per click, affiliate, display, and social media. It includes. Showcasing this set of slides titled KPI Dashboard For Cost Per Action In Marketing And Sales Campaign Sample Pdf. The topics addressed in these templates are Campaign Acquisition, Campaign Daily Impression. All the content presented in this PPT design is completely editable. Download it and make adjustments in color, background, font etc. as per your unique business setting. Following slide shows the KPI display for a CPA marketing effort which will assist in the effectiveness of different paid marketing channels, including PPC pay per click, affiliate, display, and social media. It includes.
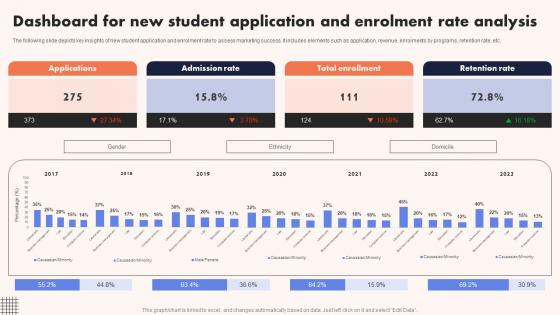
University Marketing Guide Dashboard For New Student Application And Enrolment Strategy SS V
The following slide depicts key insights of new student application and enrolment rate to assess marketing success. It includes elements such as application, revenue, enrolments by programs, retention rate, etc. Coming up with a presentation necessitates that the majority of the effort goes into the content and the message you intend to convey. The visuals of a PowerPoint presentation can only be effective if it supplements and supports the story that is being told. Keeping this in mind our experts created University Marketing Guide Dashboard For New Student Application And Enrolment Strategy SS V to reduce the time that goes into designing the presentation. This way, you can concentrate on the message while our designers take care of providing you with the right template for the situation. The following slide depicts key insights of new student application and enrolment rate to assess marketing success. It includes elements such as application, revenue, enrolments by programs, retention rate, etc.
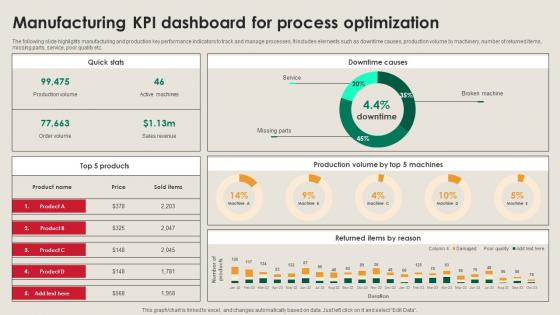
Manufacturing KPI Dashboard For Process Manufacturing Strategy Driving Industry 4 0
The following slide highlights manufacturing and production key performance indicators to track and manage processes. It includes elements such as downtime causes, production volume by machinery, number of returned items, missing parts, service, poor quality etc. Boost your pitch with our creative Manufacturing KPI Dashboard For Process Manufacturing Strategy Driving Industry 4 0. Deliver an awe-inspiring pitch that will mesmerize everyone. Using these presentation templates you will surely catch everyones attention. You can browse the ppts collection on our website. We have researchers who are experts at creating the right content for the templates. So you do not have to invest time in any additional work. Just grab the template now and use them. The following slide highlights manufacturing and production key performance indicators to track and manage processes. It includes elements such as downtime causes, production volume by machinery, number of returned items, missing parts, service, poor quality etc.


 Continue with Email

 Home
Home


