Data Analytics Icons

Pie Chart Circular 8 Stages Process Cleaning Service Business Plan PowerPoint Slides
We present our pie chart circular 8 stages process cleaning service business plan PowerPoint Slides.Use our Circle Charts PowerPoint Templates because You can Stir your ideas in the cauldron of our PowerPoint Templates and Slides. Cast a magic spell on your audience. Download and present our Signs PowerPoint Templates because It will Strengthen your hand with your thoughts. They have all the aces you need to win the day. Present our Shapes PowerPoint Templates because Our PowerPoint Templates and Slides will provide you a launch platform. Give a lift off to your ideas and send them into orbit. Download our Process and Flows PowerPoint Templates because Our PowerPoint Templates and Slides will provide weight to your words. They will bring out the depth of your thought process. Use our Business PowerPoint Templates because Our PowerPoint Templates and Slides will let Your superior ideas hit the target always and everytime.Use these PowerPoint slides for presentations relating to sign, overview, chart, market, statistics, sales, forecasting, slice, economy, display, corporate, business, concept, presentation, symbol, diagram, percentage, graphic, finance, data, bank, report, marketing, analyzing, trading, accounting, management, graph, icon, earnings, piece, circular, strategy, growth, company, control, competition, progress, account, profit, part, information, investment, banking, index, financial, results, portion, performance, exchange. The prominent colors used in the PowerPoint template are Green, Blue, White. Fall back on our Pie Chart Circular 8 Stages Process Cleaning Service Business Plan PowerPoint Slides at anytime. They are always ready and able to answer your call.
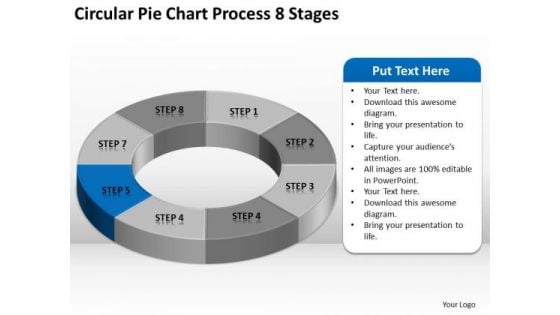
Circular Pie Chart Process 8 Stages Business Plan Executive Summary PowerPoint Templates
We present our circular pie chart process 8 stages business plan executive summary PowerPoint templates.Download and present our Marketing PowerPoint Templates because Our PowerPoint Templates and Slides will let you Hit the right notes. Watch your audience start singing to your tune. Use our Finance PowerPoint Templates because Our PowerPoint Templates and Slides are effectively colour coded to prioritise your plans They automatically highlight the sequence of events you desire. Download our Business PowerPoint Templates because you should Experience excellence with our PowerPoint Templates and Slides. They will take your breath away. Download our Circle Charts PowerPoint Templates because Our PowerPoint Templates and Slides ensures Effective communication. They help you put across your views with precision and clarity. Download our Shapes PowerPoint Templates because Our PowerPoint Templates and Slides are like the strings of a tennis racquet. Well strung to help you serve aces.Use these PowerPoint slides for presentations relating to Chart, Pie, Graph, Vector, 3d, Icon, Diagram, Progress, Business, Circular, Design, Information, Market, Opinion, Corporate, Sign, Symbol, Shadow, Percentage, Graphic, Finance, Data, Element, Drawing, Report, Marketing, Shape, Illustration, Earnings, Number, Strategy, Money, Dimensional, Survey, Growth, Colorful, Global, Account, Part, Investment, Statistic, Financial. The prominent colors used in the PowerPoint template are Blue, Gray, White. Steal the affection of your audience. Our Circular Pie Chart Process 8 Stages Business Plan Executive Summary PowerPoint Templates will abet you in the crime.
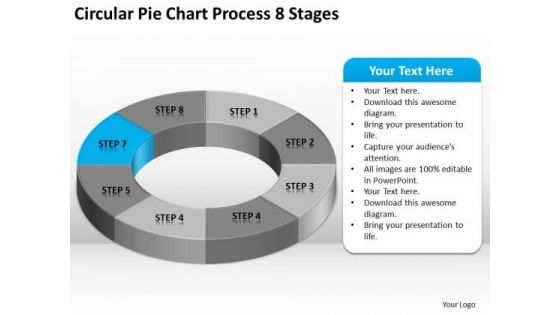
Circular Pie Chart Process 8 Stages Business Plan Template PowerPoint Templates
We present our circular pie chart process 8 stages business plan template PowerPoint templates.Present our Marketing PowerPoint Templates because It will Give impetus to the hopes of your colleagues. Our PowerPoint Templates and Slides will aid you in winning their trust. Use our Finance PowerPoint Templates because You can Connect the dots. Fan expectations as the whole picture emerges. Use our Business PowerPoint Templates because Watching this your Audience will Grab their eyeballs, they wont even blink. Use our Circle Charts PowerPoint Templates because Our PowerPoint Templates and Slides are created with admirable insight. Use them and give your group a sense of your logical mind. Download and present our Shapes PowerPoint Templates because Our PowerPoint Templates and Slides have the Brilliant backdrops. Guaranteed to illuminate the minds of your audience.Use these PowerPoint slides for presentations relating to Chart, Pie, Graph, Vector, 3d, Icon, Diagram, Progress, Business, Circular, Design, Information, Market, Opinion, Corporate, Sign, Symbol, Shadow, Percentage, Graphic, Finance, Data, Element, Drawing, Report, Marketing, Shape, Illustration, Earnings, Number, Strategy, Money, Dimensional, Survey, Growth, Colorful, Global, Account, Part, Investment, Statistic, Financial. The prominent colors used in the PowerPoint template are Blue light, Gray, White. Battle it out with our Circular Pie Chart Process 8 Stages Business Plan Template PowerPoint Templates. You will come out on top.
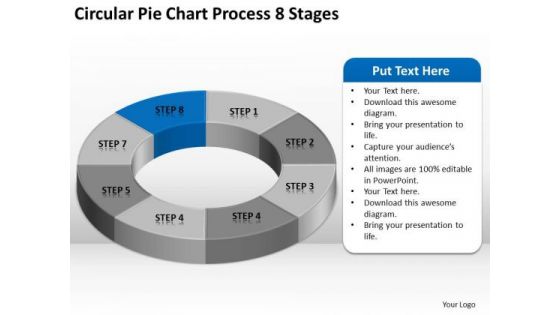
Circular Pie Chart Process 8 Stages Ppt Business Plan Financials PowerPoint Slides
We present our circular pie chart process 8 stages ppt business plan financials PowerPoint Slides.Present our Marketing PowerPoint Templates because Our PowerPoint Templates and Slides come in all colours, shades and hues. They help highlight every nuance of your views. Use our Finance PowerPoint Templates because you should Experience excellence with our PowerPoint Templates and Slides. They will take your breath away. Present our Business PowerPoint Templates because You can Create a matrix with our PowerPoint Templates and Slides. Feel the strength of your ideas click into place. Download our Circle Charts PowerPoint Templates because Our PowerPoint Templates and Slides team portray an attitude of elegance. Personify this quality by using them regularly. Present our Shapes PowerPoint Templates because It is Aesthetically crafted by artistic young minds. Our PowerPoint Templates and Slides are designed to display your dexterity.Use these PowerPoint slides for presentations relating to Chart, Pie, Graph, Vector, 3d, Icon, Diagram, Progress, Business, Circular, Design, Information, Market, Opinion, Corporate, Sign, Symbol, Shadow, Percentage, Graphic, Finance, Data, Element, Drawing, Report, Marketing, Shape, Illustration, Earnings, Number, Strategy, Money, Dimensional, Survey, Growth, Colorful, Global, Account, Part, Investment, Statistic, Financial. The prominent colors used in the PowerPoint template are Blue, Gray, White. Our Circular Pie Chart Process 8 Stages Ppt Business Plan Financials PowerPoint Slides compare to a classic dessert. Your audience will have their cake and eat it too.
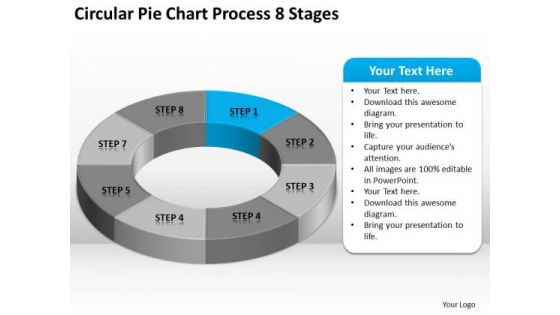
Circular Pie Chart Process 8 Stages Sample Nonprofit Business Plan PowerPoint Slides
We present our circular pie chart process 8 stages sample nonprofit business plan PowerPoint Slides.Download and present our Marketing PowerPoint Templates because You can Channelise the thoughts of your team with our PowerPoint Templates and Slides. Urge them to focus on the goals you have set. Use our Finance PowerPoint Templates because It can Bubble and burst with your ideas. Use our Business PowerPoint Templates because Our PowerPoint Templates and Slides will let you Hit the target. Go the full distance with ease and elan. Download and present our Circle Charts PowerPoint Templates because Our PowerPoint Templates and Slides will let your words and thoughts hit bullseye everytime. Use our Shapes PowerPoint Templates because Our PowerPoint Templates and Slides are focused like a searchlight beam. They highlight your ideas for your target audience.Use these PowerPoint slides for presentations relating to Chart, Pie, Graph, Vector, 3d, Icon, Diagram, Progress, Business, Circular, Design, Information, Market, Opinion, Corporate, Sign, Symbol, Shadow, Percentage, Graphic, Finance, Data, Element, Drawing, Report, Marketing, Shape, Illustration, Earnings, Number, Strategy, Money, Dimensional, Survey, Growth, Colorful, Global, Account, Part, Investment, Statistic, Financial. The prominent colors used in the PowerPoint template are Blue light, Gray, White. Give an exhaustive account with our Circular Pie Chart Process 8 Stages Sample Nonprofit Business Plan PowerPoint Slides. Your thoughts will illuminate every little detail.
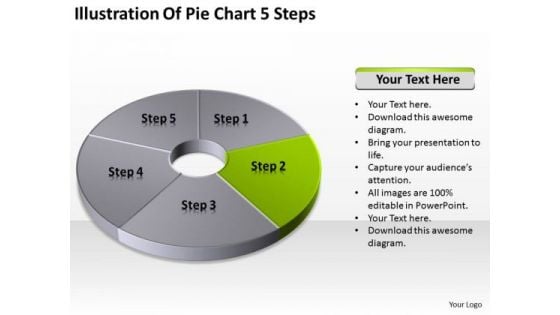
Illustration Of Pie Chart 5 Step Business Plan Steps PowerPoint Slides
We present our illustration of pie chart 5 step business plan steps PowerPoint Slides.Download our Circle Charts PowerPoint Templates because You have a driving passion to excel in your field. Our PowerPoint Templates and Slides will prove ideal vehicles for your ideas. Use our Shapes PowerPoint Templates because our PowerPoint Templates and Slides are the string of your bow. Fire of your ideas and conquer the podium. Use our Success PowerPoint Templates because Our PowerPoint Templates and Slides are like the strings of a tennis racquet. Well strung to help you serve aces. Download and present our Business PowerPoint Templates because Our PowerPoint Templates and Slides will effectively help you save your valuable time. They are readymade to fit into any presentation structure. Present our Process and Flows PowerPoint Templates because Our PowerPoint Templates and Slides are Clear and concise. Use them and dispel any doubts your team may have.Use these PowerPoint slides for presentations relating to pie, chart, market, statistics, sales, slice, economy, display, corporate, business, concept, render, success, presentation, diagram, percentage, graphic, finance, data, bank, report, marketing, accounting, management, graph, illustration, icon, piece, strategy, money, growth, company, control, competition, progress, account, sheet, profit, part, information, investment, improvement, banking, index, financial, reflect, results, performance, exchange. The prominent colors used in the PowerPoint template are Green, Gray, Black. Our Illustration Of Pie Chart 5 Step Business Plan Steps PowerPoint Slides are empowering agents. Your thoughts will create the correct chemistry.
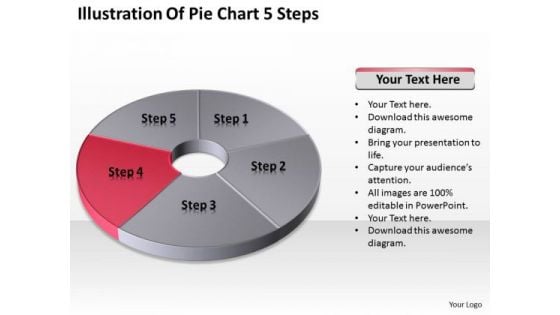
Illustration Of Pie Chart 5 Step Ppt Business Plan Sample PowerPoint Templates
We present our illustration of pie chart 5 step ppt business plan sample PowerPoint templates.Use our Circle Charts PowerPoint Templates because Our PowerPoint Templates and Slides will let you Clearly mark the path for others to follow. Download and present our Shapes PowerPoint Templates because They will Put your wonderful verbal artistry on display. Our PowerPoint Templates and Slides will provide you the necessary glam and glitter. Use our Success PowerPoint Templates because It will get your audience in sync. Present our Business PowerPoint Templates because our PowerPoint Templates and Slides will give your ideas the shape. Download our Process and Flows PowerPoint Templates because These PowerPoint Templates and Slides will give the updraft to your ideas. See them soar to great heights with ease.Use these PowerPoint slides for presentations relating to pie, chart, market, statistics, sales, slice, economy, display, corporate, business, concept, render, success, presentation, diagram, percentage, graphic, finance, data, bank, report, marketing, accounting, management, graph, illustration, icon, piece, strategy, money, growth, company, control, competition, progress, account, sheet, profit, part, information, investment, improvement, banking, index, financial, reflect, results, performance, exchange. The prominent colors used in the PowerPoint template are Red, Gray, Black. Our Illustration Of Pie Chart 5 Step Ppt Business Plan Sample PowerPoint Templates are driven by excellence. They automatically attract the exceptional.
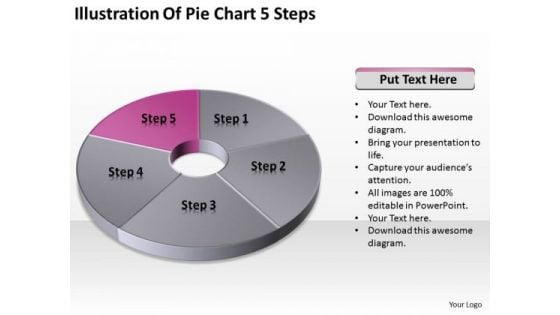
Illustration Of Pie Chart 5 Step Ppt Samples Business Plan PowerPoint Templates
We present our illustration of pie chart 5 step ppt samples business plan PowerPoint templates.Download our Circle Charts PowerPoint Templates because Our PowerPoint Templates and Slides are designed to help you succeed. They have all the ingredients you need. Present our Shapes PowerPoint Templates because You can Channelise the thoughts of your team with our PowerPoint Templates and Slides. Urge them to focus on the goals you have set. Use our Success PowerPoint Templates because Our PowerPoint Templates and Slides will let your ideas bloom. Create a bed of roses for your audience. Use our Business PowerPoint Templates because It will let you Set new benchmarks with our PowerPoint Templates and Slides. They will keep your prospects well above par. Download our Process and Flows PowerPoint Templates because Our PowerPoint Templates and Slides will let Your superior ideas hit the target always and everytime.Use these PowerPoint slides for presentations relating to pie, chart, market, statistics, sales, slice, economy, display, corporate, business, concept, render, success, presentation, diagram, percentage, graphic, finance, data, bank, report, marketing, accounting, management, graph, illustration, icon, piece, strategy, money, growth, company, control, competition, progress, account, sheet, profit, part, information, investment, improvement, banking, index, financial, reflect, results, performance, exchange. The prominent colors used in the PowerPoint template are Pink, Gray, Black. There is one thing our Illustration Of Pie Chart 5 Step Ppt Samples Business Plan PowerPoint Templates cannot do. They cannot be drab and dreary.
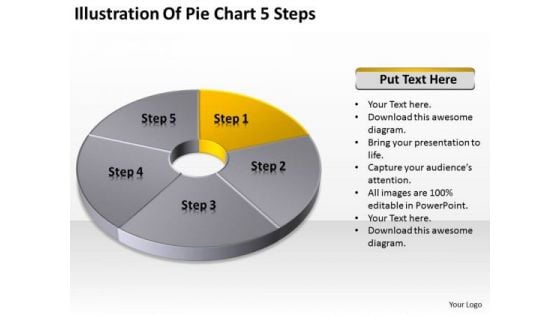
Illustration Of Pie Chart 5 Step Simple Business Plan PowerPoint Templates
We present our illustration of pie chart 5 step simple business plan PowerPoint templates.Use our Circle Charts PowerPoint Templates because Our PowerPoint Templates and Slides help you pinpoint your timelines. Highlight the reasons for your deadlines with their use. Download and present our Shapes PowerPoint Templates because Our PowerPoint Templates and Slides are topically designed to provide an attractive backdrop to any subject. Use our Success PowerPoint Templates because They will Put your wonderful verbal artistry on display. Our PowerPoint Templates and Slides will provide you the necessary glam and glitter. Use our Business PowerPoint Templates because You aspire to touch the sky with glory. Let our PowerPoint Templates and Slides provide the fuel for your ascent. Download and present our Process and Flows PowerPoint Templates because Our PowerPoint Templates and Slides come in all colours, shades and hues. They help highlight every nuance of your views.Use these PowerPoint slides for presentations relating to pie, chart, market, statistics, sales, slice, economy, display, corporate, business, concept, render, success, presentation, diagram, percentage, graphic, finance, data, bank, report, marketing, accounting, management, graph, illustration, icon, piece, strategy, money, growth, company, control, competition, progress, account, sheet, profit, part, information, investment, improvement, banking, index, financial, reflect, results, performance, exchange. The prominent colors used in the PowerPoint template are Yellow, Gray, Black. Find favour with the audience for your ideas. Our Illustration Of Pie Chart 5 Step Simple Business Plan PowerPoint Templates will extract approval.
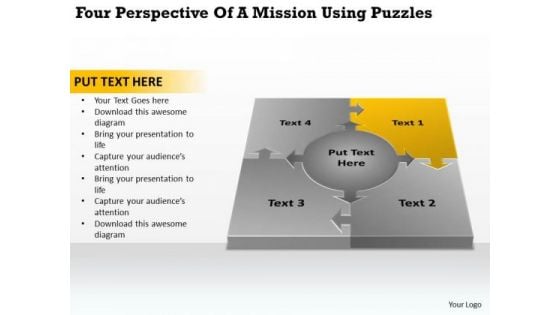
Perspective Of A Mission Using Puzzles Business Plans Examples Free PowerPoint Templates
We present our perspective of a mission using puzzles business plans examples free PowerPoint templates.Download our Process and Flows PowerPoint Templates because Our PowerPoint Templates and Slides help you pinpoint your timelines. Highlight the reasons for your deadlines with their use. Present our Arrows PowerPoint Templates because Your audience will believe you are the cats whiskers. Download our Business PowerPoint Templates because Our PowerPoint Templates and Slides will definately Enhance the stature of your presentation. Adorn the beauty of your thoughts with their colourful backgrounds. Use our Marketing PowerPoint Templates because You can Be the star of the show with our PowerPoint Templates and Slides. Rock the stage with your ideas. Download our Shapes PowerPoint Templates because It can be used to Set your controls for the heart of the sun. Our PowerPoint Templates and Slides will be the propellant to get you there.Use these PowerPoint slides for presentations relating to Map, market, network, percent, bar, business, load, arrow, sign, infochart, presentation, symbol, internet, elements, data, clean,report, graphics, shape, label, demographics, graph, modern, box, illustration, icon, connection, chart, sale, number, youth, visualization, collection, web,design, growth, set, poster, info, information, board, statistic, button, arrows. The prominent colors used in the PowerPoint template are Yellow, White, Gray. The people behind our Perspective Of A Mission Using Puzzles Business Plans Examples Free PowerPoint Templates are an erudite lot. They are known to be very well read.
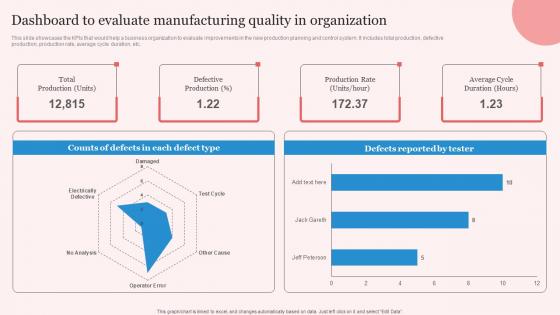
Dashboard To Enhancing Manufacturing Operation Effectiveness Professional Pdf
This slide showcases the KPIs that would help a business organization to evaluate improvements in the new production planning and control system. It includes total production, defective production, production rate, average cycle duration, etc. Do you have to make sure that everyone on your team knows about any specific topic I yes, then you should give Dashboard To Enhancing Manufacturing Operation Effectiveness Professional Pdf a try. Our experts have put a lot of knowledge and effort into creating this impeccable Dashboard To Enhancing Manufacturing Operation Effectiveness Professional Pdf. You can use this template for your upcoming presentations, as the slides are perfect to represent even the tiniest detail. You can download these templates from the Slidegeeks website and these are easy to edit. So grab these today. This slide showcases the KPIs that would help a business organization to evaluate improvements in the new production planning and control system. It includes total production, defective production, production rate, average cycle duration, etc.
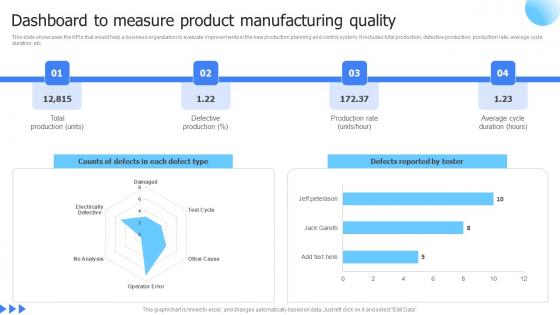
Leveraging Advanced Manufacturing Dashboard To Measure Product Professional Pdf
This slide showcases the KPIs that would help a business organization to evaluate improvements in the new production planning and control system. It includes total production, defective production, production rate, average cycle duration, etc. Get a simple yet stunning designed Leveraging Advanced Manufacturing Dashboard To Measure Product Professional Pdf It is the best one to establish the tone in your meetings. It is an excellent way to make your presentations highly effective. So, download this PPT today from Slidegeeks and see the positive impacts. Our easy-to-edit Leveraging Advanced Manufacturing Dashboard To Measure Product Professional Pdf can be your go-to option for all upcoming conferences and meetings. So, what are you waiting for Grab this template today. This slide showcases the KPIs that would help a business organization to evaluate improvements in the new production planning and control system. It includes total production, defective production, production rate, average cycle duration, etc.
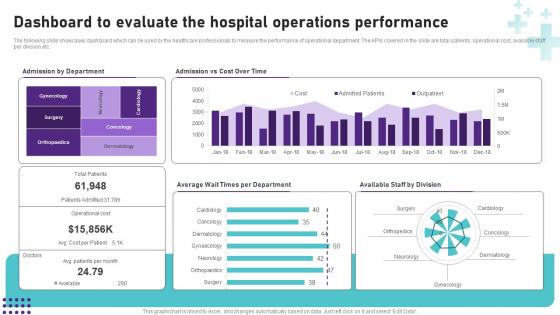
Dashboard To Evaluate The Hospital Operational Areas Healthcare Professional PDF
Present like a pro with Dashboard To Evaluate The Hospital Operational Areas Healthcare Professional PDF Create beautiful presentations together with your team, using our easy-to-use presentation slides. Share your ideas in real-time and make changes on the fly by downloading our templates. So whether you are in the office, on the go, or in a remote location, you can stay in sync with your team and present your ideas with confidence. With Slidegeeks presentation got a whole lot easier. Grab these presentations today. The following slide showcases dashboard which can be used by the healthcare professionals to measure the performance of operational department. The KPIs covered in the slide are total patients, operational cost, available staff per division etc.
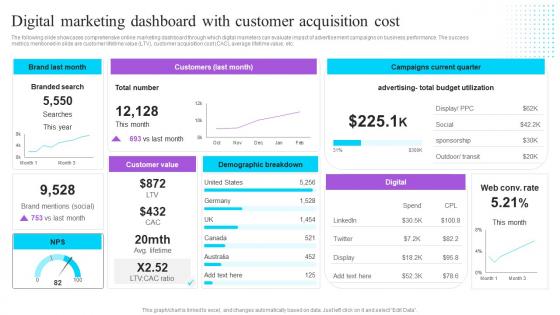
Digital Marketing Dashboard With Customer Effective GTM Techniques Clipart PDF
The following slide showcases comprehensive online marketing dashboard through which digital marketers can evaluate impact of advertisement campaigns on business performance. The success metrics mentioned in slide are customer lifetime value LTV, customer acquisition cost CAC, average lifetime value, etc. Slidegeeks is here to make your presentations a breeze with Digital Marketing Dashboard With Customer Effective GTM Techniques Clipart PDF With our easy-to-use and customizable templates, you can focus on delivering your ideas rather than worrying about formatting. With a variety of designs to choose from, you are sure to find one that suits your needs. And with animations and unique photos, illustrations, and fonts, you can make your presentation pop. So whether you are giving a sales pitch or presenting to the board, make sure to check out Slidegeeks first The following slide showcases comprehensive online marketing dashboard through which digital marketers can evaluate impact of advertisement campaigns on business performance. The success metrics mentioned in slide are customer lifetime value LTV, customer acquisition cost CAC, average lifetime value, etc.
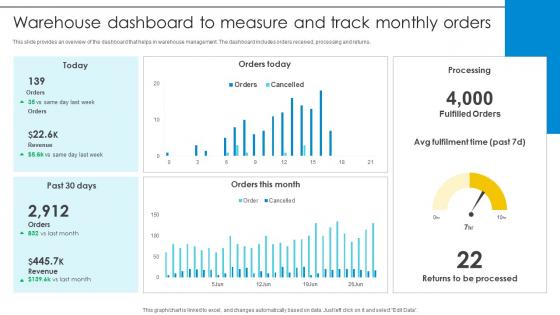
Warehouse Dashboard To Measure And Track Monthly Orders Optimizing Inventory Management IoT SS V
This slide provides an overview of the dashboard that helps in warehouse management. The dashboard includes orders received, processing and returns. Want to ace your presentation in front of a live audience Our Warehouse Dashboard To Measure And Track Monthly Orders Optimizing Inventory Management IoT SS V can help you do that by engaging all the users towards you. Slidegeeks experts have put their efforts and expertise into creating these impeccable powerpoint presentations so that you can communicate your ideas clearly. Moreover, all the templates are customizable, and easy-to-edit and downloadable. Use these for both personal and commercial use. This slide provides an overview of the dashboard that helps in warehouse management. The dashboard includes orders received, processing and returns.
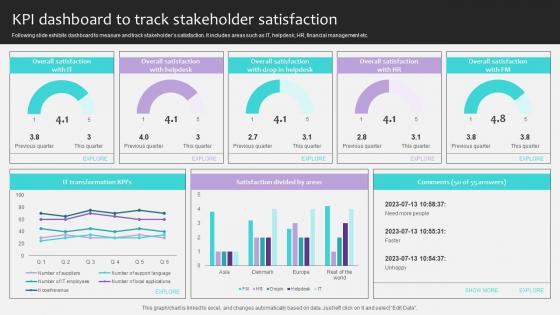
Project Stakeholders Management KPI Dashboard To Track Stakeholder Satisfaction Ppt Powerpoint
Following slide exhibits dashboard to measure and track stakeholders satisfaction. It includes areas such as IT, helpdesk, HR, financial management etc. Presenting this PowerPoint presentation, titled Project Stakeholders Management KPI Dashboard To Track Stakeholder Satisfaction Ppt Powerpoint, with topics curated by our researchers after extensive research. This editable presentation is available for immediate download and provides attractive features when used. Download now and captivate your audience. Presenting this Project Stakeholders Management KPI Dashboard To Track Stakeholder Satisfaction Ppt Powerpoint. Our researchers have carefully researched and created these slides with all aspects taken into consideration. This is a completely customizable Project Stakeholders Management KPI Dashboard To Track Stakeholder Satisfaction Ppt Powerpoint that is available for immediate downloading. Download now and make an impact on your audience. Highlight the attractive features available with our PPTs. Following slide exhibits dashboard to measure and track stakeholders satisfaction. It includes areas such as IT, helpdesk, HR, financial management etc.
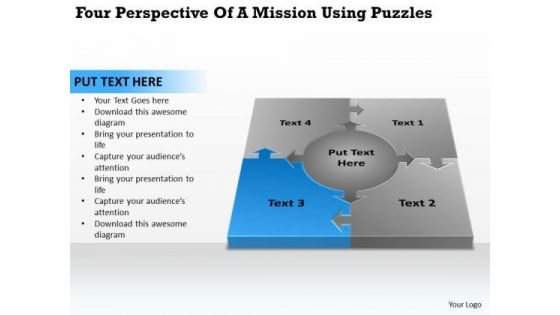
Of A Mission Using Puzzles Business Plan For Non Profit Organization PowerPoint Slides
We present our of a mission using puzzles business plan for non profit organization PowerPoint Slides.Download and present our Process and Flows PowerPoint Templates because Our PowerPoint Templates and Slides will let you meet your Deadlines. Use our Flow Charts PowerPoint Templates because It can Leverage your style with our PowerPoint Templates and Slides. Charm your audience with your ability. Download our Business PowerPoint Templates because Our PowerPoint Templates and Slides will let you Illuminate the road ahead to Pinpoint the important landmarks along the way. Present our Success PowerPoint Templates because Your ideas provide food for thought. Our PowerPoint Templates and Slides will help you create a dish to tickle the most discerning palate. Download and present our Marketing PowerPoint Templates because Our PowerPoint Templates and Slides will embellish your thoughts. See them provide the desired motivation to your team.Use these PowerPoint slides for presentations relating to Map, market, network, percent, bar, business, load, arrow, sign, infochart, presentation, symbol, internet, elements, data, clean,report, graphics, shape, label, demographics, graph, modern, box, illustration, icon, connection, chart, sale, number, youth, visualization, collection, web,design, growth, set, poster, info, information, board, statistic, button, arrows. The prominent colors used in the PowerPoint template are Blue, White, Gray. Do not let oppurtunity go abegging. Seize the moment with our Of A Mission Using Puzzles Business Plan For Non Profit Organization PowerPoint Slides.
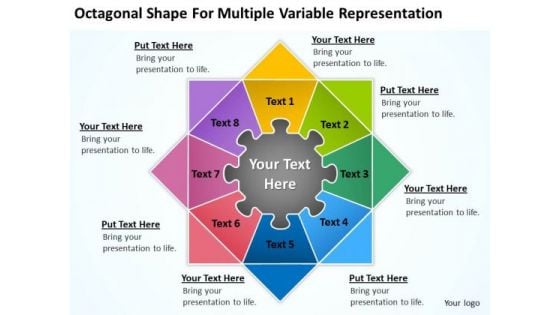
Shape For Multiple Variable Representation Ppt Business Plan Outlines PowerPoint Slides
We present our shape for multiple variable representation ppt business plan outlines PowerPoint Slides.Download and present our Flow Charts PowerPoint Templates because Our PowerPoint Templates and Slides has conjured up a web of all you need with the help of our great team. Use them to string together your glistening ideas. Use our Arrows PowerPoint Templates because Our PowerPoint Templates and Slides will Embellish your thoughts. They will help you illustrate the brilliance of your ideas. Use our Process and Flows PowerPoint Templates because Our PowerPoint Templates and Slides will steer your racing mind. Hit the right buttons and spur on your audience. Download our Marketing PowerPoint Templates because you should once Tap the ingenuity of our PowerPoint Templates and Slides. They are programmed to succeed. Download our Shapes PowerPoint Templates because It can Conjure up grand ideas with our magical PowerPoint Templates and Slides. Leave everyone awestruck by the end of your presentation.Use these PowerPoint slides for presentations relating to Graphics, info, modern, chart, design, percent, document, phonographic, map, earth, bar, business, load, sign, infochart,presentation, symbol, elements, ecology, data, report, shape, label, demographics, graph, illustration, icon, connection, sale, number,visualization, collection, web, growth, set, information, board, statistic, button. The prominent colors used in the PowerPoint template are Yellow, Blue, Red. Award yourself with our Shape For Multiple Variable Representation Ppt Business Plan Outlines PowerPoint Slides. Your thoughts deserve the distinction.
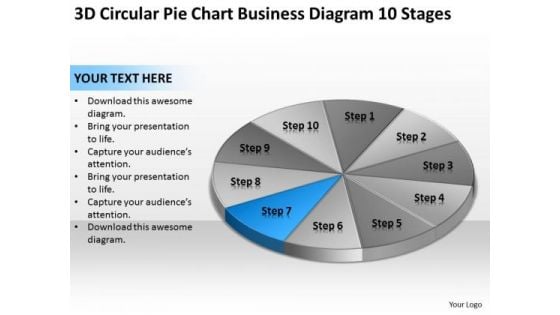
3d Circular Pie Chart Business Diagram 10 Stages Plan PowerPoint Templates
We present our 3d circular pie chart business diagram 10 stages plan PowerPoint templates.Download our Process and Flows PowerPoint Templates because Our PowerPoint Templates and Slides will Activate the energies of your audience. Get their creative juices flowing with your words. Download our Flow Charts PowerPoint Templates because Our PowerPoint Templates and Slides will give good value for money. They also have respect for the value of your time. Download our Marketing PowerPoint Templates because Our PowerPoint Templates and Slides will let your team Walk through your plans. See their energy levels rise as you show them the way. Download our Business PowerPoint Templates because Our PowerPoint Templates and Slides will fulfill your every need. Use them and effectively satisfy the desires of your audience. Download our Shapes PowerPoint Templates because You aspire to touch the sky with glory. Let our PowerPoint Templates and Slides provide the fuel for your ascent.Use these PowerPoint slides for presentations relating to Market, slice,business, concept, sign, render, symbol, shadow, diagram, commercial, percentage, occupation, graphic, finance, data,dollar, bank, report, marketing, trading, tones, price, abstract, graph, icon, economic, piece, pie, chart, number, money, currency, making, representative,background, investment, improvement, banking, economical, reflect, results. The prominent colors used in the PowerPoint template are Blue, Gray, White. Your customer is the center of it all. Our 3d Circular Pie Chart Business Diagram 10 Stages Plan PowerPoint Templates will concentrate on him.
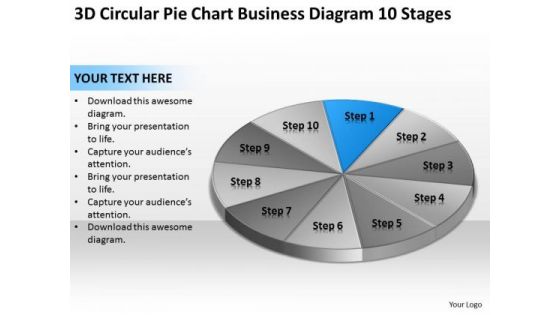
3d Circular Pie Chart Business Diagram 10 Stages Ppt Plan Development PowerPoint Slides
We present our 3d circular pie chart business diagram 10 stages ppt plan development PowerPoint Slides.Use our Process and Flows PowerPoint Templates because Our PowerPoint Templates and Slides will let you Hit the target. Go the full distance with ease and elan. Download our Business PowerPoint Templates because Our PowerPoint Templates and Slides will Embellish your thoughts. They will help you illustrate the brilliance of your ideas. Download and present our Flow Charts PowerPoint Templates because Our PowerPoint Templates and Slides are designed to help you succeed. They have all the ingredients you need. Present our Marketing PowerPoint Templates because It can Bubble and burst with your ideas. Download and present our Shapes PowerPoint Templates because You have a driving passion to excel in your field. Our PowerPoint Templates and Slides will prove ideal vehicles for your ideas.Use these PowerPoint slides for presentations relating to Market, slice,business, concept, sign, render, symbol, shadow, diagram, commercial, percentage, occupation, graphic, finance, data,dollar, bank, report, marketing, trading, tones, price, abstract, graph, icon, economic, piece, pie, chart, number, money, currency, making, representative,background, investment, improvement, banking, economical, reflect, results. The prominent colors used in the PowerPoint template are Blue, Black, White. Reengineer your vision with our 3d Circular Pie Chart Business Diagram 10 Stages Ppt Plan Development PowerPoint Slides. Download without worries with our money back guaranteee.
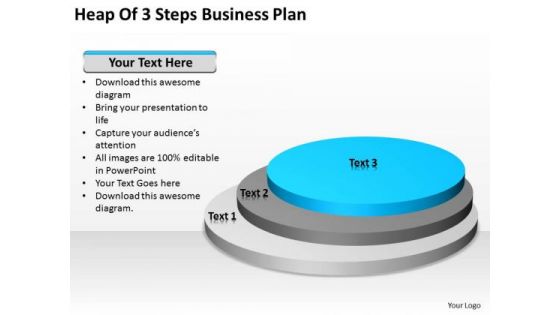
Heap Of 3 Steps Business Plan Ppt Help With PowerPoint Templates
We present our heap of 3 steps business plan ppt help with PowerPoint templates.Download our Flow Charts PowerPoint Templates because You can Create a matrix with our PowerPoint Templates and Slides. Feel the strength of your ideas click into place. Use our Process and Flows PowerPoint Templates because you can Add colour to your speech with our PowerPoint Templates and Slides. Your presentation will leave your audience speechless. Download and present our Circle Charts PowerPoint Templates because You can Double your output with our PowerPoint Templates and Slides. They make beating deadlines a piece of cake. Download our Shapes PowerPoint Templates because They will Put your wonderful verbal artistry on display. Our PowerPoint Templates and Slides will provide you the necessary glam and glitter. Download and present our Business PowerPoint Templates because Our PowerPoint Templates and Slides help you pinpoint your timelines. Highlight the reasons for your deadlines with their use.Use these PowerPoint slides for presentations relating to Chart, round, growth, pyramid, market, isolated, demographic, infochart, document, isometric, piechart, perspective, business, blank, concept, vector, sign,diagramchart, visual, presentation, glossy, symbol, template, diagram, circle, ring, graphic, finance, data, stock, element, report, abstract, graph, illustration, icon,economic, shiny, rating, web, infographic, design, text, organization, information, background, office, statistic, financial. The prominent colors used in the PowerPoint template are Blue light, Gray, Black. Synthesize presentations with our Heap Of 3 Steps Business Plan Ppt Help With PowerPoint Templates. Download without worries with our money back guaranteee.

KPI Dashboard To Measure Brand Marketing Performance Ultimate Guide Implementing Demonstration Pdf
Mentioned slide illustrates KPI dashboard that can be used by organizations to track the performance of their brand performance. Brand, advertising and purchase are the metrics covered in the dashboard. Presenting this PowerPoint presentation, titled KPI Dashboard To Measure Brand Marketing Performance Ultimate Guide Implementing Demonstration Pdf with topics curated by our researchers after extensive research. This editable presentation is available for immediate download and provides attractive features when used. Download now and captivate your audience. Presenting this KPI Dashboard To Measure Brand Marketing Performance Ultimate Guide Implementing Demonstration Pdf Our researchers have carefully researched and created these slides with all aspects taken into consideration. This is a completely customizable KPI Dashboard To Measure Brand Marketing Performance Ultimate Guide Implementing Demonstration Pdf that is available for immediate downloading. Download now and make an impact on your audience. Highlight the attractive features available with our PPTs. Mentioned slide illustrates KPI dashboard that can be used by organizations to track the performance of their brand performance. Brand, advertising and purchase are the metrics covered in the dashboard.
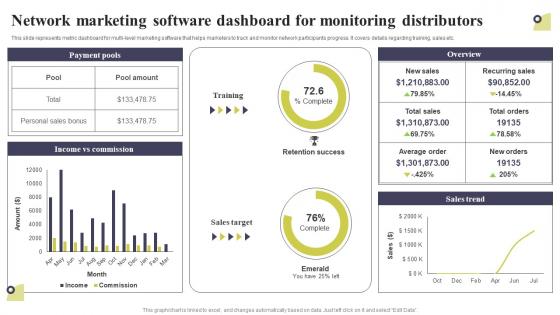
Network Marketing Software Dashboard For Monitoring Distributors Multi Level Marketing Designs Pdf
This slide represents metric dashboard for multi-level marketing software that helps marketers to track and monitor network participants progress. It covers details regarding training, sales etc. Find a pre-designed and impeccable Network Marketing Software Dashboard For Monitoring Distributors Multi Level Marketing Designs Pdf The templates can ace your presentation without additional effort. You can download these easy-to-edit presentation templates to make your presentation stand out from others. So, what are you waiting for Download the template from Slidegeeks today and give a unique touch to your presentation. This slide represents metric dashboard for multi-level marketing software that helps marketers to track and monitor network participants progress. It covers details regarding training, sales etc.
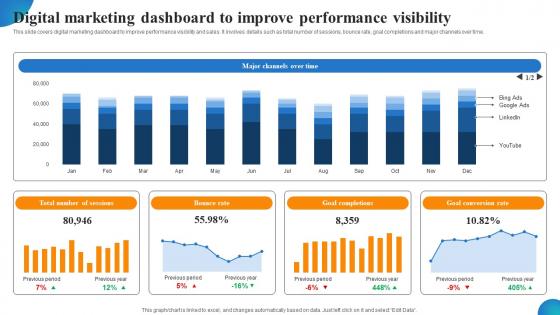
Digital Marketing Dashboard To Improve Performance Visibility MDSS For Enhanced Brochure Pdf
This slide covers digital marketing dashboard to improve performance visibility and sales. It involves details such as total number of sessions, bounce rate, goal completions and major channels over time. There are so many reasons you need a Digital Marketing Dashboard To Improve Performance Visibility MDSS For Enhanced Brochure Pdf The first reason is you can not spend time making everything from scratch, Thus, Slidegeeks has made presentation templates for you too. You can easily download these templates from our website easily. This slide covers digital marketing dashboard to improve performance visibility and sales. It involves details such as total number of sessions, bounce rate, goal completions and major channels over time.
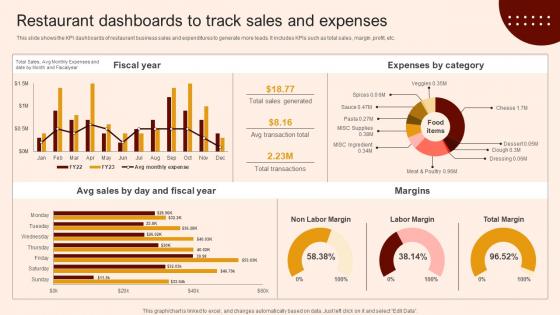
Create A Restaurant Marketing Restaurant Dashboards To Track Sales And Expenses
This slide shows the KPI dashboards of restaurant business sales and expenditures to generate more leads. It includes KPIs such as total sales, margin ,profit, etc. There are so many reasons you need a Create A Restaurant Marketing Restaurant Dashboards To Track Sales And Expenses. The first reason is you can not spend time making everything from scratch, Thus, Slidegeeks has made presentation templates for you too. You can easily download these templates from our website easily. This slide shows the KPI dashboards of restaurant business sales and expenditures to generate more leads. It includes KPIs such as total sales, margin ,profit, etc.
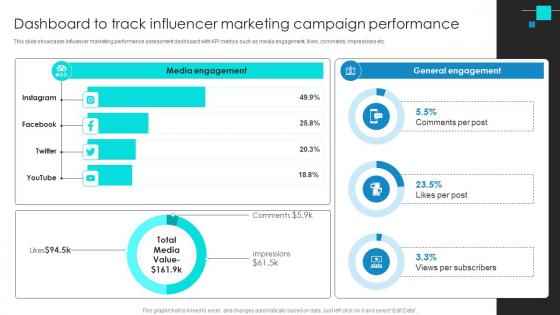
Project Benchmarking Process Dashboard To Track Influencer Marketing Campaign CRP DK SS V
This slide showcases influencer marketing performance assessment dashboard with KPI metrics such as media engagement, likes, comments, impressions etc. If your project calls for a presentation, then Slidegeeks is your go-to partner because we have professionally designed, easy-to-edit templates that are perfect for any presentation. After downloading, you can easily edit Project Benchmarking Process Dashboard To Track Influencer Marketing Campaign CRP DK SS V and make the changes accordingly. You can rearrange slides or fill them with different images. Check out all the handy templates This slide showcases influencer marketing performance assessment dashboard with KPI metrics such as media engagement, likes, comments, impressions etc.
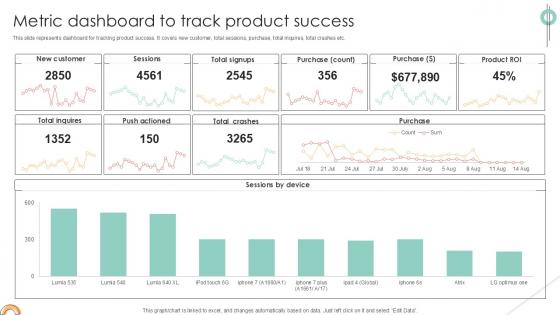
Metric Dashboard To Track Implementing Product Diversification PPT Sample Strategy SS V
This slide represents dashboard for tracking product success. It covers new customer, total sessions, purchase, total inquires, total crashes etc. The best PPT templates are a great way to save time, energy, and resources. Slidegeeks have 100 percent editable powerpoint slides making them incredibly versatile. With these quality presentation templates, you can create a captivating and memorable presentation by combining visually appealing slides and effectively communicating your message. Download Metric Dashboard To Track Implementing Product Diversification PPT Sample Strategy SS V from Slidegeeks and deliver a wonderful presentation. This slide represents dashboard for tracking product success. It covers new customer, total sessions, purchase, total inquires, total crashes etc.
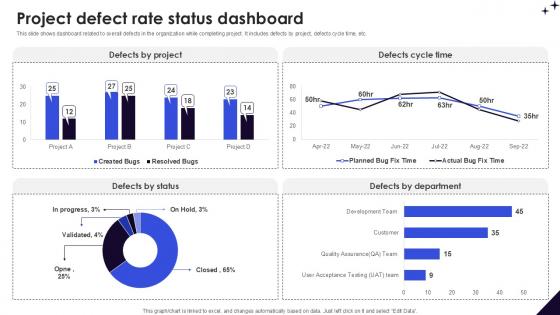
Project Defect Rate Status Dashboard DMAIC Methodology To Maintain PPT Slide
This slide shows dashboard related to overall defects in the organization while completing project. It includes defects by project, defects cycle time, etc. The best PPT templates are a great way to save time, energy, and resources. Slidegeeks have 100 percent editable powerpoint slides making them incredibly versatile. With these quality presentation templates, you can create a captivating and memorable presentation by combining visually appealing slides and effectively communicating your message. Download Project Defect Rate Status Dashboard DMAIC Methodology To Maintain PPT Slide from Slidegeeks and deliver a wonderful presentation. This slide shows dashboard related to overall defects in the organization while completing project. It includes defects by project, defects cycle time, etc.

Monthly Project Status Report Dashboard To Monitor Work Progress PPT Template SS
The slide shows a dashboard for project progress management. It includes gross margin, billing utilization, invoiced, active users, scope delivered, quality, risks, etc. There are so many reasons you need a Monthly Project Status Report Dashboard To Monitor Work Progress PPT Template SS. The first reason is you can not spend time making everything from scratch, Thus, Slidegeeks has made presentation templates for you too. You can easily download these templates from our website easily. The slide shows a dashboard for project progress management. It includes gross margin, billing utilization, invoiced, active users, scope delivered, quality, risks, etc.

Dashboard To Measure Company Effective Strategies To Succeed At Virtual Ppt Template SA SS V
This slide showcases dashboard that help company to track performance of inside sales strategies such as calls and emails. If your project calls for a presentation, then Slidegeeks is your go-to partner because we have professionally designed, easy-to-edit templates that are perfect for any presentation. After downloading, you can easily edit Dashboard To Measure Company Effective Strategies To Succeed At Virtual Ppt Template SA SS V and make the changes accordingly. You can rearrange slides or fill them with different images. Check out all the handy templates This slide showcases dashboard that help company to track performance of inside sales strategies such as calls and emails.

Quarterly Financial Performance Dashboard By Power BI Ppt Sample SS
This slide represents the pyramid showing the asset performance management. It includes details related to APM-centric, predictive, condition-based, preventive and reactive maintenance. Find a pre-designed and impeccable Quarterly Financial Performance Dashboard By Power BI Ppt Sample SS The templates can ace your presentation without additional effort. You can download these easy-to-edit presentation templates to make your presentation stand out from others. So, what are you waiting for Download the template from Slidegeeks today and give a unique touch to your presentation. This slide represents the pyramid showing the asset performance management. It includes details related to APM-centric, predictive, condition-based, preventive and reactive maintenance.
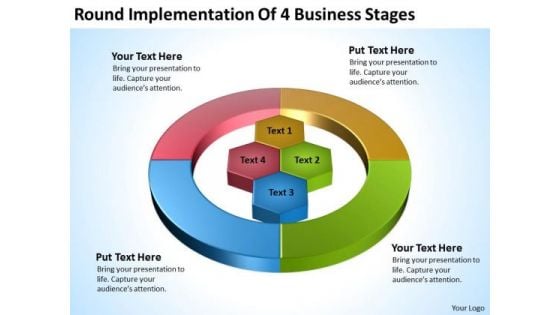
Business PowerPoint Templates Stages Cleaning Company Plan
We present our business powerpoint templates stages cleaning company plan.Download our Hexagon PowerPoint Templates because You are an avid believer in ethical practices. Highlight the benefits that accrue with our PowerPoint Templates and Slides. Present our Circle Charts PowerPoint Templates because It will Strengthen your hand with your thoughts. They have all the aces you need to win the day. Present our Circle Charts PowerPoint Templates because It can Bubble and burst with your ideas. Download our Ring Charts PowerPoint Templates because Our PowerPoint Templates and Slides will let your team Walk through your plans. See their energy levels rise as you show them the way. Use our Shapes PowerPoint Templates because It will Strengthen your hand with your thoughts. They have all the aces you need to win the day.Use these PowerPoint slides for presentations relating to process, diagram, business, project, arrow, flow, icon, chart, art, market, isolated, statistics, percent, economy, white, blank, concept, value, circle, graphic, data, element, report, management, graph, wheel, cycle, design, growth, profit, information, background, financial, adding. The prominent colors used in the PowerPoint template are Red, Blue, Green. Enumerate the facts on our Business PowerPoint Templates Stages Cleaning Company Plan. Establish the correct chain of events.
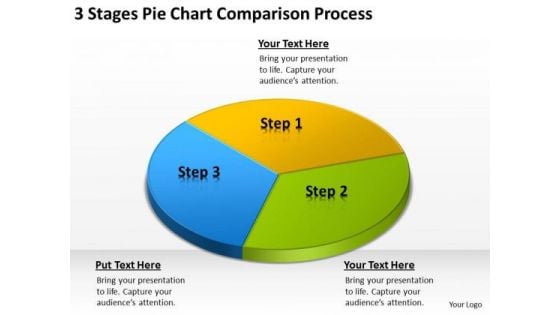
3 Stages Pie Chart Comparison Process Examples Of Business Plan PowerPoint Templates
We present our 3 stages pie chart comparison process examples of business plan PowerPoint templates.Download and present our Circle Charts PowerPoint Templates because It is Aesthetically crafted by artistic young minds. Our PowerPoint Templates and Slides are designed to display your dexterity. Present our Flow Charts PowerPoint Templates because Our PowerPoint Templates and Slides will provide weight to your words. They will bring out the depth of your thought process. Use our Process and Flows PowerPoint Templates because you can Add colour to your speech with our PowerPoint Templates and Slides. Your presentation will leave your audience speechless. Present our Business PowerPoint Templates because our PowerPoint Templates and Slides will give your ideas the shape. Download our Marketing PowerPoint Templates because Our PowerPoint Templates and Slides will let you Hit the right notes. Watch your audience start singing to your tune.Use these PowerPoint slides for presentations relating to Abstract, banking, blank, business, chart, circle, company, concept, control, corporate, data, diagram, display, element, environment,finance, financial, graph, graphic, icon, illustration, information, isolated, isometric, management, market, marketing, modern, motion, movement,organization, perspective, pie, presentation, report, ring, sales, sheet, sign, slice, stock, symbol, three, text. The prominent colors used in the PowerPoint template are Yellow, Blue light, Green lime. Power the people with your thoughts. Give them the force with our 3 Stages Pie Chart Comparison Process Examples Of Business Plan PowerPoint Templates.
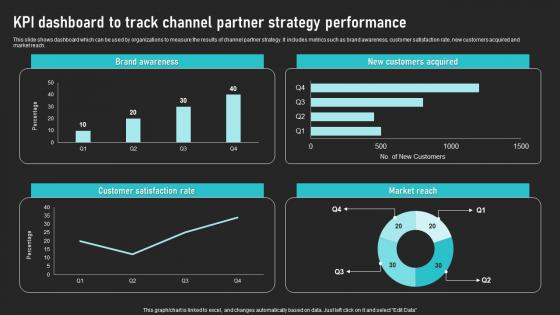
KPI Dashboard To Track Channel Partner Strategy Performance Cooperative Sales Tactics Structure Pdf
This slide shows dashboard which can be used by organizations to measure the results of channel partner strategy. It includes metrics such as brand awareness, customer satisfaction rate, new customers acquired and market reach. Get a simple yet stunning designed KPI Dashboard To Track Channel Partner Strategy Performance Cooperative Sales Tactics Structure Pdf It is the best one to establish the tone in your meetings. It is an excellent way to make your presentations highly effective. So, download this PPT today from Slidegeeks and see the positive impacts. Our easy-to-edit KPI Dashboard To Track Channel Partner Strategy Performance Cooperative Sales Tactics Structure Pdf can be your go-to option for all upcoming conferences and meetings. So, what are you waiting for Grab this template today. This slide shows dashboard which can be used by organizations to measure the results of channel partner strategy. It includes metrics such as brand awareness, customer satisfaction rate, new customers acquired and market reach.
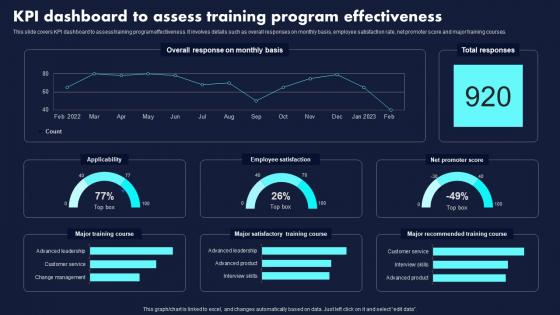
KPI Dashboard To Assess Training Program Effectiveness Proven Techniques For Enhancing Summary Pdf
This slide covers KPI dashboard to assess training program effectiveness. It involves details such as overall responses on monthly basis, employee satisfaction rate, net promoter score and major training courses. Do you have an important presentation coming up Are you looking for something that will make your presentation stand out from the rest Look no further than KPI Dashboard To Assess Training Program Effectiveness Proven Techniques For Enhancing Summary Pdf. With our professional designs, you can trust that your presentation will pop and make delivering it a smooth process. And with Slidegeeks, you can trust that your presentation will be unique and memorable. So why wait Grab KPI Dashboard To Assess Training Program Effectiveness Proven Techniques For Enhancing Summary Pdf today and make your presentation stand out from the rest. This slide covers KPI dashboard to assess training program effectiveness. It involves details such as overall responses on monthly basis, employee satisfaction rate, net promoter score and major training courses.
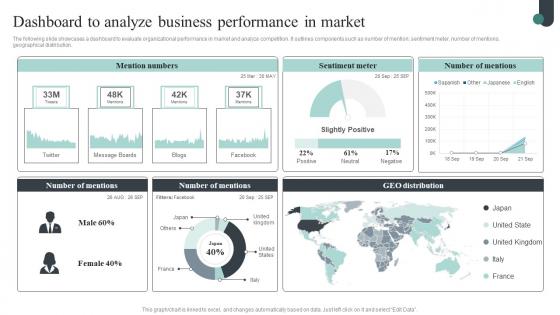
Competitive Intelligence Guide To Determine Market Dashboard To Analyze Business Pictures Pdf
The following slide showcases a dashboard to evaluate organizational performance in market and analyze competition. It outlines components such as number of mention, sentiment meter, number of mentions, geographical distribution. Do you have to make sure that everyone on your team knows about any specific topic I yes, then you should give Competitive Intelligence Guide To Determine Market Dashboard To Analyze Business Pictures Pdf a try. Our experts have put a lot of knowledge and effort into creating this impeccable Competitive Intelligence Guide To Determine Market Dashboard To Analyze Business Pictures Pdf. You can use this template for your upcoming presentations, as the slides are perfect to represent even the tiniest detail. You can download these templates from the Slidegeeks website and these are easy to edit. So grab these today. The following slide showcases a dashboard to evaluate organizational performance in market and analyze competition. It outlines components such as number of mention, sentiment meter, number of mentions, geographical distribution.
Dashboard For Tracking Email Mass Marketing Definitive Guide On Mass Advertising Infographics Pdf
This slide showcases the dashboard for monitoring the email marketing campaign performance. It includes the open rate, click-through rate CTR, bounce rate, conversion ratio, new subscribers, and unsubscribe rate. Do you have to make sure that everyone on your team knows about any specific topic I yes, then you should give Dashboard For Tracking Email Mass Marketing Definitive Guide On Mass Advertising Infographics Pdf a try. Our experts have put a lot of knowledge and effort into creating this impeccable Dashboard For Tracking Email Mass Marketing Definitive Guide On Mass Advertising Infographics Pdf. You can use this template for your upcoming presentations, as the slides are perfect to represent even the tiniest detail. You can download these templates from the Slidegeeks website and these are easy to edit. So grab these today. This slide showcases the dashboard for monitoring the email marketing campaign performance. It includes the open rate, click-through rate CTR, bounce rate, conversion ratio, new subscribers, and unsubscribe rate.
Strategic Guide To Attract Dashboard For Tracking Viral Posts Across Digital Summary Pdf
This slide showcases dashboard which can help marketers track viral posts across multiple platforms. It provides details about viral views, seed views, direct, searh, referrer, network, Facebook, Twitter, etc. Do you have an important presentation coming up Are you looking for something that will make your presentation stand out from the rest Look no further than Strategic Guide To Attract Dashboard For Tracking Viral Posts Across Digital Summary Pdf. With our professional designs, you can trust that your presentation will pop and make delivering it a smooth process. And with Slidegeeks, you can trust that your presentation will be unique and memorable. So why wait Grab Strategic Guide To Attract Dashboard For Tracking Viral Posts Across Digital Summary Pdf today and make your presentation stand out from the rest. This slide showcases dashboard which can help marketers track viral posts across multiple platforms. It provides details about viral views, seed views, direct, searh, referrer, network, Facebook, Twitter, etc.
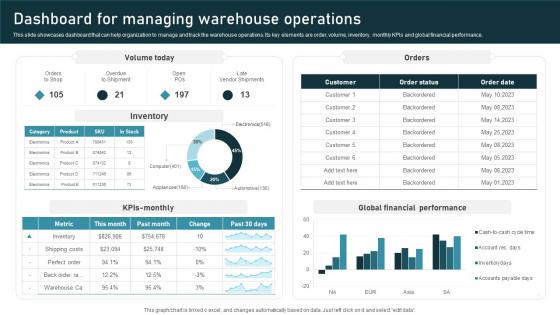
Dashboard Managing Inventory Administration Techniques For Enhanced Stock Accuracy Mockup Pdf
This slide showcases dashboard that can help organization to manage and track the warehouse operations. Its key elements are order, volume, inventory, monthly KPIs and global financial performance. Do you have an important presentation coming up Are you looking for something that will make your presentation stand out from the rest Look no further than Dashboard Managing Inventory Administration Techniques For Enhanced Stock Accuracy Mockup Pdf. With our professional designs, you can trust that your presentation will pop and make delivering it a smooth process. And with Slidegeeks, you can trust that your presentation will be unique and memorable. So why wait Grab Dashboard Managing Inventory Administration Techniques For Enhanced Stock Accuracy Mockup Pdf today and make your presentation stand out from the rest This slide showcases dashboard that can help organization to manage and track the warehouse operations. Its key elements are order, volume, inventory, monthly KPIs and global financial performance.
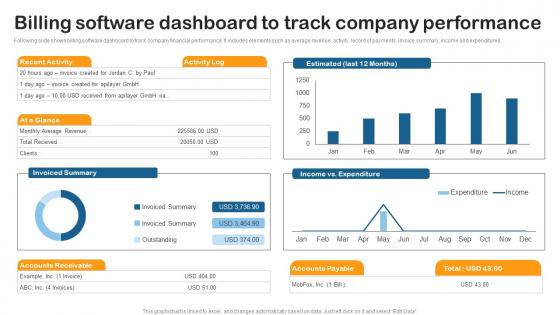
Billing Software Dashboard Track Building Utility Billing And Invoicing Management System Inspiration Pdf
Following slide shows billing software dashboard to track company financial performance. It includes elements such as average revenue, activity record of payments, invoice summary, income and expenditures. Create an editable Billing Software Dashboard Track Building Utility Billing And Invoicing Management System Inspiration Pdf that communicates your idea and engages your audience. Whether you are presenting a business or an educational presentation, pre designed presentation templates help save time. Billing Software Dashboard Track Building Utility Billing And Invoicing Management System Inspiration Pdf is highly customizable and very easy to edit, covering many different styles from creative to business presentations. Slidegeeks has creative team members who have crafted amazing templates. So, go and get them without any delay. Following slide shows billing software dashboard to track company financial performance. It includes elements such as average revenue, activity record of payments, invoice summary, income and expenditures.
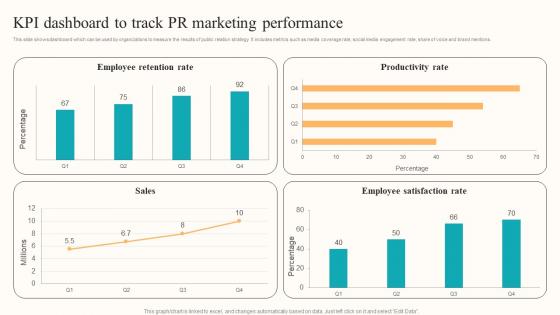
KPI Dashboard Track PR Developing Employee Centric Marketing Program Designs Pdf
This slide shows dashboard which can be used by organizations to measure the results of public relation strategy. It includes metrics such as media coverage rate, social media engagement rate, share of voice and brand mentions. This KPI Dashboard Track PR Developing Employee Centric Marketing Program Designs Pdf is perfect for any presentation, be it in front of clients or colleagues. It is a versatile and stylish solution for organizing your meetings. The KPI Dashboard Track PR Developing Employee Centric Marketing Program Designs Pdf features a modern design for your presentation meetings. The adjustable and customizable slides provide unlimited possibilities for acing up your presentation. Slidegeeks has done all the homework before launching the product for you. So, do not wait, grab the presentation templates today This slide shows dashboard which can be used by organizations to measure the results of public relation strategy. It includes metrics such as media coverage rate, social media engagement rate, share of voice and brand mentions.
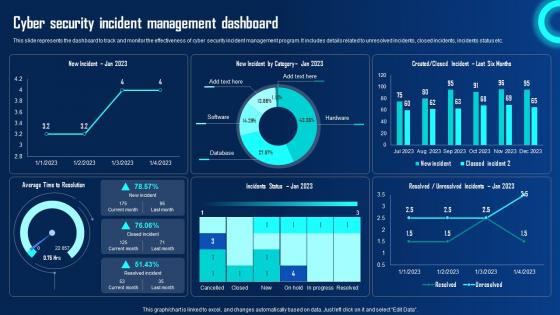
Cyber Security Incident Management Dashboard Ppt Powerpoint Presentation File Ideas Pdf
This slide represents the dashboard to track and monitor the effectiveness of cyber security incident management program. It includes details related to unresolved incidents, closed incidents, incidents status etc. Crafting an eye catching presentation has never been more straightforward. Let your presentation shine with this tasteful yet straightforward Cyber Security Incident Management Dashboard Ppt Powerpoint Presentation File Ideas Pdf template. It offers a minimalistic and classy look that is great for making a statement. The colors have been employed intelligently to add a bit of playfulness while still remaining professional. Construct the ideal Cyber Security Incident Management Dashboard Ppt Powerpoint Presentation File Ideas Pdf that effortlessly grabs the attention of your audience Begin now and be certain to wow your customers This slide represents the dashboard to track and monitor the effectiveness of cyber security incident management program. It includes details related to unresolved incidents, closed incidents, incidents status etc.
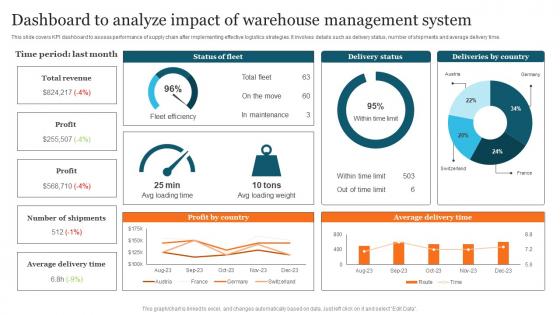
Dashboard To Analyze Impact Advanced Supply Chain Improvement Strategies Structure Pdf
This slide covers KPI dashboard to assess performance of supply chain after implementing effective logistics strategies. It involves details such as delivery status, number of shipments and average delivery time. Get a simple yet stunning designed Dashboard To Analyze Impact Advanced Supply Chain Improvement Strategies Structure Pdf. It is the best one to establish the tone in your meetings. It is an excellent way to make your presentations highly effective. So, download this PPT today from Slidegeeks and see the positive impacts. Our easy to edit Dashboard To Analyze Impact Advanced Supply Chain Improvement Strategies Structure Pdf can be your go to option for all upcoming conferences and meetings. So, what are you waiting for Grab this template today. This slide covers KPI dashboard to assess performance of supply chain after implementing effective logistics strategies. It involves details such as delivery status, number of shipments and average delivery time.
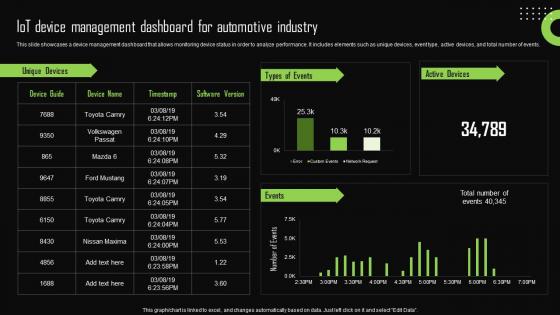
Iot Device Management Dashboard For Automotive Iot Device Management Sample Pdf
This slide showcases a device management dashboard that allows monitoring device status in order to analyze performance. It includes elements such as unique devices, event type, active devices, and total number of events. Create an editable Iot Device Management Dashboard For Automotive Iot Device Management Sample Pdf that communicates your idea and engages your audience. Whether you are presenting a business or an educational presentation, pre-designed presentation templates help save time. Iot Device Management Dashboard For Automotive Iot Device Management Sample Pdf is highly customizable and very easy to edit, covering many different styles from creative to business presentations. Slidegeeks has creative team members who have crafted amazing templates. So, go and get them without any delay. This slide showcases a device management dashboard that allows monitoring device status in order to analyze performance. It includes elements such as unique devices, event type, active devices, and total number of events.
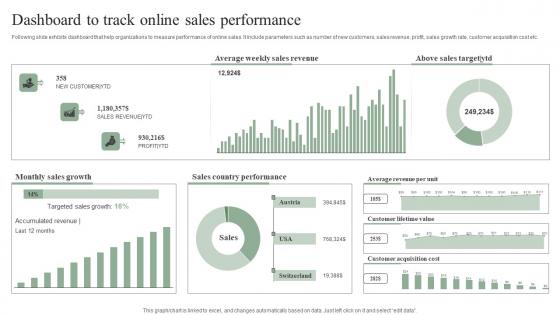
Dashboard To Track Online Sales Performance Efficient Marketing Tactics Topics Pdf
Following slide exhibits dashboard that help organizations to measure performance of online sales. It include parameters such as number of new customers, sales revenue, profit, sales growth rate, customer acquisition cost etc. Do you have an important presentation coming up Are you looking for something that will make your presentation stand out from the rest Look no further than Dashboard To Track Online Sales Performance Efficient Marketing Tactics Topics Pdf. With our professional designs, you can trust that your presentation will pop and make delivering it a smooth process. And with Slidegeeks, you can trust that your presentation will be unique and memorable. So why wait Grab Dashboard To Track Online Sales Performance Efficient Marketing Tactics Topics Pdf today and make your presentation stand out from the rest Following slide exhibits dashboard that help organizations to measure performance of online sales. It include parameters such as number of new customers, sales revenue, profit, sales growth rate, customer acquisition cost etc.
Dashboard For Tracking Impact Of Implementing Sales Techniques For Achieving Rules Pdf
This slide covers the KPI dashboard for tracking KPIs such as new customer YTD, sales revenue, profit, average weekly sales, above sales target, average revenue per unit, customer lifetime value, etc. Do you have an important presentation coming up Are you looking for something that will make your presentation stand out from the rest Look no further than Dashboard For Tracking Impact Of Implementing Sales Techniques For Achieving Rules Pdf. With our professional designs, you can trust that your presentation will pop and make delivering it a smooth process. And with Slidegeeks, you can trust that your presentation will be unique and memorable. So why wait Grab Dashboard For Tracking Impact Of Implementing Sales Techniques For Achieving Rules Pdf today and make your presentation stand out from the rest This slide covers the KPI dashboard for tracking KPIs such as new customer YTD, sales revenue, profit, average weekly sales, above sales target, average revenue per unit, customer lifetime value, etc.
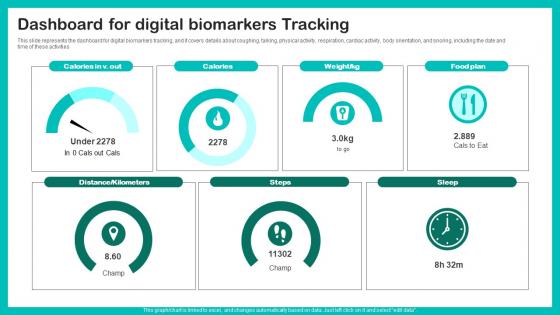
Digital Biomarkers For Personalized Health Insights Dashboard For Digital Biomarkers Template Pdf
This slide represents the dashboard for digital biomarkers tracking, and it covers details about coughing, talking, physical activity, respiration, cardiac activity, body orientation, and snoring, including the date and time of these activities Get a simple yet stunning designed Digital Biomarkers For Personalized Health Insights Dashboard For Digital Biomarkers Template Pdf. It is the best one to establish the tone in your meetings. It is an excellent way to make your presentations highly effective. So, download this PPT today from Slidegeeks and see the positive impacts. Our easy to edit Digital Biomarkers For Personalized Health Insights Dashboard For Digital Biomarkers Template Pdf can be your go to option for all upcoming conferences and meetings. So, what are you waiting for Grab this template today. This slide represents the dashboard for digital biomarkers tracking, and it covers details about coughing, talking, physical activity, respiration, cardiac activity, body orientation, and snoring, including the date and time of these activities
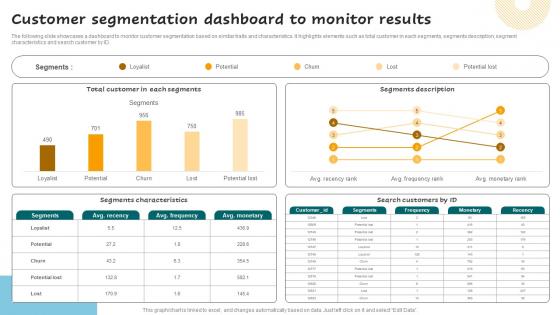
Customer Segmentation Dashboard To Monitor Successful Guide For Market Segmentation Formats Pdf
The following slide showcases a dashboard to monitor customer segmentation based on similar traits and characteristics. It highlights elements such as total customer in each segments, segments description, segment characteristics and search customer by ID. Get a simple yet stunning designed Customer Segmentation Dashboard To Monitor Successful Guide For Market Segmentation Formats Pdf. It is the best one to establish the tone in your meetings. It is an excellent way to make your presentations highly effective. So, download this PPT today from Slidegeeks and see the positive impacts. Our easy-to-edit Customer Segmentation Dashboard To Monitor Successful Guide For Market Segmentation Formats Pdf can be your go-to option for all upcoming conferences and meetings. So, what are you waiting for Grab this template today. The following slide showcases a dashboard to monitor customer segmentation based on similar traits and characteristics. It highlights elements such as total customer in each segments, segments description, segment characteristics and search customer by ID.
Dashboard For Tracking Email Mass Marketing Campaign In Depth Overview Of Mass Slides Pdf
This slide showcases the dashboard for monitoring the email marketing campaign performance. It includes the open rate, click-through rate CTR, bounce rate, conversion ratio, new subscribers, and unsubscribe rate. Do you have to make sure that everyone on your team knows about any specific topic I yes, then you should give Dashboard For Tracking Email Mass Marketing Campaign In Depth Overview Of Mass Slides Pdf a try. Our experts have put a lot of knowledge and effort into creating this impeccable Dashboard For Tracking Email Mass Marketing Campaign In Depth Overview Of Mass Slides Pdf You can use this template for your upcoming presentations, as the slides are perfect to represent even the tiniest detail. You can download these templates from the Slidegeeks website and these are easy to edit. So grab these today. This slide showcases the dashboard for monitoring the email marketing campaign performance. It includes the open rate, click-through rate CTR, bounce rate, conversion ratio, new subscribers, and unsubscribe rate.
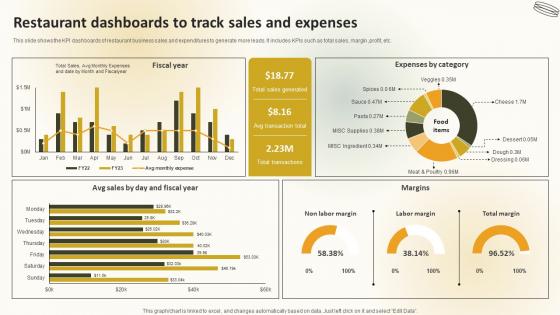
Restaurant Dashboards To Track Sales And Expenses Create An Effective Restaurant
This slide shows the KPI dashboards of restaurant business sales and expenditures to generate more leads. It includes KPIs such as total sales, margin,profit, etc. Create an editable Restaurant Dashboards To Track Sales And Expenses Create An Effective Restaurant that communicates your idea and engages your audience. Whether you are presenting a business or an educational presentation, pre-designed presentation templates help save time. Restaurant Dashboards To Track Sales And Expenses Create An Effective Restaurant is highly customizable and very easy to edit, covering many different styles from creative to business presentations. Slidegeeks has creative team members who have crafted amazing templates. So, go and get them without any delay. This slide shows the KPI dashboards of restaurant business sales and expenditures to generate more leads. It includes KPIs such as total sales, margin,profit, etc.
Ultimate Guide To Cold Calling Sources Tracking Kpi Dashboard SA SS V
This slide outlines a call-tracking dashboard that helps marketers to track call quality, encompassing volume of calls, top call sources, total calls, etc. Do you have an important presentation coming up Are you looking for something that will make your presentation stand out from the rest Look no further than Ultimate Guide To Cold Calling Sources Tracking Kpi Dashboard SA SS V. With our professional designs, you can trust that your presentation will pop and make delivering it a smooth process. And with Slidegeeks, you can trust that your presentation will be unique and memorable. So why wait Grab Ultimate Guide To Cold Calling Sources Tracking Kpi Dashboard SA SS V today and make your presentation stand out from the rest This slide outlines a call-tracking dashboard that helps marketers to track call quality, encompassing volume of calls, top call sources, total calls, etc.
Increasing Business Awareness Tracking Dashboard For Social Media Engagement Strategy SS V
This slide represents a dashboard tracking multiple social media campaigns performance KPIs. It includes metrics such as average impressions per post, average reach, engagement rate, click through rate, reactions and CTR. This Increasing Business Awareness Tracking Dashboard For Social Media Engagement Strategy SS V is perfect for any presentation, be it in front of clients or colleagues. It is a versatile and stylish solution for organizing your meetings. The Increasing Business Awareness Tracking Dashboard For Social Media Engagement Strategy SS V features a modern design for your presentation meetings. The adjustable and customizable slides provide unlimited possibilities for acing up your presentation. Slidegeeks has done all the homework before launching the product for you. So, do not wait, grab the presentation templates today This slide represents a dashboard tracking multiple social media campaigns performance KPIs. It includes metrics such as average impressions per post, average reach, engagement rate, click through rate, reactions and CTR.
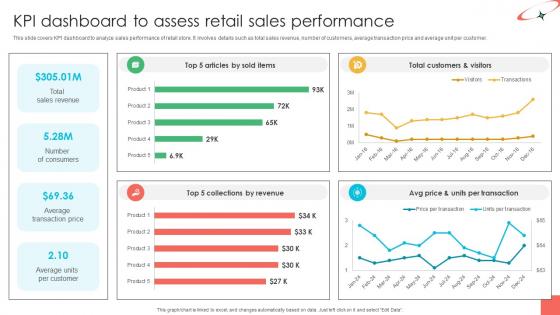
Marketing Strategies For Effective KPI Dashboard To Assess Retail Sales Performance
This slide covers KPI dashboard to analyze sales performance of retail store. It involves details such as total sales revenue, number of customers, average transaction price and average unit per customer. This Marketing Strategies For Effective KPI Dashboard To Assess Retail Sales Performance is perfect for any presentation, be it in front of clients or colleagues. It is a versatile and stylish solution for organizing your meetings. The Marketing Strategies For Effective KPI Dashboard To Assess Retail Sales Performance features a modern design for your presentation meetings. The adjustable and customizable slides provide unlimited possibilities for acing up your presentation. Slidegeeks has done all the homework before launching the product for you. So, do not wait, grab the presentation templates today This slide covers KPI dashboard to analyze sales performance of retail store. It involves details such as total sales revenue, number of customers, average transaction price and average unit per customer.

Marketing Growth Strategy KPI Dashboard To Evaluate Sales Performance Strategy SS V
The following slide outlines key performance indicator KPI dashboard to monitor sales performance of company. The key metrics covered in slide are total sales by location, monthly sales trend, average revenue AR by clients, etc. This Marketing Growth Strategy KPI Dashboard To Evaluate Sales Performance Strategy SS V is perfect for any presentation, be it in front of clients or colleagues. It is a versatile and stylish solution for organizing your meetings. The Marketing Growth Strategy KPI Dashboard To Evaluate Sales Performance Strategy SS V features a modern design for your presentation meetings. The adjustable and customizable slides provide unlimited possibilities for acing up your presentation. Slidegeeks has done all the homework before launching the product for you. So, do not wait, grab the presentation templates today The following slide outlines key performance indicator KPI dashboard to monitor sales performance of company. The key metrics covered in slide are total sales by location, monthly sales trend, average revenue AR by clients, etc.
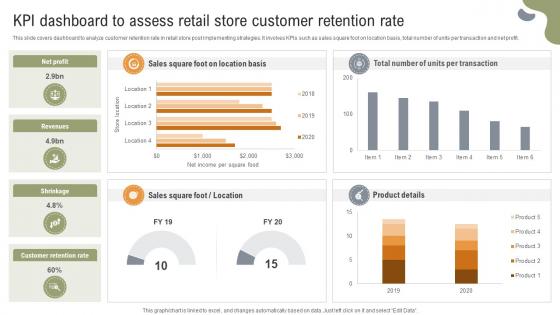
Implementing Strategies To Enhance Grocery KPI Dashboard To Assess Retail Store Customer
This slide covers dashboard to analyze customer retention rate in retail store post implementing strategies. It involves KPIs such as sales square foot on location basis, total number of units per transaction and net profit. Crafting an eye-catching presentation has never been more straightforward. Let your presentation shine with this tasteful yet straightforward Implementing Strategies To Enhance Grocery KPI Dashboard To Assess Retail Store Customer template. It offers a minimalistic and classy look that is great for making a statement. The colors have been employed intelligently to add a bit of playfulness while still remaining professional. Construct the ideal Implementing Strategies To Enhance Grocery KPI Dashboard To Assess Retail Store Customer that effortlessly grabs the attention of your audience Begin now and be certain to wow your customers This slide covers dashboard to analyze customer retention rate in retail store post implementing strategies. It involves KPIs such as sales square foot on location basis, total number of units per transaction and net profit.
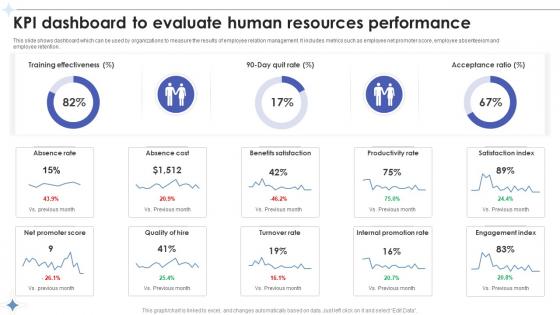
Employee Relations In Human Resource Kpi Dashboard To Evaluate Human Resources Performance
This slide shows dashboard which can be used by organizations to measure the results of employee relation management. It includes metrics such as employee net promoter score, employee absenteeism and employee retention. This Employee Relations In Human Resource Kpi Dashboard To Evaluate Human Resources Performance is perfect for any presentation, be it in front of clients or colleagues. It is a versatile and stylish solution for organizing your meetings. The Employee Relations In Human Resource Kpi Dashboard To Evaluate Human Resources Performance features a modern design for your presentation meetings. The adjustable and customizable slides provide unlimited possibilities for acing up your presentation. Slidegeeks has done all the homework before launching the product for you. So, do not wait, grab the presentation templates today This slide shows dashboard which can be used by organizations to measure the results of employee relation management. It includes metrics such as employee net promoter score, employee absenteeism and employee retention.
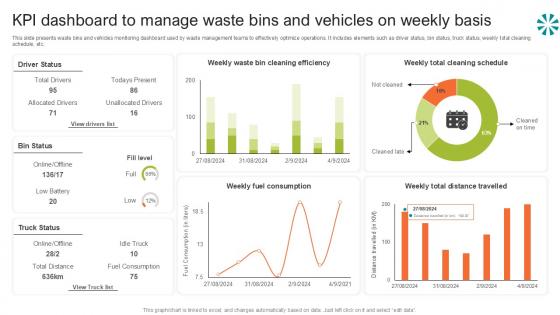
Kpi Dashboard To Manage Waste Step By Step Guide For Electronic Ppt Template
This slide presents waste bins and vehicles monitoring dashboard used by waste management teams to effectively optimize operations. It includes elements such as driver status, bin status, truck status, weekly total cleaning schedule, etc. This Kpi Dashboard To Manage Waste Step By Step Guide For Electronic Ppt Template is perfect for any presentation, be it in front of clients or colleagues. It is a versatile and stylish solution for organizing your meetings. The Kpi Dashboard To Manage Waste Step By Step Guide For Electronic Ppt Template features a modern design for your presentation meetings. The adjustable and customizable slides provide unlimited possibilities for acing up your presentation. Slidegeeks has done all the homework before launching the product for you. So, do not wait, grab the presentation templates today This slide presents waste bins and vehicles monitoring dashboard used by waste management teams to effectively optimize operations. It includes elements such as driver status, bin status, truck status, weekly total cleaning schedule, etc.
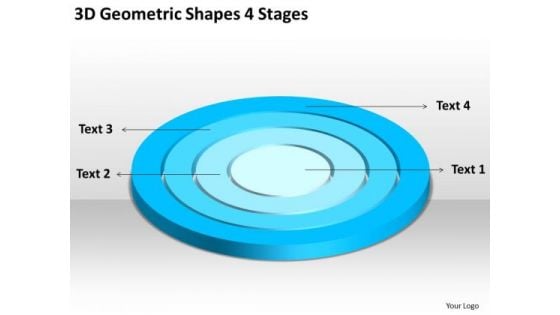
3d Geometric Shapes 4 Stages Written Business Plan PowerPoint Templates
We present our 3d geometric shapes 4 stages written business plan PowerPoint templates.Download and present our Circle Charts PowerPoint Templates because Our PowerPoint Templates and Slides will provide weight to your words. They will bring out the depth of your thought process. Download our Shapes PowerPoint Templates because Our PowerPoint Templates and Slides will let you Hit the target. Go the full distance with ease and elan. Download and present our Signs PowerPoint Templates because They will bring a lot to the table. Their alluring flavours will make your audience salivate. Download our Maketing PowerPoint Templates because Our PowerPoint Templates and Slides come in all colours, shades and hues. They help highlight every nuance of your views. Use our Metaphors-Visual Concepts PowerPoint Templates because you can Break through with our PowerPoint Templates and Slides. Bring down the mental barriers of your audience.Use these PowerPoint slides for presentations relating to diagram, circular, market, bar, advertise, interface, business, concept, vector, sign, success, presentation, symbol, template, circle, brochure, finance, data, description, report, marketing, title, label, abstract, management, graph, four, illustration, icon, pie, chart, strategy, catalog, research, web, design, growth, text, professional, banner, account, profit, information, background, info-graphic, analyze, financial, button, goals. The prominent colors used in the PowerPoint template are Blue, Blue light, White. Get fascinated by our 3d Geometric Shapes 4 Stages Written Business Plan PowerPoint Templates. They will keep attracting your attention.
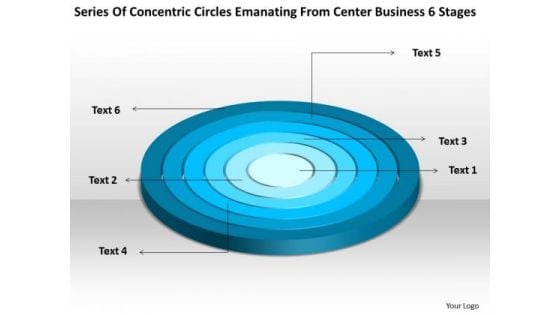
Emanating From Center Business 6 Stages Non Profit Plan Sample PowerPoint Templates
We present our emanating from center business 6 stages non profit plan sample PowerPoint templates.Use our Circle Charts PowerPoint Templates because You have the co-ordinates for your destination of success. Let our PowerPoint Templates and Slides map out your journey. Download our Shapes PowerPoint Templates because Our PowerPoint Templates and Slides will let you meet your Deadlines. Download our Signs PowerPoint Templates because Your audience will believe you are the cats whiskers. Download our Maketing PowerPoint Templates because Our PowerPoint Templates and Slides team portray an attitude of elegance. Personify this quality by using them regularly. Download our Metaphors-Visual Concepts PowerPoint Templates because Our PowerPoint Templates and Slides has conjured up a web of all you need with the help of our great team. Use them to string together your glistening ideas.Use these PowerPoint slides for presentations relating to diagram, circular, market, bar, advertise, interface, business, concept, vector, sign, success, presentation, symbol, template, circle, brochure, finance, data, description, report, marketing, title, label, abstract, management, graph, four, illustration, icon, pie, chart, strategy, catalog, research, web, design, growth, text, professional, banner, account, profit, information, background, info-graphic, analyze, financial, button, goals. The prominent colors used in the PowerPoint template are Blue, Blue light, White. Bonds created with our Emanating From Center Business 6 Stages Non Profit Plan Sample PowerPoint Templates will never break. They ensure alliances endure.
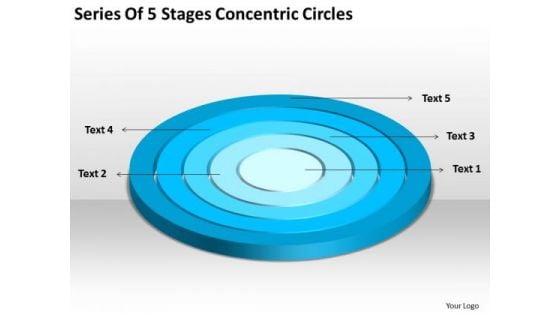
Series Of 5 Stages Concentric Circles Courier Business Plan PowerPoint Templates
We present our series of 5 stages concentric circles courier business plan PowerPoint templates.Use our Circle Charts PowerPoint Templates because Our PowerPoint Templates and Slides are designed to help you succeed. They have all the ingredients you need. Present our Shapes PowerPoint Templates because Our PowerPoint Templates and Slides will let you Leave a lasting impression to your audiences. They possess an inherent longstanding recall factor. Download our Signs PowerPoint Templates because You can Hit the nail on the head with our PowerPoint Templates and Slides. Embed your ideas in the minds of your audience. Present our Maketing PowerPoint Templates because Our PowerPoint Templates and Slides will Embellish your thoughts. They will help you illustrate the brilliance of your ideas. Use our Metaphors-Visual Concepts PowerPoint Templates because Our PowerPoint Templates and Slides will let your team Walk through your plans. See their energy levels rise as you show them the way.Use these PowerPoint slides for presentations relating to diagram, circular, market, bar, advertise, interface, business, concept, vector, sign, success, presentation, symbol, template, circle, brochure, finance, data, description, report, marketing, title, label, abstract, management, graph, four, illustration, icon, pie, chart, strategy, catalog, research, web, design, growth, text, professional, banner, account, profit, information, background, info-graphic, analyze, financial, button, goals. The prominent colors used in the PowerPoint template are Blue, Blue light, White. Our Series Of 5 Stages Concentric Circles Courier Business Plan PowerPoint Templates team are a multi-faceted lot. They address issues from different angles.


 Continue with Email

 Home
Home


