Data Analytics Icons
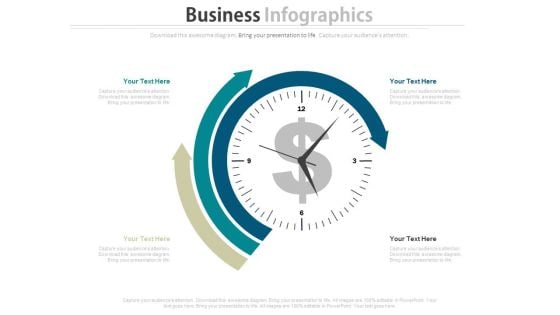
Dashboard Diagram For Finance And Strategic Analysis Powerpoint Slides
This PowerPoint template display graphics of clock with arrows around it and dollar symbol in center. You may use this PPT slide for financial and strategic analysis. This dashboard slide may useful for multilevel status report creation and approval process.
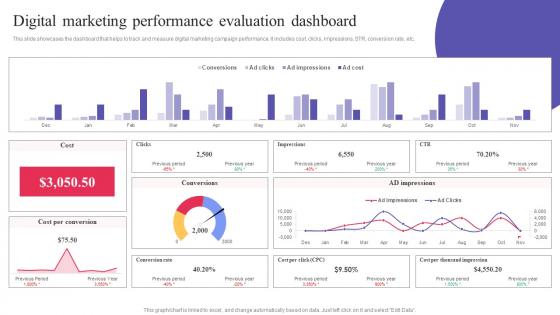
Digital Marketing Performance Evaluation Dashboard Digital Promotional Campaign Summary Pdf
This slide showcases the dashboard that helps to track and measure digital marketing campaign performance. It includes cost, clicks, impressions, STR, conversion rate, etc. Whether you have daily or monthly meetings, a brilliant presentation is necessary. Digital Marketing Performance Evaluation Dashboard Digital Promotional Campaign Summary Pdf can be your best option for delivering a presentation. Represent everything in detail using Digital Marketing Performance Evaluation Dashboard Digital Promotional Campaign Summary Pdf and make yourself stand out in meetings. The template is versatile and follows a structure that will cater to your requirements. All the templates prepared by Slidegeeks are easy to download and edit. Our research experts have taken care of the corporate themes as well. So, give it a try and see the results. This slide showcases the dashboard that helps to track and measure digital marketing campaign performance. It includes cost, clicks, impressions, STR, conversion rate, etc.
Strategic Supplier Evaluation For KPI Dashboard For Tracking Supplier Compliance
Mentioned slide demonstrates KPI dashboard for evaluating supplier compliance and performance. It includes key components such as total suppliers, contracts, unlisted, contact compliance rate. Whether you have daily or monthly meetings, a brilliant presentation is necessary. Strategic Supplier Evaluation For KPI Dashboard For Tracking Supplier Compliance can be your best option for delivering a presentation. Represent everything in detail using Strategic Supplier Evaluation For KPI Dashboard For Tracking Supplier Compliance and make yourself stand out in meetings. The template is versatile and follows a structure that will cater to your requirements. All the templates prepared by Slidegeeks are easy to download and edit. Our research experts have taken care of the corporate themes as well. So, give it a try and see the results. Mentioned slide demonstrates KPI dashboard for evaluating supplier compliance and performance. It includes key components such as total suppliers, contracts, unlisted, contact compliance rate,
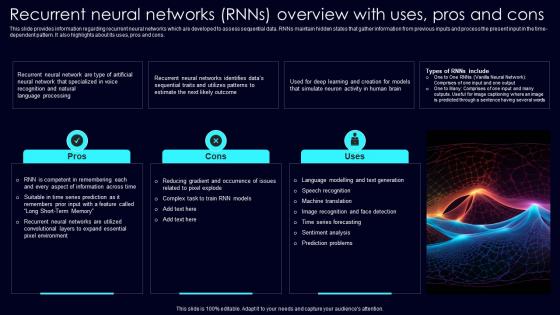
Recurrent Neural Networks RNNs Exploring Rise Of Generative AI In Artificial Intelligence Diagrams Pdf
This slide provides information regarding recurrent neural networks which are developed to assess sequential data. RNNs maintain hidden states that gather information from previous inputs and process the present input in the time dependent pattern. It also highlights about its uses, pros and cons. Find highly impressive Recurrent Neural Networks RNNs Exploring Rise Of Generative AI In Artificial Intelligence Diagrams Pdf on Slidegeeks to deliver a meaningful presentation. You can save an ample amount of time using these presentation templates. No need to worry to prepare everything from scratch because Slidegeeks experts have already done a huge research and work for you. You need to download Recurrent Neural Networks RNNs Exploring Rise Of Generative AI In Artificial Intelligence Diagrams Pdf for your upcoming presentation. All the presentation templates are 100 percent editable and you can change the color and personalize the content accordingly. Download now This slide provides information regarding recurrent neural networks which are developed to assess sequential data. RNNs maintain hidden states that gather information from previous inputs and process the present input in the time dependent pattern. It also highlights about its uses, pros and cons.
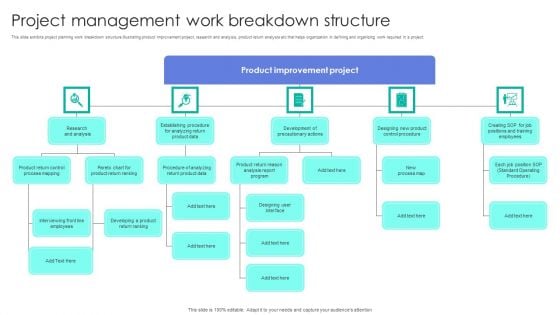
Project Management Work Breakdown Structure Sample PDF
This slide exhibits project planning work breakdown structure illustrating product improvement project, research and analysis, product return analysis etc that helps organization in defining and organizing work required in a project. Presenting Project Management Work Breakdown Structure Sample PDF to dispense important information. This template comprises five stages. It also presents valuable insights into the topics including Product Improvement Project, Analysis, Product Data. This is a completely customizable PowerPoint theme that can be put to use immediately. So, download it and address the topic impactfully.

KPI Dashboard For Monitoring Warehouse Operations Strategic Plan For Enhancing Inspiration Pdf
Mentioned slide illustrates warehouse operations dashboard with key performance indicators KPIs. KPIs included are operating cost, order rate, total shipment by country and on-time shipment. Retrieve professionally designed KPI Dashboard For Monitoring Warehouse Operations Strategic Plan For Enhancing Inspiration Pdf to effectively convey your message and captivate your listeners. Save time by selecting pre-made slideshows that are appropriate for various topics, from business to educational purposes. These themes come in many different styles, from creative to corporate, and all of them are easily adjustable and can be edited quickly. Access them as PowerPoint templates or as Google Slides themes. You do not have to go on a hunt for the perfect presentation because Slidegeeks got you covered from everywhere. Mentioned slide illustrates warehouse operations dashboard with key performance indicators KPIs. KPIs included are operating cost, order rate, total shipment by country and on-time shipment.
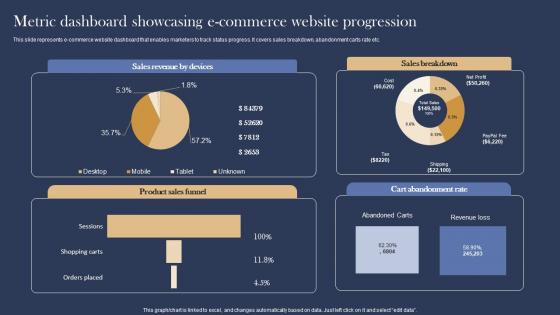
Metric Dashboard Showcasing Management And Marketing Strategies For E Commerce Ideas Pdf
This slide represents e commerce website dashboard that enables marketers to track status progress. It covers sales breakdown, abandonment carts rate etc. Retrieve professionally designed Metric Dashboard Showcasing Management And Marketing Strategies For E Commerce Ideas Pdf to effectively convey your message and captivate your listeners. Save time by selecting pre made slideshows that are appropriate for various topics, from business to educational purposes. These themes come in many different styles, from creative to corporate, and all of them are easily adjustable and can be edited quickly. Access them as PowerPoint templates or as Google Slides themes. You do not have to go on a hunt for the perfect presentation because Slidegeeks got you covered from everywhere. This slide represents e commerce website dashboard that enables marketers to track status progress. It covers sales breakdown, abandonment carts rate etc.
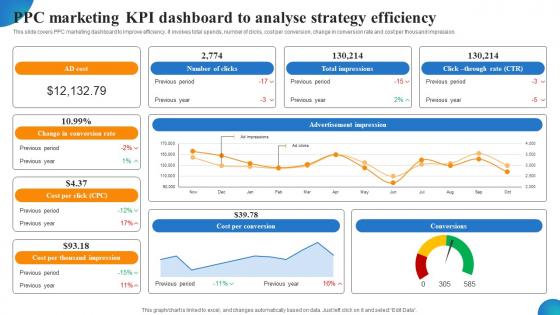
PPC Marketing KPI Dashboard To Analyse Strategy Efficiency MDSS For Enhanced Slides Pdf
This slide covers PPC marketing dashboard to improve efficiency. It involves total spends, number of clicks, cost per conversion, change in conversion rate and cost per thousand impression. Retrieve professionally designed PPC Marketing KPI Dashboard To Analyse Strategy Efficiency MDSS For Enhanced Slides Pdf to effectively convey your message and captivate your listeners. Save time by selecting pre-made slideshows that are appropriate for various topics, from business to educational purposes. These themes come in many different styles, from creative to corporate, and all of them are easily adjustable and can be edited quickly. Access them as PowerPoint templates or as Google Slides themes. You do not have to go on a hunt for the perfect presentation because Slidegeeks got you covered from everywhere. This slide covers PPC marketing dashboard to improve efficiency. It involves total spends, number of clicks, cost per conversion, change in conversion rate and cost per thousand impression.

KPI Dashboard To Track Inside Effective Strategies To Succeed At Virtual Ppt PowerPoint SA SS V
Following slide depicts dashboard to measure and track progress of inside sales strategies implemented by company. Retrieve professionally designed KPI Dashboard To Track Inside Effective Strategies To Succeed At Virtual Ppt PowerPoint SA SS V to effectively convey your message and captivate your listeners. Save time by selecting pre-made slideshows that are appropriate for various topics, from business to educational purposes. These themes come in many different styles, from creative to corporate, and all of them are easily adjustable and can be edited quickly. Access them as PowerPoint templates or as Google Slides themes. You do not have to go on a hunt for the perfect presentation because Slidegeeks got you covered from everywhere. Following slide depicts dashboard to measure and track progress of inside sales strategies implemented by company.
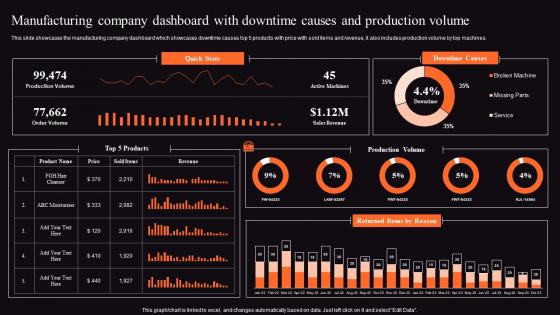
Food Processing Business Profile Manufacturing Company Dashboard Brochure Pdf
This slide showcases the manufacturing company dashboard which showcases downtime causes top 5 products with price with sold items and revenue, it also includes production volume by top machines. Do you know about Slidesgeeks Food Processing Business Profile Manufacturing Company Dashboard Brochure Pdf These are perfect for delivering any kind od presentation. Using it, create PowerPoint presentations that communicate your ideas and engage audiences. Save time and effort by using our pre designed presentation templates that are perfect for a wide range of topic. Our vast selection of designs covers a range of styles, from creative to business, and are all highly customizable and easy to edit. Download as a PowerPoint template or use them as Google Slides themes. This slide showcases the manufacturing company dashboard which showcases downtime causes top 5 products with price with sold items and revenue, it also includes production volume by top machines.

Corporate Governance Of ICT IT Governance Risk Management And Compliance Diagrams PDF
This slide depicts the IT governance, risk management, and compliance, including key IT decisions, decision models, IT governance structure, processes and policies and standards, and so on. The Corporate Governance Of ICT IT Governance Risk Management And Compliance Diagrams PDF is a compilation of the most recent design trends as a series of slides. It is suitable for any subject or industry presentation, containing attractive visuals and photo spots for businesses to clearly express their messages. This template contains a variety of slides for the user to input data, such as structures to contrast two elements, bullet points, and slides for written information. Slidegeeks is prepared to create an impression.
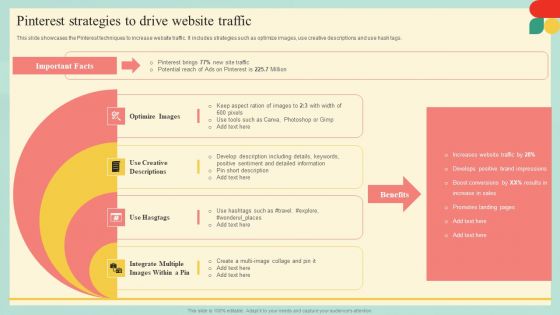
Guide Developing Strategies Improve Travel Tourism Marketing Pinterest Strategies To Drive Diagrams PDF
This slide showcases the Pinterest techniques to increase website traffic. It includes strategies such as optimize images, use creative descriptions and use hash tags. The Guide Developing Strategies Improve Travel Tourism Marketing Pinterest Strategies To Drive Diagrams PDF is a compilation of the most recent design trends as a series of slides. It is suitable for any subject or industry presentation, containing attractive visuals and photo spots for businesses to clearly express their messages. This template contains a variety of slides for the user to input data, such as structures to contrast two elements, bullet points, and slides for written information. Slidegeeks is prepared to create an impression.
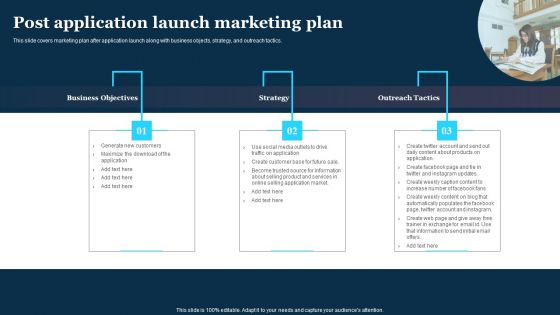
Play Store Launch Techniques For Shopping Apps Post Application Launch Marketing Plan Diagrams PDF
This slide covers marketing plan after application launch along with business objects, strategy, and outreach tactics. The Play Store Launch Techniques For Shopping Apps Post Application Launch Marketing Plan Diagrams PDF is a compilation of the most recent design trends as a series of slides. It is suitable for any subject or industry presentation, containing attractive visuals and photo spots for businesses to clearly express their messages. This template contains a variety of slides for the user to input data, such as structures to contrast two elements, bullet points, and slides for written information. Slidegeeks is prepared to create an impression.
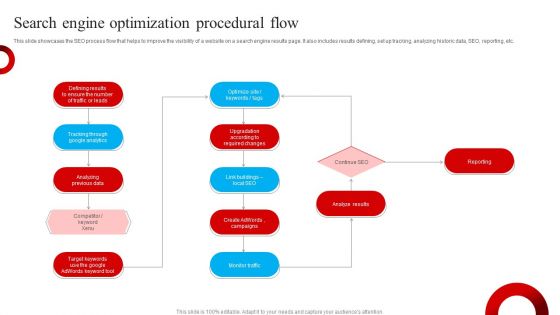
Search Engine Optimization Procedural Flow Elements PDF
This slide showcases the SEO process flow that helps to improve the visibility of a website on a search engine results page. It also includes results defining, set up tracking, analyzing historic data, SEO, reporting, etc. Persuade your audience using this Search Engine Optimization Procedural Flow Elements PDF. This PPT design covers one stages, thus making it a great tool to use. It also caters to a variety of topics including Continue SEO, Analyze Results, Reporting. Download this PPT design now to present a convincing pitch that not only emphasizes the topic but also showcases your presentation skills.
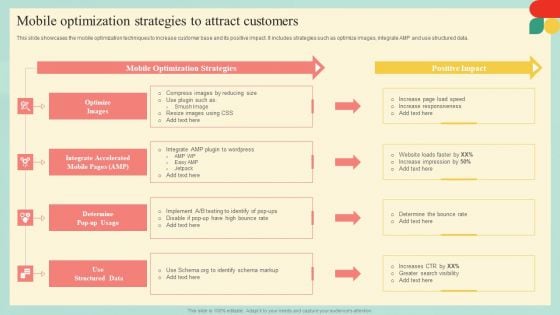
Guide Developing Strategies Improve Travel Tourism Marketing Mobile Optimization Strategies Diagrams PDF
This slide showcases the mobile optimization techniques to increase customer base and its positive impact. It includes strategies such as optimize images, integrate AMP and use structured data. The best PPT templates are a great way to save time, energy, and resources. Slidegeeks have 100 percent editable powerpoint slides making them incredibly versatile. With these quality presentation templates, you can create a captivating and memorable presentation by combining visually appealing slides and effectively communicating your message. Download Guide Developing Strategies Improve Travel Tourism Marketing Mobile Optimization Strategies Diagrams PDF from Slidegeeks and deliver a wonderful presentation.
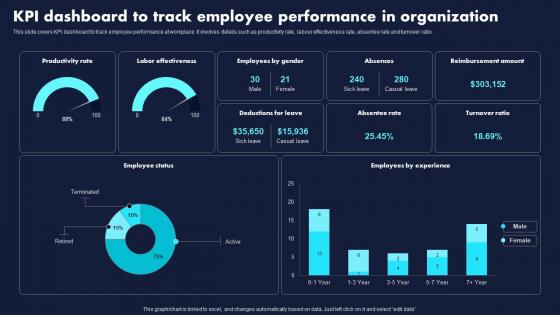
KPI Dashboard To Track Employee Performance Proven Techniques For Enhancing Formats Pdf
This slide covers KPI dashboard to track employee performance at workplace. It involves details such as productivity rate, labour effectiveness rate, absentee rate and turnover ratio.Whether you have daily or monthly meetings, a brilliant presentation is necessary. KPI Dashboard To Track Employee Performance Proven Techniques For Enhancing Formats Pdf can be your best option for delivering a presentation. Represent everything in detail using KPI Dashboard To Track Employee Performance Proven Techniques For Enhancing Formats Pdf and make yourself stand out in meetings. The template is versatile and follows a structure that will cater to your requirements. All the templates prepared by Slidegeeks are easy to download and edit. Our research experts have taken care of the corporate themes as well. So, give it a try and see the results. This slide covers KPI dashboard to track employee performance at workplace. It involves details such as productivity rate, labour effectiveness rate, absentee rate and turnover ratio.
Dashboard For Tracking Aftersales Increasing Client Retention Through Efficient Rules Pdf
This slide covers the KPI dashboard for ticket tracking. It includes metrics such as tickets by month, service level, and details of customer service department agents. Whether you have daily or monthly meetings, a brilliant presentation is necessary. Dashboard For Tracking Aftersales Increasing Client Retention Through Efficient Rules Pdf can be your best option for delivering a presentation. Represent everything in detail using Dashboard For Tracking Aftersales Increasing Client Retention Through Efficient Rules Pdf and make yourself stand out in meetings. The template is versatile and follows a structure that will cater to your requirements. All the templates prepared by Slidegeeks are easy to download and edit. Our research experts have taken care of the corporate themes as well. So, give it a try and see the results. This slide covers the KPI dashboard for ticket tracking. It includes metrics such as tickets by month, service level, and details of customer service department agents.
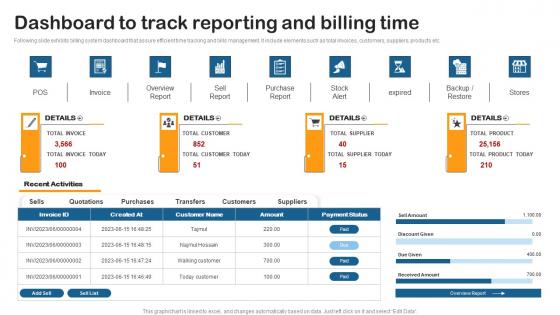
Dashboard Track Reporting Building Utility Billing And Invoicing Management System Mockup Pdf
Following slide exhibits billing system dashboard that assure efficient time tracking and bills management. It include elements such as total invoices, customers, suppliers, products etc. Whether you have daily or monthly meetings, a brilliant presentation is necessary. Dashboard Track Reporting Building Utility Billing And Invoicing Management System Mockup Pdf can be your best option for delivering a presentation. Represent everything in detail using Dashboard Track Reporting Building Utility Billing And Invoicing Management System Mockup Pdf and make yourself stand out in meetings. The template is versatile and follows a structure that will cater to your requirements. All the templates prepared by Slidegeeks are easy to download and edit. Our research experts have taken care of the corporate themes as well. So, give it a try and see the results. Following slide exhibits billing system dashboard that assure efficient time tracking and bills management. It include elements such as total invoices, customers, suppliers, products etc.
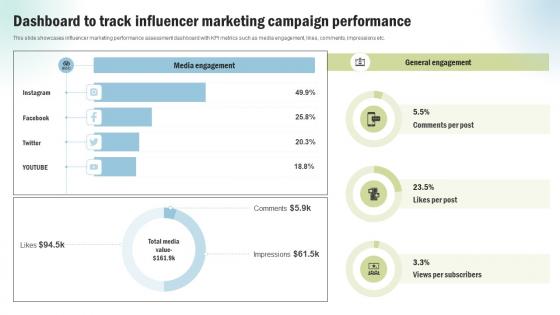
Marketing Project Performance Benchmarking Dashboard To Track Influencer Marketing CRP SS V
This slide showcases influencer marketing performance assessment dashboard with KPI metrics such as media engagement, likes, comments, impressions etc. Whether you have daily or monthly meetings, a brilliant presentation is necessary. Marketing Project Performance Benchmarking Dashboard To Track Influencer Marketing CRP SS V can be your best option for delivering a presentation. Represent everything in detail using Marketing Project Performance Benchmarking Dashboard To Track Influencer Marketing CRP SS V and make yourself stand out in meetings. The template is versatile and follows a structure that will cater to your requirements. All the templates prepared by Slidegeeks are easy to download and edit. Our research experts have taken care of the corporate themes as well. So, give it a try and see the results. This slide showcases influencer marketing performance assessment dashboard with KPI metrics such as media engagement, likes, comments, impressions etc.

Load Testing Performance Monitoring Dashboard Stress Testing For Robust Ppt Template
The purpose of this slide is to highlight the components in the load testing performance monitoring dashboard such as load size, hit time, log message, failed rounds, throughput, etc. Whether you have daily or monthly meetings, a brilliant presentation is necessary. Load Testing Performance Monitoring Dashboard Stress Testing For Robust Ppt Template can be your best option for delivering a presentation. Represent everything in detail using Load Testing Performance Monitoring Dashboard Stress Testing For Robust Ppt Template and make yourself stand out in meetings. The template is versatile and follows a structure that will cater to your requirements. All the templates prepared by Slidegeeks are easy to download and edit. Our research experts have taken care of the corporate themes as well. So, give it a try and see the results. The purpose of this slide is to highlight the components in the load testing performance monitoring dashboard such as load size, hit time, log message, failed rounds, throughput, etc.
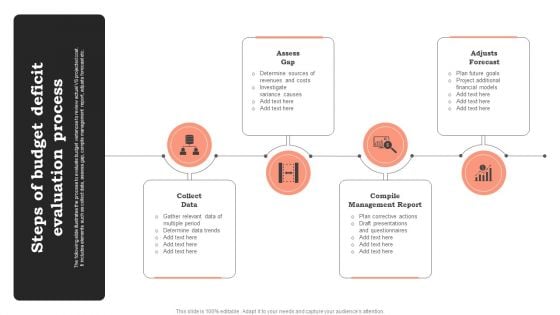
Steps Of Budget Deficit Evaluation Process Diagrams PDF
The following slide illustrates the process to evaluate budget variances to review actual VS projected cost. It includes elements such as collect data, assess gap, compile management report, adjusts forecast etc. Persuade your audience using this Steps Of Budget Deficit Evaluation Process Diagrams PDF. This PPT design covers Three stages, thus making it a great tool to use. It also caters to a variety of topics including Budget Deficit, Evaluation Process. Download this PPT design now to present a convincing pitch that not only emphasizes the topic but also showcases your presentation skills.
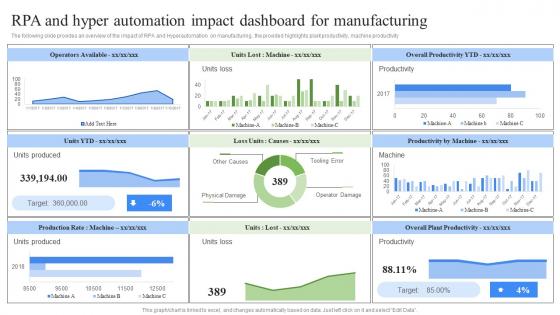
RPA And Hyper Automation Impact Dashboard RPA Influence On Industries Ideas Pdf
The following slide provides an overview of the impact of RPA and Hyperautomation on manufacturing , the provided highlights plant productivity, machine productivity. Retrieve professionally designed RPA And Hyper Automation Impact Dashboard RPA Influence On Industries Ideas Pdf to effectively convey your message and captivate your listeners. Save time by selecting pre-made slideshows that are appropriate for various topics, from business to educational purposes. These themes come in many different styles, from creative to corporate, and all of them are easily adjustable and can be edited quickly. Access them as PowerPoint templates or as Google Slides themes. You do not have to go on a hunt for the perfect presentation because Slidegeeks got you covered from everywhere. The following slide provides an overview of the impact of RPA and Hyperautomation on manufacturing , the provided highlights plant productivity, machine productivity.
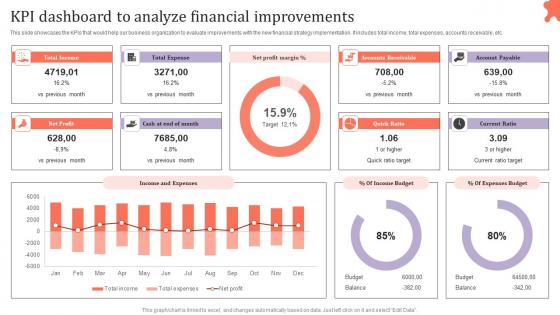
KPI Dashboard To Analyze Financial Assessing Corporate Financial Techniques Clipart Pdf
This slide showcases the KPIs that would help our business organization to evaluate improvements with the new financial strategy implementation. It includes total income, total expenses, accounts receivable, etc. Retrieve professionally designed KPI Dashboard To Analyze Financial Assessing Corporate Financial Techniques Clipart Pdf to effectively convey your message and captivate your listeners. Save time by selecting pre made slideshows that are appropriate for various topics, from business to educational purposes. These themes come in many different styles, from creative to corporate, and all of them are easily adjustable and can be edited quickly. Access them as PowerPoint templates or as Google Slides themes. You do not have to go on a hunt for the perfect presentation because Slidegeeks got you covered from everywhere. This slide showcases the KPIs that would help our business organization to evaluate improvements with the new financial strategy implementation. It includes total income, total expenses, accounts receivable, etc.
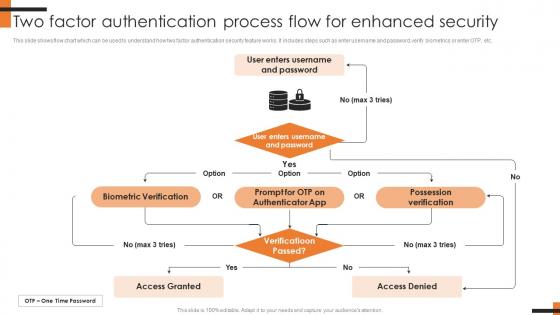
Two Factor Authentication Process Flow For Comprehensive Smartphone Banking Diagrams Pdf
This slide shows flow chart which can be used to understand how two factor authentication security feature works. It includes steps such as enter username and password, verify biometrics or enter OTP, etc. The Two Factor Authentication Process Flow For Comprehensive Smartphone Banking Diagrams Pdf is a compilation of the most recent design trends as a series of slides. It is suitable for any subject or industry presentation, containing attractive visuals and photo spots for businesses to clearly express their messages. This template contains a variety of slides for the user to input data, such as structures to contrast two elements, bullet points, and slides for written information. Slidegeeks is prepared to create an impression. This slide shows flow chart which can be used to understand how two factor authentication security feature works. It includes steps such as enter username and password, verify biometrics or enter OTP, etc.
Referral Program Partners Performance Tracking Dashboard Word Of Mouth Marketing Pictures Pdf
This slide covers dashboard to track effectiveness of partners in referral program along revenue generation. It include elements such as total partners, patner employees, referrals received, revenue earned, etc.Do you know about Slidesgeeks Referral Program Partners Performance Tracking Dashboard Word Of Mouth Marketing Pictures Pdf These are perfect for delivering any kind od presentation. Using it, create PowerPoint presentations that communicate your ideas and engage audiences. Save time and effort by using our pre-designed presentation templates that are perfect for a wide range of topic. Our vast selection of designs covers a range of styles, from creative to business, and are all highly customizable and easy to edit. Download as a PowerPoint template or use them as Google Slides themes. This slide covers dashboard to track effectiveness of partners in referral program along revenue generation. It include elements such as total partners, patner employees, referrals received, revenue earned, etc.
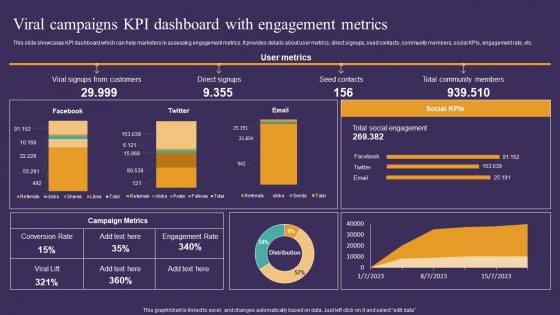
Strategic Guide To Attract Viral Campaigns KPI Dashboard With Engagement Metrics Summary Pdf
This slide showcases KPI dashboard which can help marketers in assessing engagement metrics. It provides details about user metrics, direct signups, seed contacts, community members, social KPIs, engagement rate, etc. Do you know about Slidesgeeks Strategic Guide To Attract Viral Campaigns KPI Dashboard With Engagement Metrics Summary Pdf These are perfect for delivering any kind od presentation. Using it, create PowerPoint presentations that communicate your ideas and engage audiences. Save time and effort by using our pre-designed presentation templates that are perfect for a wide range of topic. Our vast selection of designs covers a range of styles, from creative to business, and are all highly customizable and easy to edit. Download as a PowerPoint template or use them as Google Slides themes. This slide showcases KPI dashboard which can help marketers in assessing engagement metrics. It provides details about user metrics, direct signups, seed contacts, community members, social KPIs, engagement rate, etc.
Dashboard For Tracking Sales By Various Sales Techniques For Achieving Summary Pdf
This slide covers the KPI dashboard for tracking sales by different categories such as product, region, channel, inventory outstanding, sales growth, actual and target sales, etc. Whether you have daily or monthly meetings, a brilliant presentation is necessary. Dashboard For Tracking Sales By Various Sales Techniques For Achieving Summary Pdf can be your best option for delivering a presentation. Represent everything in detail usingDashboard For Tracking Sales By Various Sales Techniques For Achieving Summary Pdf and make yourself stand out in meetings. The template is versatile and follows a structure that will cater to your requirements. All the templates prepared by Slidegeeks are easy to download and edit. Our research experts have taken care of the corporate themes as well. So, give it a try and see the results. This slide covers the KPI dashboard for tracking sales by different categories such as product, region, channel, inventory outstanding, sales growth, actual and target sales, etc.
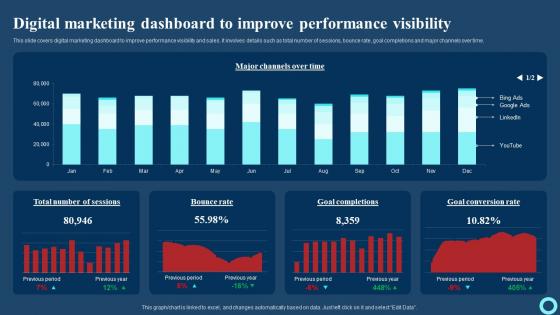
Digital Marketing Dashboard To Improve Performance Effective Strategies To Enhance Background Pdf
This slide covers digital marketing dashboard to improve performance visibility and sales. It involves details such as total number of sessions, bounce rate, goal completions and major channels over time. Do you know about Slidesgeeks Digital Marketing Dashboard To Improve Performance Effective Strategies To Enhance Background Pdf These are perfect for delivering any kind od presentation. Using it, create PowerPoint presentations that communicate your ideas and engage audiences. Save time and effort by using our pre-designed presentation templates that are perfect for a wide range of topic. Our vast selection of designs covers a range of styles, from creative to business, and are all highly customizable and easy to edit. Download as a PowerPoint template or use them as Google Slides themes. This slide covers digital marketing dashboard to improve performance visibility and sales. It involves details such as total number of sessions, bounce rate, goal completions and major channels over time.
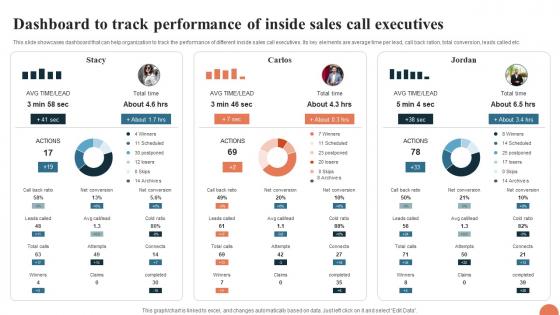
Telesales Strategy For Targeting Large Dashboard To Track Performance Of Inside Sales Strategy SS V
This slide showcases dashboard that can help organization to track the performance of different inside sales call executives. Its key elements are average time per lead, call back ration, total conversion, leads called etc. Retrieve professionally designed Telesales Strategy For Targeting Large Dashboard To Track Performance Of Inside Sales Strategy SS V to effectively convey your message and captivate your listeners. Save time by selecting pre-made slideshows that are appropriate for various topics, from business to educational purposes. These themes come in many different styles, from creative to corporate, and all of them are easily adjustable and can be edited quickly. Access them as PowerPoint templates or as Google Slides themes. You do not have to go on a hunt for the perfect presentation because Slidegeeks got you covered from everywhere. This slide showcases dashboard that can help organization to track the performance of different inside sales call executives. Its key elements are average time per lead, call back ration, total conversion, leads called etc.

Continuous Strategies For Regular Improvement For Software Testing Process Diagrams PDF
The mentioned slide represents strategy for software testing process as it comprises the part of software development cycle. It also includes framing plans and stating strategies, identifying of test data, structuring analysis, automatic testing etc. Presenting Continuous Strategies For Regular Improvement For Software Testing Process Diagrams PDF to dispense important information. This template comprises six stages. It also presents valuable insights into the topics including Structure Analysis, Automatic Testing, Strong Communication Between Teams. This is a completely customizable PowerPoint theme that can be put to use immediately. So, download it and address the topic impactfully.
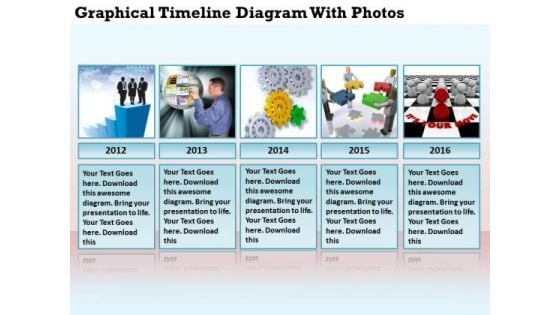
Business Charts Graphical Timeline Diagram With Photos PowerPoint Slides
We present our business charts graphical timeline diagram with photos PowerPoint Slides.Use our Spheres PowerPoint Templates because Our PowerPoint Templates and Slides will let you Hit the target. Go the full distance with ease and elan. Download and present our Business PowerPoint Templates because Our PowerPoint Templates and Slides will embellish your thoughts. See them provide the desired motivation to your team. Download and present our Marketing PowerPoint Templates because Our PowerPoint Templates and Slides will let you meet your Deadlines. Download our Flow Charts PowerPoint Templates because Our PowerPoint Templates and Slides will bullet point your ideas. See them fall into place one by one. Present our Future PowerPoint Templates because Our PowerPoint Templates and Slides will definately Enhance the stature of your presentation. Adorn the beauty of your thoughts with their colourful backgrounds.Use these PowerPoint slides for presentations relating to Agenda, agendum, arrow, art, bar, board, business, button, calendar, chart, data,design, developments, diagram, economics, elements, graph, graphics, growth,icon, illustration, infochart, infographic, infomation, information, life, meeting,modern, month, number, organizer, pointer, presentation, proceedings,report, set, sign, statistic, structure, symbol, tag, time, timeframe, timeline, vector, visualization. The prominent colors used in the PowerPoint template are Blue light, Gray, White. Concentrate on the assignment with our Business Charts Graphical Timeline Diagram With Photos PowerPoint Slides. Don't give a fig about other issues.
Ppt Four Interconnected Stock Exchange Text Circles PowerPoint Templates
PPT four interconnected stock exchange text circles PowerPoint Templates-Use this graphical approach to represent global business issues such as financial data, stock market Exchange, increase in sales, corporate presentations and more. It Signifies common, comprehensive, extensive, global, international, multinational, omnipresent, planetary, ubiquitous, universal etc.-PPT four interconnected stock exchange text circles PowerPoint Templates-Analysis, Arrow, Background, Backlink, Circle, Code, Content, Diagram, Engine, Illustration, Keyword, Optimization, Offpage, Process, Search, Template, Tracking, Unpage, Violet, Visitor, Become the crowd favourite with our Ppt Four Interconnected Stock Exchange Text Circles PowerPoint Templates. Get them all clamouring for you.
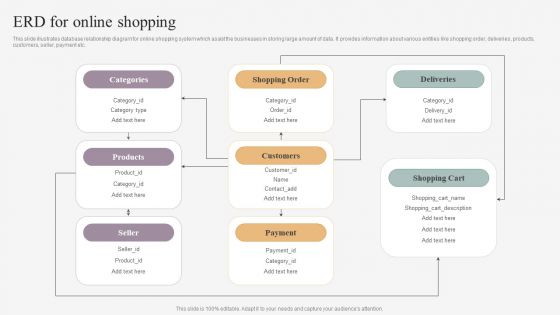
ERD For Online Shopping Mockup PDF
This slide illustrates database relationship diagram for online shopping system which assist the businesses in storing large amount of data. It provides information about various entities like shopping order, deliveries, products, customers, seller, payment etc. Showcasing this set of slides titled ERD For Online Shopping Mockup PDF. The topics addressed in these templates are Categories, Shopping Order, Products, Customers. All the content presented in this PPT design is completely editable. Download it and make adjustments in color, background, font etc. as per your unique business setting.
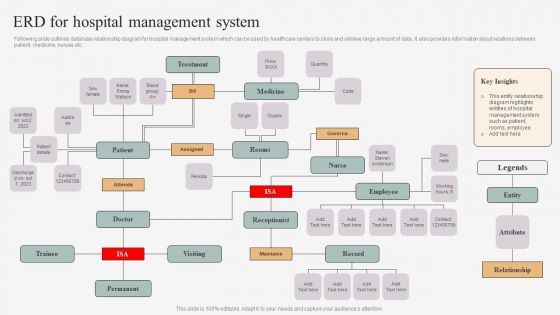
ERD For Hospital Management System Graphics PDF
Following slide outlines database relationship diagram for hospital management system which can be used by healthcare centers to store and retrieve large amount of data. It also provides information about relations between patient, medicine, nurses etc. Pitch your topic with ease and precision using this ERD For Hospital Management System Graphics PDF. This layout presents information on Patient, Treatment, Medicine. It is also available for immediate download and adjustment. So, changes can be made in the color, design, graphics or any other component to create a unique layout.
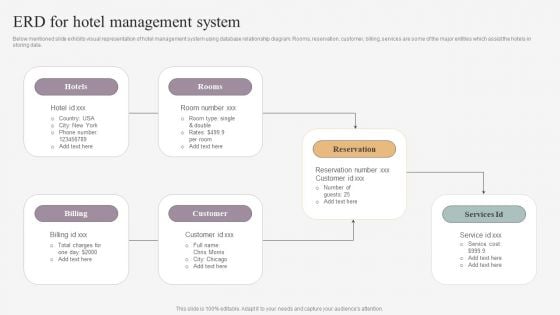
ERD For Hotel Management System Introduction PDF
Below mentioned slide exhibits visual representation of hotel management system using database relationship diagram. Rooms, reservation, customer, billing, services are some of the major entities which assist the hotels in storing data. Showcasing this set of slides titled ERD For Hotel Management System Introduction PDF. The topics addressed in these templates are Hotels, Rooms, Reservation, Billing, Customer. All the content presented in this PPT design is completely editable. Download it and make adjustments in color, background, font etc. as per your unique business setting.
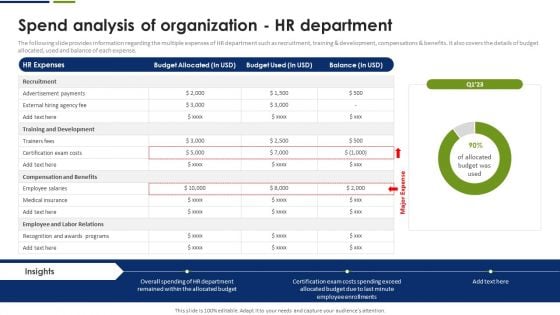
Spend Analysis Of Organization HR Department Information PDF
The following slide provides information regarding the multiple expenses of HR department such as recruitment, training and development, compensations and benefits. It also covers the details of budget allocated, used and balance of each expense. The Spend Analysis Of Organization HR Department Information PDF is a compilation of the most recent design trends as a series of slides. It is suitable for any subject or industry presentation, containing attractive visuals and photo spots for businesses to clearly express their messages. This template contains a variety of slides for the user to input data, such as structures to contrast two elements, bullet points, and slides for written information. Slidegeeks is prepared to create an impression.
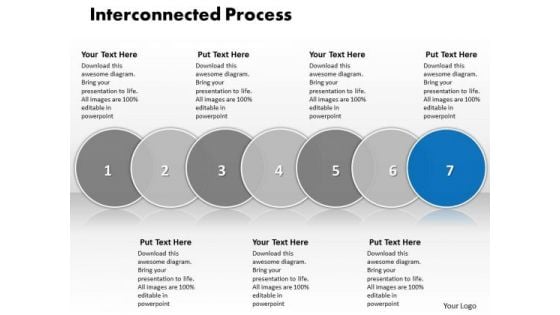
Ppt Interconnected Seven Stages Of Writing Process PowerPoint Presentation Templates
PPT interconnected seven stages of writing process powerpoint presentation Templates-This diagram is a graphical illustration of the relationships between and among sets of data, groups of objects that share something in common. This diagram is made up of overlapping circles that show all possible logical relations. Deliver amazing presentations to mesmerize your audience.-PPT interconnected seven stages of writing process powerpoint presentation Templates-3, Advice, Analysis, Analyze, Answer, Area, Career, Chart, Choice, Circles, Concept, Determination, Diagram, Graph, Idea, Illustration, Intersect, Measurement, Opportunities, Options, Overlap, Overlapped, Overlapping, Passion, Passionate, Prioritize, Priority, Profession Target your audience with our Ppt Interconnected Seven Stages Of Writing Process PowerPoint Presentation Templates. Download without worries with our money back guaranteee.
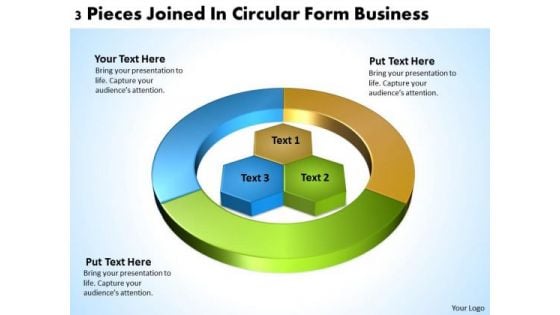
Joined Circular Form Business PowerPoint Theme Plans Software Slides
We present our joined circular form business powerpoint theme plans software Slides.Download our Hexagon PowerPoint Templates because They will Put the wind in your sails. Skim smoothly over the choppy waters of the market. Download and present our Circle Charts PowerPoint Templates because You can Zap them with our PowerPoint Templates and Slides. See them reel under the impact. Download and present our Circle Charts PowerPoint Templates because It will get your audience in sync. Download and present our Ring Charts PowerPoint Templates because You have gained great respect for your brilliant ideas. Use our PowerPoint Templates and Slides to strengthen and enhance your reputation. Download and present our Shapes PowerPoint Templates because Our PowerPoint Templates and Slides are designed to help you succeed. They have all the ingredients you need.Use these PowerPoint slides for presentations relating to process, diagram, business, project, arrow, flow, icon, chart, art, market, isolated, statistics, percent, economy, white, blank, concept, value, circle, graphic, data, element, report, management, graph, wheel, cycle, design, growth, profit, information, background, financial, adding. The prominent colors used in the PowerPoint template are Yellow, Blue, Green. Demonstrate your work ethic with our Joined Circular Form Business PowerPoint Theme Plans Software Slides. Give credence to your impeccable reputation.
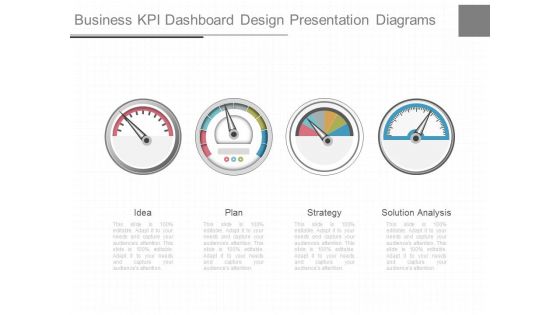
Business Kpi Dashboard Design Presentation Diagrams
This is a business kpi dashboard design presentation diagrams. This is a four stage process. The stages in this process are idea, plan, strategy, solution analysis.
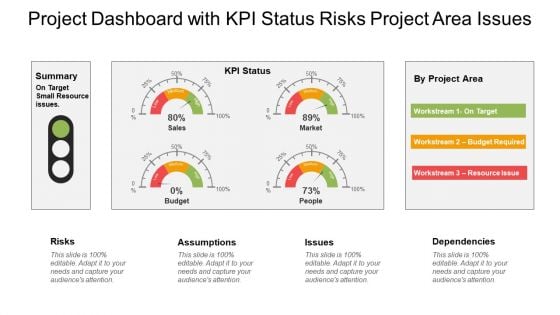
Project Summary Dashboard With Kpi Status Ppt PowerPoint Presentation Slides Show
This is a project summary dashboard with kpi status ppt powerpoint presentation slides show. This is a three stage process. The stages in this process are project analysis, project review, project performance management.
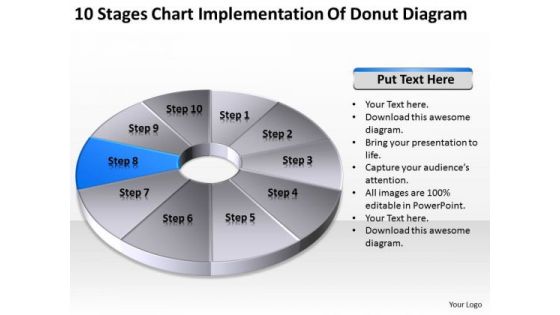
10 Stages Chart Implementation Of Donut Diagram Ppt Making Business Plan PowerPoint Template
We present our 10 stages chart implementation of donut diagram ppt making business plan PowerPoint template.Download our Circle Charts PowerPoint Templates because You should Kick up a storm with our PowerPoint Templates and Slides. The heads of your listeners will swirl with your ideas. Download our Marketing PowerPoint Templates because Our PowerPoint Templates and Slides are topically designed to provide an attractive backdrop to any subject. Present our Signs PowerPoint Templates because Our PowerPoint Templates and Slides provide you with a vast range of viable options. Select the appropriate ones and just fill in your text. Download and present our Finance PowerPoint Templates because It will mark the footprints of your journey. Illustrate how they will lead you to your desired destination. Download our Business PowerPoint Templates because our PowerPoint Templates and Slides will give your ideas the shape.Use these PowerPoint slides for presentations relating to chart, pie, graph, vector, 3d, icon, diagram, progress, business, circular, design, information, market, opinion, corporate, sign, symbol, shadow, percentage, graphic, finance, data, element, drawing, report, marketing, shape, illustration, earnings, number, strategy, money, dimensional, survey, growth, colorful, global, account, part, investment, statistic, financial, results, portion. The prominent colors used in the PowerPoint template are Blue, Gray, Black. Counsel teams with our 10 Stages Chart Implementation Of Donut Diagram Ppt Making Business Plan PowerPoint Template. Download without worries with our money back guaranteee.
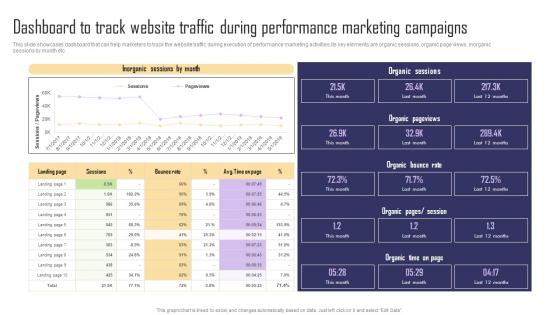
Dashboard To Track Website Traffic During Performance Paid Internet Marketing Strategy Guidelines Pdf
This slide showcases dashboard that can help marketers to track the website traffic during execution of performance marketing activities.Its key elements are organic sessions, organic page views, inorganic sessions by month etc. Whether you have daily or monthly meetings, a brilliant presentation is necessary. Dashboard To Track Website Traffic During Performance Paid Internet Marketing Strategy Guidelines Pdf can be your best option for delivering a presentation. Represent everything in detail using Dashboard To Track Website Traffic During Performance Paid Internet Marketing Strategy Guidelines Pdf and make yourself stand out in meetings. The template is versatile and follows a structure that will cater to your requirements. All the templates prepared by Slidegeeks are easy to download and edit. Our research experts have taken care of the corporate themes as well. So, give it a try and see the results. This slide showcases dashboard that can help marketers to track the website traffic during execution of performance marketing activities.Its key elements are organic sessions, organic page views, inorganic sessions by month etc.
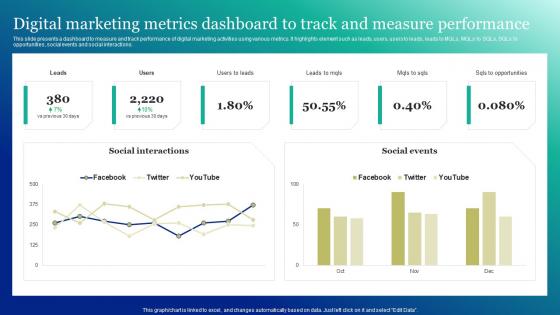
Digital Marketing Metrics Dashboard To Marketing And Promotion Automation Infographics Pdf
This slide presents a dashboard to measure and track performance of digital marketing activities using various metrics. It highlights element such as leads, users, users to leads, leads to MQLs, MQLs to SQLs, SQLs to opportunities, social events and social interactions.Whether you have daily or monthly meetings, a brilliant presentation is necessary. Digital Marketing Metrics Dashboard To Marketing And Promotion Automation Infographics Pdf can be your best option for delivering a presentation. Represent everything in detail using Digital Marketing Metrics Dashboard To Marketing And Promotion Automation Infographics Pdf and make yourself stand out in meetings. The template is versatile and follows a structure that will cater to your requirements. All the templates prepared by Slidegeeks are easy to download and edit. Our research experts have taken care of the corporate themes as well. So, give it a try and see the results. This slide presents a dashboard to measure and track performance of digital marketing activities using various metrics. It highlights element such as leads, users, users to leads, leads to MQLs, MQLs to SQLs, SQLs to opportunities, social events and social interactions.
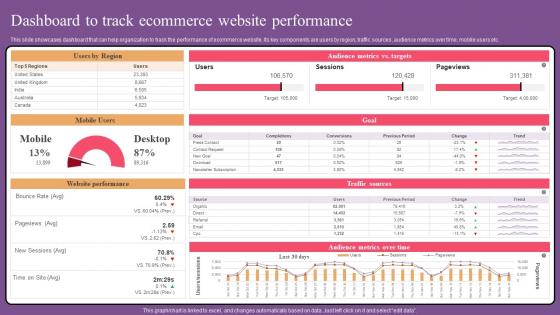
Dashboard To Track Ecommerce Website Optimization To Improve Product Sale Elements Pdf
This slide showcases dashboard that can help organization to track the performance of ecommerce website. Its key components are users by region, traffic sources, audience metrics over time, mobile users etc. Whether you have daily or monthly meetings, a brilliant presentation is necessary. Dashboard To Track Ecommerce Website Optimization To Improve Product Sale Elements Pdf can be your best option for delivering a presentation. Represent everything in detail using Dashboard To Track Ecommerce Website Optimization To Improve Product Sale Elements Pdf and make yourself stand out in meetings. The template is versatile and follows a structure that will cater to your requirements. All the templates prepared by Slidegeeks are easy to download and edit. Our research experts have taken care of the corporate themes as well. So, give it a try and see the results. This slide showcases dashboard that can help organization to track the performance of ecommerce website. Its key components are users by region, traffic sources, audience metrics over time, mobile users etc.
Dashboard For Tracking Referral Techniques For Generating Brand Awareness Sample Pdf
This slide covers the KPI dashboard for brands to evaluate the performance of referral marketing campaigns. It includes metrics such as referral participation rate, referred customers, referral conversion rate, total revenue generated, etc Whether you have daily or monthly meetings, a brilliant presentation is necessary. Dashboard For Tracking Referral Techniques For Generating Brand Awareness Sample Pdf can be your best option for delivering a presentation. Represent everything in detail using Dashboard For Tracking Referral Techniques For Generating Brand Awareness Sample Pdf and make yourself stand out in meetings. The template is versatile and follows a structure that will cater to your requirements. All the templates prepared by Slidegeeks are easy to download and edit. Our research experts have taken care of the corporate themes as well. So, give it a try and see the results. This slide covers the KPI dashboard for brands to evaluate the performance of referral marketing campaigns. It includes metrics such as referral participation rate, referred customers, referral conversion rate, total revenue generated, etc.
Dashboard For Tracking Referral Marketing Tracking Word Mouth Marketing Slides PDF
This slide covers the KPI dashboard for brands to evaluate the performance of referral marketing campaigns. It includes metrics such as referral participation rate, referred customers, referral conversion rate, total revenue generated, etc. Whether you have daily or monthly meetings, a brilliant presentation is necessary. Dashboard For Tracking Referral Marketing Tracking Word Mouth Marketing Slides PDF can be your best option for delivering a presentation. Represent everything in detail using Dashboard For Tracking Referral Marketing Tracking Word Mouth Marketing Slides PDF and make yourself stand out in meetings. The template is versatile and follows a structure that will cater to your requirements. All the templates prepared by Slidegeeks are easy to download and edit. Our research experts have taken care of the corporate themes as well. So, give it a try and see the results. This slide covers the KPI dashboard for brands to evaluate the performance of referral marketing campaigns. It includes metrics such as referral participation rate, referred customers, referral conversion rate, total revenue generated, etc.
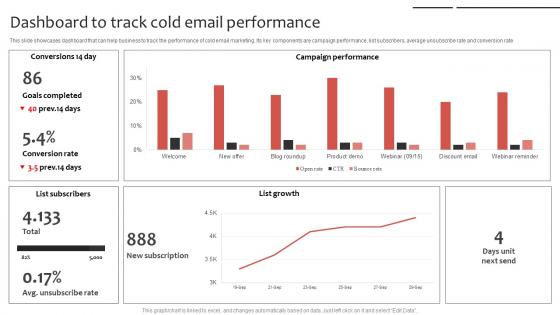
Phone Sales Strategy To Drive Dashboard To Track Cold Email Performance Strategy SS V
This slide showcases dashboard that can help business to track the performance of cold email marketing. Its key components are campaign performance, list subscribers, average unsubscribe rate and conversion rate. Whether you have daily or monthly meetings, a brilliant presentation is necessary. Phone Sales Strategy To Drive Dashboard To Track Cold Email Performance Strategy SS V can be your best option for delivering a presentation. Represent everything in detail using Phone Sales Strategy To Drive Dashboard To Track Cold Email Performance Strategy SS V and make yourself stand out in meetings. The template is versatile and follows a structure that will cater to your requirements. All the templates prepared by Slidegeeks are easy to download and edit. Our research experts have taken care of the corporate themes as well. So, give it a try and see the results. This slide showcases dashboard that can help business to track the performance of cold email marketing. Its key components are campaign performance, list subscribers, average unsubscribe rate and conversion rate
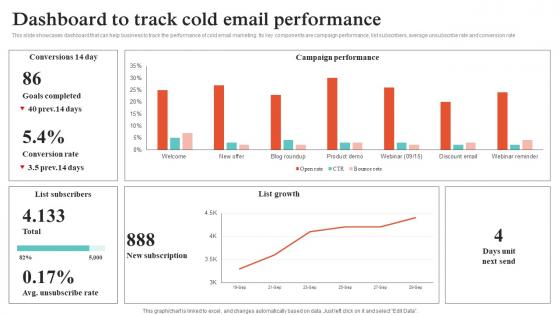
Virtual Sales Strategies Dashboard To Track Cold Email Performance Strategy SS V
This slide showcases dashboard that can help business to track the performance of cold email marketing. Its key components are campaign performance, list subscribers, average unsubscribe rate and conversion rate. Whether you have daily or monthly meetings, a brilliant presentation is necessary. Virtual Sales Strategies Dashboard To Track Cold Email Performance Strategy SS V can be your best option for delivering a presentation. Represent everything in detail using Virtual Sales Strategies Dashboard To Track Cold Email Performance Strategy SS V and make yourself stand out in meetings. The template is versatile and follows a structure that will cater to your requirements. All the templates prepared by Slidegeeks are easy to download and edit. Our research experts have taken care of the corporate themes as well. So, give it a try and see the results. This slide showcases dashboard that can help business to track the performance of cold email marketing. Its key components are campaign performance, list subscribers, average unsubscribe rate and conversion rate.
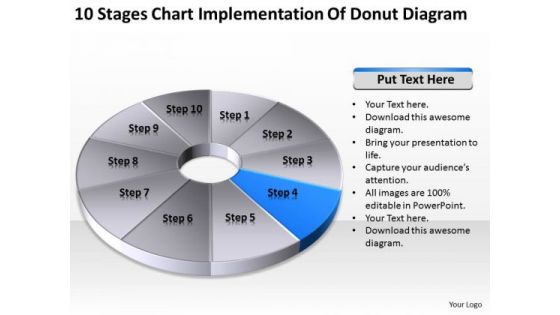
10 Stages Chart Implementation Of Donut Diagram Business Plan PowerPoint Slides
We present our 10 stages chart implementation of donut diagram business plan PowerPoint Slides.Download and present our Circle Charts PowerPoint Templates because It will get your audience in sync. Present our Marketing PowerPoint Templates because Our PowerPoint Templates and Slides will generate and maintain the level of interest you desire. They will create the impression you want to imprint on your audience. Download and present our Signs PowerPoint Templates because You can Zap them with our PowerPoint Templates and Slides. See them reel under the impact. Use our Finance PowerPoint Templates because Our PowerPoint Templates and Slides will embellish your thoughts. See them provide the desired motivation to your team. Present our Business PowerPoint Templates because You will get more than you ever bargained for. Use these PowerPoint slides for presentations relating to chart, pie, graph, vector, 3d, icon, diagram, progress, business, circular, design, information, market, opinion, corporate, sign, symbol, shadow, percentage, graphic, finance, data, element, drawing, report, marketing, shape, illustration, earnings, number, strategy, money, dimensional, survey, growth, colorful, global, account, part, investment, statistic, financial, results, portion. The prominent colors used in the PowerPoint template are Blue, Gray, Black. Get a firm handle on your discussion with our 10 Stages Chart Implementation Of Donut Diagram Business Plan PowerPoint Slides. Try us out and see what a difference our templates make.
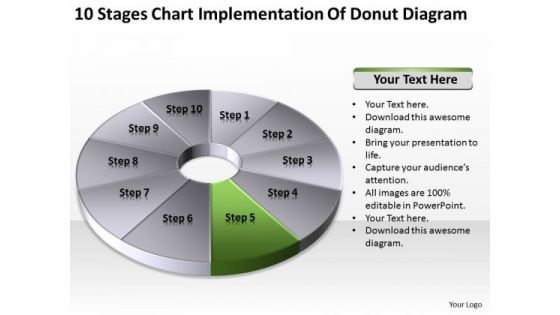
10 Stages Chart Implementation Of Donut Diagram Ppt Business Plan PowerPoint Slides
We present our 10 stages chart implementation of donut diagram ppt business plan PowerPoint Slides.Download our Circle Charts PowerPoint Templates because Our PowerPoint Templates and Slides come in all colours, shades and hues. They help highlight every nuance of your views. Download our Marketing PowerPoint Templates because Our PowerPoint Templates and Slides are like the strings of a tennis racquet. Well strung to help you serve aces. Use our Signs PowerPoint Templates because Our PowerPoint Templates and Slides are designed to help you succeed. They have all the ingredients you need. Present our Finance PowerPoint Templates because Our PowerPoint Templates and Slides will let you Hit the right notes. Watch your audience start singing to your tune. Download our Business PowerPoint Templates because These PowerPoint Templates and Slides will give the updraft to your ideas. See them soar to great heights with ease.Use these PowerPoint slides for presentations relating to chart, pie, graph, vector, 3d, icon, diagram, progress, business, circular, design, information, market, opinion, corporate, sign, symbol, shadow, percentage, graphic, finance, data, element, drawing, report, marketing, shape, illustration, earnings, number, strategy, money, dimensional, survey, growth, colorful, global, account, part, investment, statistic, financial, results, portion. The prominent colors used in the PowerPoint template are Green, Gray, Black. Embolden them with your thoughts. Our 10 Stages Chart Implementation Of Donut Diagram Ppt Business Plan PowerPoint Slides will get them all animated.
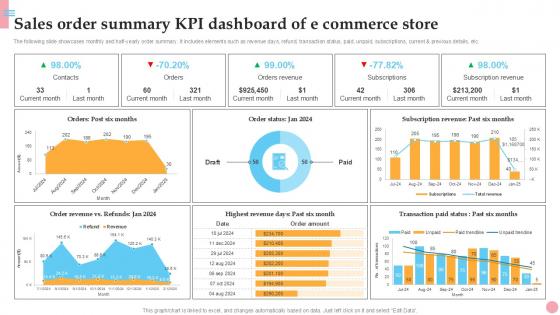
Sales Order Summary KPI Dashboard How To Improve Company PPT Sample Strategy SS V
The following slide showcases monthly and half-yearly order summary. It includes elements such as revenue days, refund, transaction status, paid, unpaid, subscriptions, current and previous details, etc. Do you know about Slidesgeeks Sales Order Summary KPI Dashboard How To Improve Company PPT Sample Strategy SS V These are perfect for delivering any kind od presentation. Using it, create PowerPoint presentations that communicate your ideas and engage audiences. Save time and effort by using our pre-designed presentation templates that are perfect for a wide range of topic. Our vast selection of designs covers a range of styles, from creative to business, and are all highly customizable and easy to edit. Download as a PowerPoint template or use them as Google Slides themes. The following slide showcases monthly and half-yearly order summary. It includes elements such as revenue days, refund, transaction status, paid, unpaid, subscriptions, current and previous details, etc.
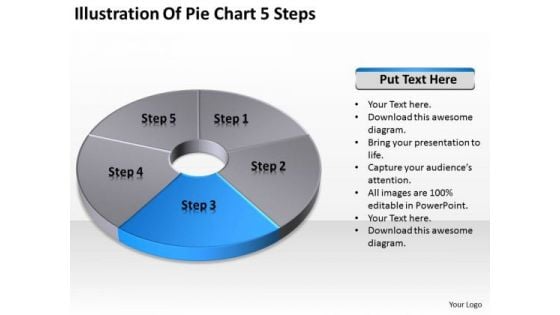
Illustration Of Pie Chart 5 Step How To Write Business Plans PowerPoint Templates
We present our illustration of pie chart 5 step how to write business plans PowerPoint templates.Present our Circle Charts PowerPoint Templates because You aspire to touch the sky with glory. Let our PowerPoint Templates and Slides provide the fuel for your ascent. Present our Shapes PowerPoint Templates because Our PowerPoint Templates and Slides have the Brilliant backdrops. Guaranteed to illuminate the minds of your audience. Present our Success PowerPoint Templates because You can Be the star of the show with our PowerPoint Templates and Slides. Rock the stage with your ideas. Download our Business PowerPoint Templates because Timeline crunches are a fact of life. Meet all deadlines using our PowerPoint Templates and Slides. Download our Process and Flows PowerPoint Templates because You should Press the right buttons with our PowerPoint Templates and Slides. They will take your ideas down the perfect channel.Use these PowerPoint slides for presentations relating to pie, chart, market, statistics, sales, slice, economy, display, corporate, business, concept, render, success, presentation, diagram, percentage, graphic, finance, data, bank, report, marketing, accounting, management, graph, illustration, icon, piece, strategy, money, growth, company, control, competition, progress, account, sheet, profit, part, information, investment, improvement, banking, index, financial, reflect, results, performance, exchange. The prominent colors used in the PowerPoint template are Blue, Gray, Black. Forget about ceilings with our Illustration Of Pie Chart 5 Step How To Write Business Plans PowerPoint Templates. They pitch it so high that the glass will crack.
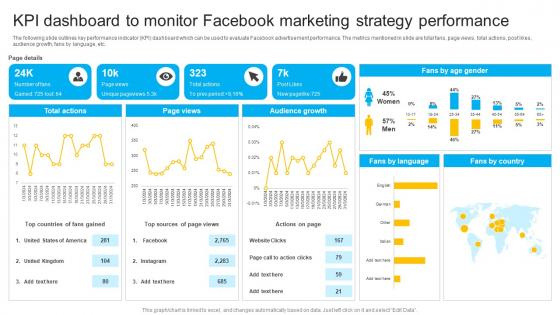
How To Create Cost Effective KPI Dashboard To Monitor Facebook Marketing Strategy SS V
The following slide outlines key performance indicator KPI dashboard which can be used to evaluate Facebook advertisement performance. The metrics mentioned in slide are total fans, page views, total actions, post likes, audience growth, fans by language, etc. Do you know about Slidesgeeks How To Create Cost Effective KPI Dashboard To Monitor Facebook Marketing Strategy SS V These are perfect for delivering any kind od presentation. Using it, create PowerPoint presentations that communicate your ideas and engage audiences. Save time and effort by using our pre-designed presentation templates that are perfect for a wide range of topic. Our vast selection of designs covers a range of styles, from creative to business, and are all highly customizable and easy to edit. Download as a PowerPoint template or use them as Google Slides themes. The following slide outlines key performance indicator KPI dashboard which can be used to evaluate Facebook advertisement performance. The metrics mentioned in slide are total fans, page views, total actions, post likes, audience growth, fans by language, etc.
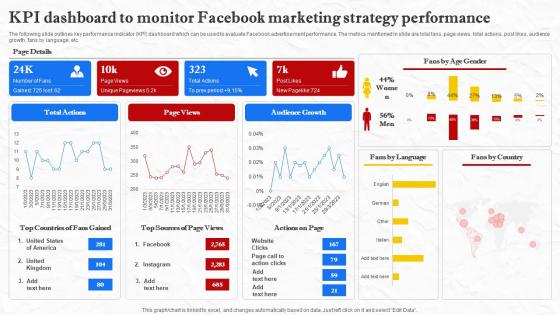
Facebook Marketing Techniques KPI Dashboard To Monitor Facebook Marketing Strategy SS V
The following slide outlines key performance indicator KPI dashboard which can be used to evaluate Facebook advertisement performance. The metrics mentioned in slide are total fans, page views, total actions, post likes, audience growth, fans by language, etc. Do you know about Slidesgeeks Facebook Marketing Techniques KPI Dashboard To Monitor Facebook Marketing Strategy SS V These are perfect for delivering any kind od presentation. Using it, create PowerPoint presentations that communicate your ideas and engage audiences. Save time and effort by using our pre-designed presentation templates that are perfect for a wide range of topic. Our vast selection of designs covers a range of styles, from creative to business, and are all highly customizable and easy to edit. Download as a PowerPoint template or use them as Google Slides themes. The following slide outlines key performance indicator KPI dashboard which can be used to evaluate Facebook advertisement performance. The metrics mentioned in slide are total fans, page views, total actions, post likes, audience growth, fans by language, etc.
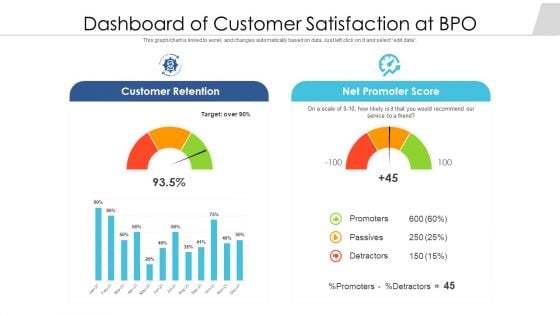
Dashboard Of Customer Satisfaction At BPO Ppt Outline Mockup PDF
Presenting dashboard of customer satisfaction at bpo ppt outline mockup pdf to dispense important information. This template comprises two stages. It also presents valuable insights into the topics including customer retention, net promoter score. This is a completely customizable PowerPoint theme that can be put to use immediately. So, download it and address the topic impactfully.
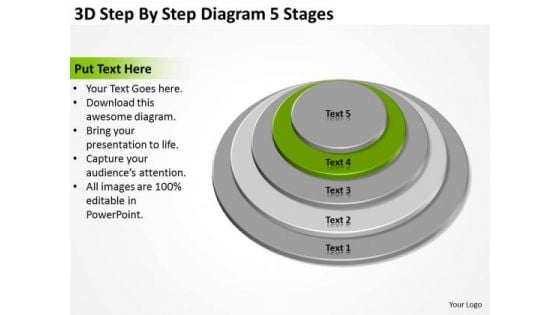
By Diagram 5 Stages How To Write Business Plan For PowerPoint Templates
We present our by diagram 5 stages how to write business plan for PowerPoint templates.Use our Process and Flows PowerPoint Templates because It will let you Set new benchmarks with our PowerPoint Templates and Slides. They will keep your prospects well above par. Download our Circle Charts PowerPoint Templates because Our PowerPoint Templates and Slides will Activate the energies of your audience. Get their creative juices flowing with your words. Present our Business PowerPoint Templates because our PowerPoint Templates and Slides are the string of your bow. Fire of your ideas and conquer the podium. Use our Flow Charts PowerPoint Templates because It will Raise the bar of your Thoughts. They are programmed to take you to the next level. Download our Shapes PowerPoint Templates because It will Strengthen your hand with your thoughts. They have all the aces you need to win the day.Use these PowerPoint slides for presentations relating to Chart, round, growth, pyramid, market, isolated, demographic, infochart, document, isometric, piechart, perspective, business, blank, concept, vector, sign,diagramchart, visual, presentation, glossy, symbol, template, diagram, circle, ring, graphic, finance, data, stock, element, report, abstract, graph, illustration, icon,economic, rating, web, infographic, design, text, organization, information, background, office, statistic, financial. The prominent colors used in the PowerPoint template are Green, White, Gray. Stand on your own feet with our By Diagram 5 Stages How To Write Business Plan For PowerPoint Templates. They will deliver all the assistance you need.
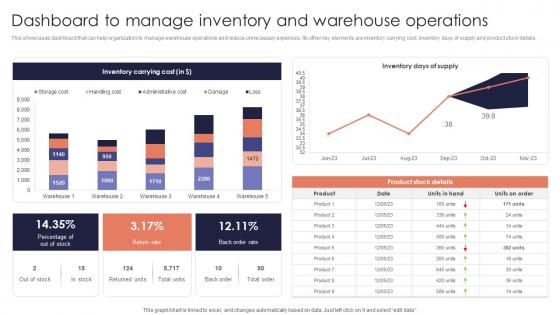
Dashboard Manage Inventory Minimizing Inventory Wastage Through Warehouse Microsoft Pdf
This showcases dashboard that can help organization to manage warehouse operations and reduce unnecessary expenses. Its other key elements are inventory carrying cost, inventory days of supply and product stock details. There are so many reasons you need a Dashboard Manage Inventory Minimizing Inventory Wastage Through Warehouse Microsoft Pdf. The first reason is you can not spend time making everything from scratch, Thus, Slidegeeks has made presentation templates for you too. You can easily download these templates from our website easily. This showcases dashboard that can help organization to manage warehouse operations and reduce unnecessary expenses. Its other key elements are inventory carrying cost, inventory days of supply and product stock details.
A136 Vendor Management Audit KPI Dashboard For Tracking Supplier Compliance
Mentioned slide demonstrates KPI dashboard for evaluating supplier compliance and performance. It includes key components such as total suppliers, contracts, unlisted, contact compliance rate. Find a pre-designed and impeccable A136 Vendor Management Audit KPI Dashboard For Tracking Supplier Compliance. The templates can ace your presentation without additional effort. You can download these easy-to-edit presentation templates to make your presentation stand out from others. So, what are you waiting for Download the template from Slidegeeks today and give a unique touch to your presentation. Mentioned slide demonstrates KPI dashboard for evaluating supplier compliance and performance. It includes key components such as total suppliers, contracts, unlisted, contact compliance rate.
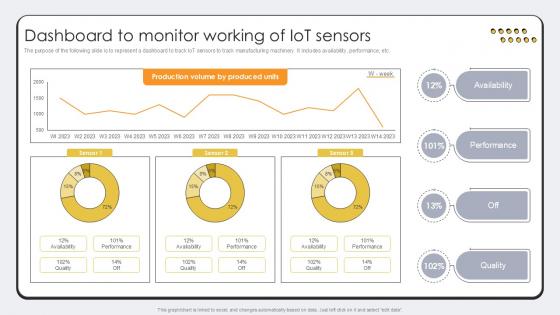
Dashboard To Monitor Working Of Revolutionizing Production IoT Ppt Presentation
The purpose of the following slide is to represent a dashboard to track IoT sensors to track manufacturing machinery. It includes availability, performance, etc. If your project calls for a presentation, then Slidegeeks is your go-to partner because we have professionally designed, easy-to-edit templates that are perfect for any presentation. After downloading, you can easily edit Dashboard To Monitor Working Of Revolutionizing Production IoT Ppt Presentation and make the changes accordingly. You can rearrange slides or fill them with different images. Check out all the handy templates The purpose of the following slide is to represent a dashboard to track IoT sensors to track manufacturing machinery. It includes availability, performance, etc.
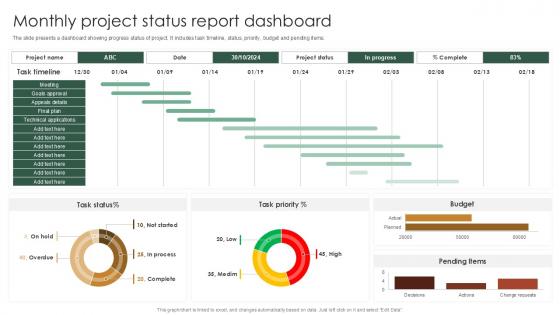
Monthly Project Status Report Dashboard PPT PowerPoint SS
The slide presents a dashboard showing progress status of project. It includes task timeline, status, priority, budget and pending items. Want to ace your presentation in front of a live audience Our Monthly Project Status Report Dashboard PPT PowerPoint SS can help you do that by engaging all the users towards you. Slidegeeks experts have put their efforts and expertise into creating these impeccable powerpoint presentations so that you can communicate your ideas clearly. Moreover, all the templates are customizable, and easy-to-edit and downloadable. Use these for both personal and commercial use. The slide presents a dashboard showing progress status of project. It includes task timeline, status, priority, budget and pending items.


 Continue with Email

 Home
Home


