Data Analytics Icons
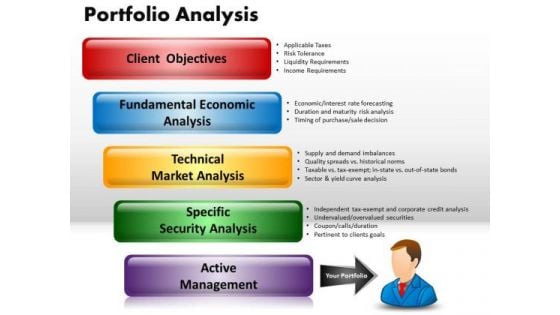
Business Arrows PowerPoint Templates Business Portfolio Analysis Ppt Slides
Business Arrows PowerPoint Templates Business Portfolio Analysis PPT Slides-This Portfolio could be aligned to a particular business unit, or could be grouped You can use it to depict your idea.-Business Arrows PowerPoint Templates Business Portfolio Analysis PPT Slides-This template can be used for presentations relating to Adult, Analysis, Blackboard, Board, Business, Businessman, Career, Cartoon, Chalkboard, Character, Chart, Clean, Concept, Data, Diagram, Display, Displaying, Drawing, Finance, Forecast, Gain, Graph, Handsome, Illustration, Loss, Man, Marketing, Meeting, Person, Predict, Present, Profession, Professional Expose the facts with our Business Arrows PowerPoint Templates Business Portfolio Analysis Ppt Slides. Get down to the actuality of it all.

Odometer Image For Kilometer And Speed Control Ppt PowerPoint Presentation Ideas Deck PDF
Presenting odometer image for kilometer and speed control ppt powerpoint presentation ideas deck pdf to dispense important information. This template comprises two stages. It also presents valuable insights into the topics including odometer image for kilometer, speed control. This is a completely customizable PowerPoint theme that can be put to use immediately. So, download it and address the topic impactfully.
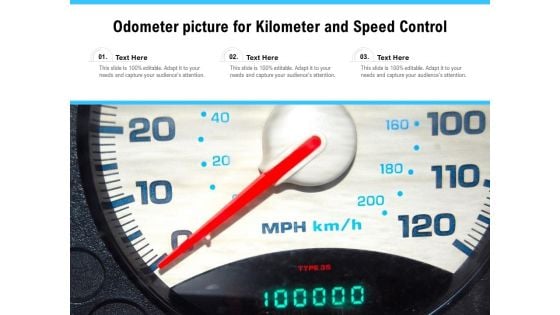
Odometer Picture For Kilometer And Speed Control Ppt PowerPoint Presentation Infographics Graphics PDF
Presenting odometer picture for kilometer and speed control ppt powerpoint presentation infographics graphics pdf to dispense important information. This template comprises three stages. It also presents valuable insights into the topics including odometer picture for kilometer and speed control. This is a completely customizable PowerPoint theme that can be put to use immediately. So, download it and address the topic impactfully.
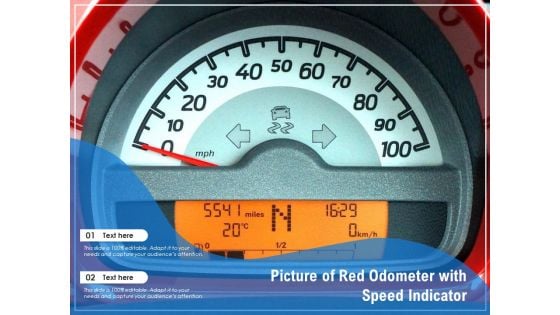
Picture Of Red Odometer With Speed Indicator Ppt PowerPoint Presentation Summary Ideas PDF
Presenting picture of red odometer with speed indicator ppt powerpoint presentation summary ideas pdf to dispense important information. This template comprises two stages. It also presents valuable insights into the topics including picture of red odometer, speed indicator. This is a completely customizable PowerPoint theme that can be put to use immediately. So, download it and address the topic impactfully.
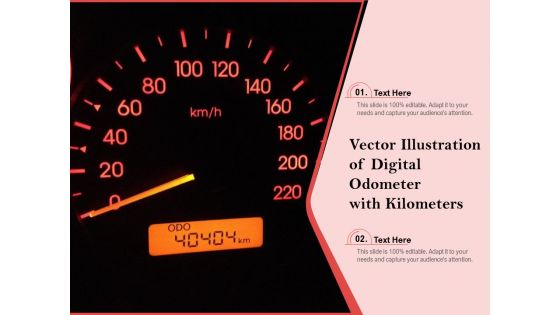
Vector Illustration Of Digital Odometer With Kilometers Ppt PowerPoint Presentation Slides Example PDF
Presenting vector illustration of digital odometer with kilometers ppt powerpoint presentation slides example pdf to dispense important information. This template comprises two stages. It also presents valuable insights into the topics including vector illustration of digital odometer with kilometer. This is a completely customizable PowerPoint theme that can be put to use immediately. So, download it and address the topic impactfully.

Weighing Scale With Client Representative At Store Ppt PowerPoint Presentation Gallery Graphic Images PDF
Presenting weighing scale with client representative at store ppt powerpoint presentation gallery graphic images pdf to dispense important information. This template comprises one stages. It also presents valuable insights into the topics including weighing scale with client representative at store. This is a completely customizable PowerPoint theme that can be put to use immediately. So, download it and address the topic impactfully.
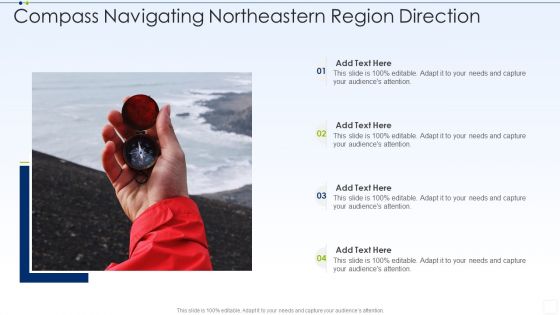
Compass Navigating Northeastern Region Direction Graphics PDF
Presenting compass navigating northeastern region direction graphics pdf to dispense important information. This template comprises four stages. It also presents valuable insights into the topics including compass navigating northeastern region direction. This is a completely customizable PowerPoint theme that can be put to use immediately. So, download it and address the topic impactfully.
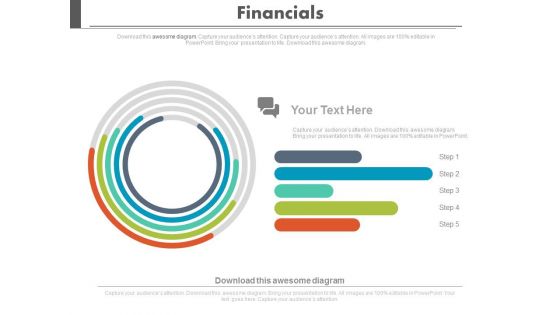
Financial Growth Analysis Circular Chart Powerpoint Slides
Visually support your presentation with our above template containing graphics of circular chart. This diagram slide helps to display financial growth analysis. Etch your views in the brains of your audience with this diagram slide.
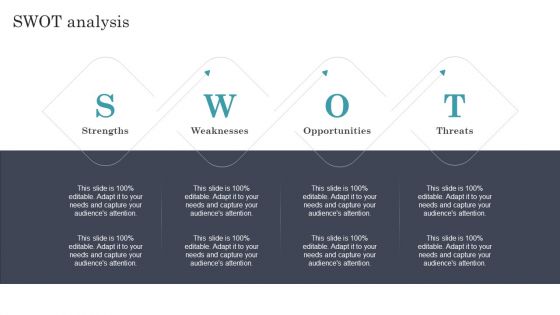
Developing Dual Branding Campaign For Brand Marketing SWOT Analysis Themes PDF
This slide showcases process that can help organization to launch dual branding campaign. Its key steps are goal definition, screening partners and negotiating the contract. The Developing Dual Branding Campaign For Brand Marketing SWOT Analysis Themes PDF is a compilation of the most recent design trends as a series of slides. It is suitable for any subject or industry presentation, containing attractive visuals and photo spots for businesses to clearly express their messages. This template contains a variety of slides for the user to input data, such as structures to contrast two elements, bullet points, and slides for written information. Slidegeeks is prepared to create an impression.
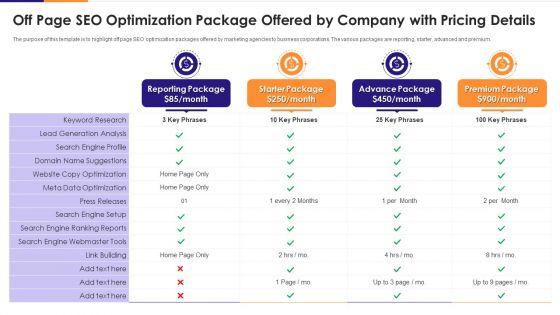
Off Page SEO Optimization Package Offered By Company With Pricing Details Themes PDF
The purpose of this template is to highlight off page SEO optimization packages offered by marketing agencies to business corporations. The various packages are reporting, starter, advanced and premium. Showcasing this set of slides titled off page seo optimization package offered by company with pricing details themes pdf. The topics addressed in these templates are optimization, analysis, data. All the content presented in this PPT design is completely editable. Download it and make adjustments in color, background, font etc. as per your unique business setting.
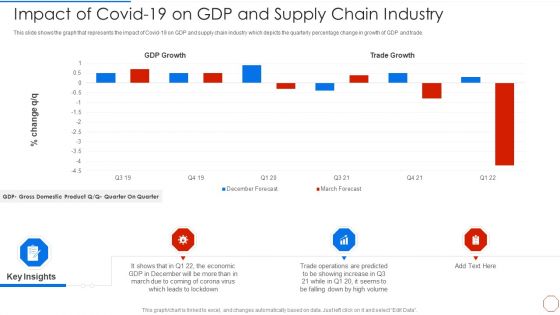
Minimizing Operational Cost Through Iot Virtual Twins Implementation Impact Of Covid 19 Infographics PDF
This slide focuses on the industrial spending on digital transformation tools which shows big data, artificial and enterprise IoT platforms with current and planned spending. Deliver and pitch your topic in the best possible manner with this minimizing operational cost through iot virtual twins implementation impact of covid 19 infographics pdf. Use them to share invaluable insights on industries, enterprise, planning, analysis and impress your audience. This template can be altered and modified as per your expectations. So, grab it now.
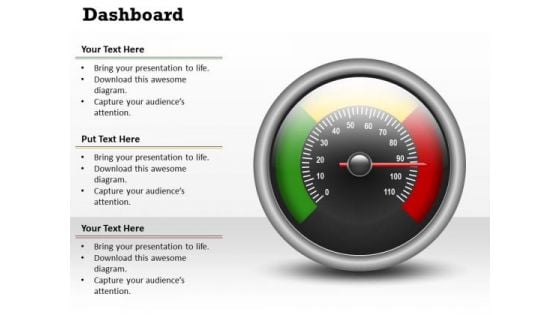
Consulting Diagram Dashboard Busines Design Marketing Diagram
Put In A Dollop Of Our Consulting Diagram Dashboard Busines Design Marketing Diagram Powerpoint Templates. Give Your Thoughts A Distinctive Flavor.
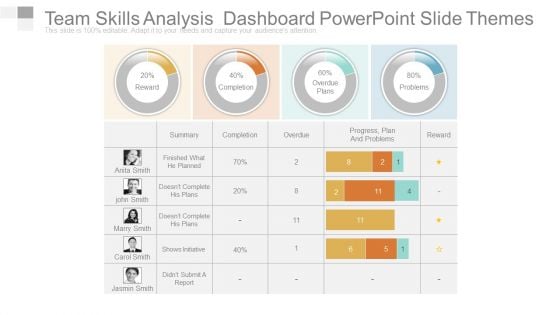
Team Skills Analysis Dashboard Powerpoint Slide Themes
This is a team skills analysis dashboard powerpoint slide themes. This is a four stage process. The stages in this process are reward, completion, overdue, overdue plans, problems.
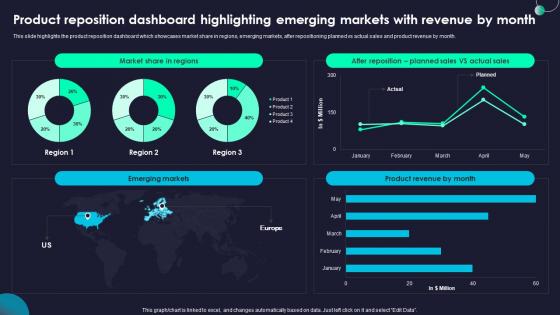
Product Reposition Dashboard Rebranding Marketing Strategies For Effective Diagrams Pdf
This slide highlights the product reposition dashboard which showcases market share in regions, emerging markets, after repositioning planned vs actual sales and product revenue by month. Welcome to our selection of the Product Reposition Dashboard Rebranding Marketing Strategies For Effective Diagrams Pdf, These are designed to help you showcase your creativity and bring your sphere to life. Planning and Innovation are essential for any business that is just starting out. This collection contains the designs that you need for your everyday presentations. All of our PowerPoints are 100 percent editable, so you can customize them to suit your needs. This multi purpose template can be used in various situations. Grab these presentation templates today This slide highlights the product reposition dashboard which showcases market share in regions, emerging markets, after repositioning planned vs actual sales and product revenue by month.
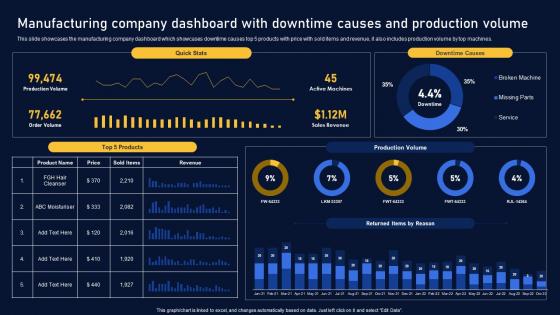
Manufacturing Company Dashboard Multinational Organization Customer Goods Diagrams Pdf
This slide showcases the manufacturing company dashboard which showcases downtime causes top 5 products with price with sold items and revenue, it also includes production volume by top machines. This modern and well arranged Manufacturing Company Dashboard Multinational Organization Customer Goods Diagrams Pdf provides lots of creative possibilities. It is very simple to customize and edit with the Powerpoint Software. Just drag and drop your pictures into the shapes. All facets of this template can be edited with Powerpoint, no extra software is necessary. Add your own material, put your images in the places assigned for them, adjust the colors, and then you can show your slides to the world, with an animated slide included. This slide showcases the manufacturing company dashboard which showcases downtime causes top 5 products with price with sold items and revenue, it also includes production volume by top machines.
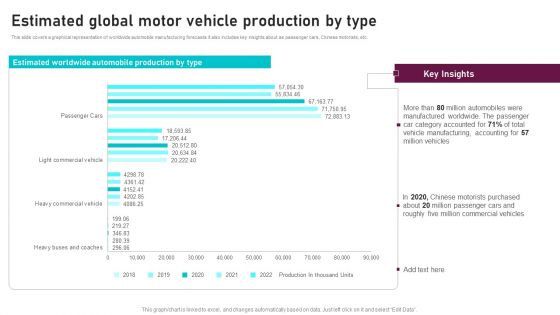
Estimated Global Motor Vehicle Production By Type Global Automotive Manufacturing Market Analysis Information PDF
This slide covers a graphical representation of worldwide automobile manufacturing forecasts. It also includes key insights about as passenger cars, Chinese motorists, etc. The Estimated Global Motor Vehicle Production By Type Global Automotive Manufacturing Market Analysis Information PDF is a compilation of the most recent design trends as a series of slides. It is suitable for any subject or industry presentation, containing attractive visuals and photo spots for businesses to clearly express their messages. This template contains a variety of slides for the user to input data, such as structures to contrast two elements, bullet points, and slides for written information. Slidegeeks is prepared to create an impression.
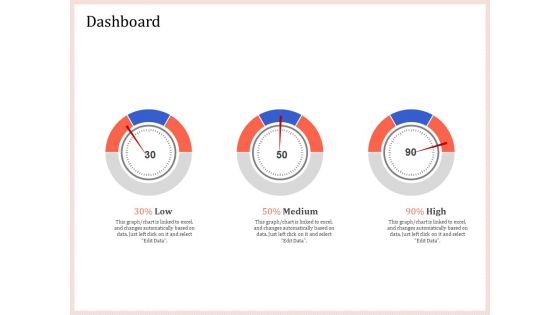
Pitch Deck To Raise Capital From Product Pooled Funding Dashboard Diagrams PDF
Deliver an awe inspiring pitch with this creative pitch deck to raise capital from product pooled funding dashboard diagrams pdf bundle. Topics like low, medium, high can be discussed with this completely editable template. It is available for immediate download depending on the needs and requirements of the user.
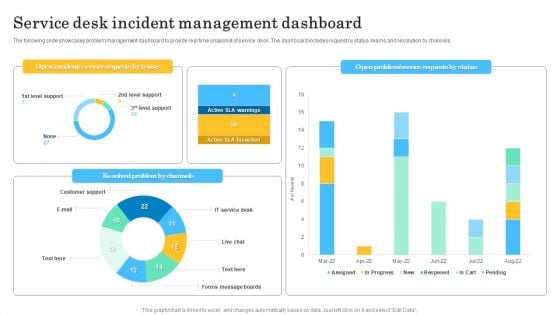
Service Desk Incident Management Dashboard Summary PDF
The following slide showcases problem management dashboard to provide real time snapshot of service desk. The dashboard includes request by status, teams and resolution by channels. Showcasing this set of slides titled Service Desk Incident Management Dashboard Summary PDF. The topics addressed in these templates are Open Incidents Service, Requests By Teams. All the content presented in this PPT design is completely editable. Download it and make adjustments in color, background, font etc. as per your unique business setting.
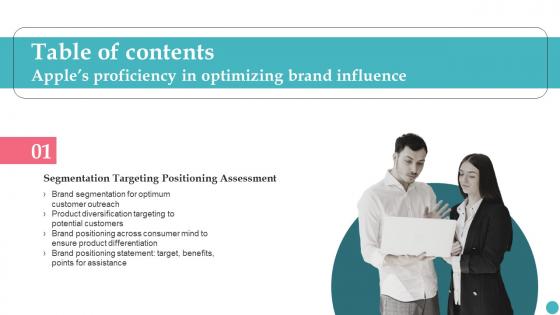
Apples Proficiency In Optimizing Brand Influence Table Of Contents Diagrams Pdf
The Apples Proficiency In Optimizing Brand Influence Table Of Contents Diagrams Pdf is a compilation of the most recent design trends as a series of slides. It is suitable for any subject or industry presentation, containing attractive visuals and photo spots for businesses to clearly express their messages. This template contains a variety of slides for the user to input data, such as structures to contrast two elements, bullet points, and slides for written information. Slidegeeks is prepared to create an impression. Our Apples Proficiency In Optimizing Brand Influence Table Of Contents Diagrams Pdf are topically designed to provide an attractive backdrop to any subject. Use them to look like a presentation pro.
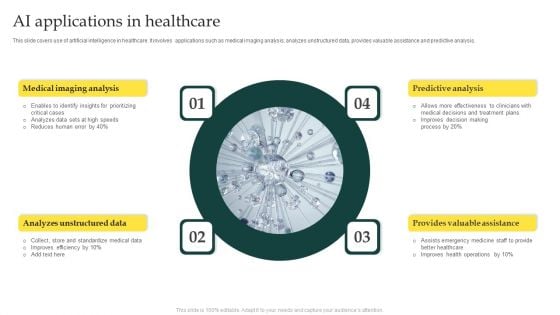
AI Applications In Healthcare Sample PDF
This slide covers use of artificial intelligence in healthcare. It involves applications such as medical imaging analysis, analyzes unstructured data, provides valuable assistance and predictive analysis. Presenting AI Applications In Healthcare Sample PDF to dispense important information. This template comprises four stages. It also presents valuable insights into the topics including Analyzes Unstructured, Provides Valuable, Predictive Analysis. This is a completely customizable PowerPoint theme that can be put to use immediately. So, download it and address the topic impactfully.
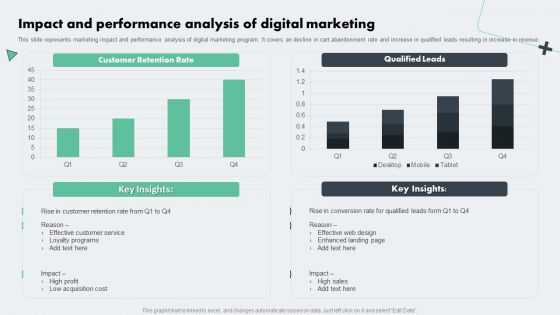
Deploying Online Marketing Impact And Performance Analysis Of Digital Marketing Background PDF
This slide represents marketing impact and performance analysis of digital marketing program. It covers an decline in cart abandonment rate and increase in qualified leads resulting in increase in revenue. The Deploying Online Marketing Impact And Performance Analysis Of Digital Marketing Background PDF is a compilation of the most recent design trends as a series of slides. It is suitable for any subject or industry presentation, containing attractive visuals and photo spots for businesses to clearly express their messages. This template contains a variety of slides for the user to input data, such as structures to contrast two elements, bullet points, and slides for written information. Slidegeeks is prepared to create an impression.
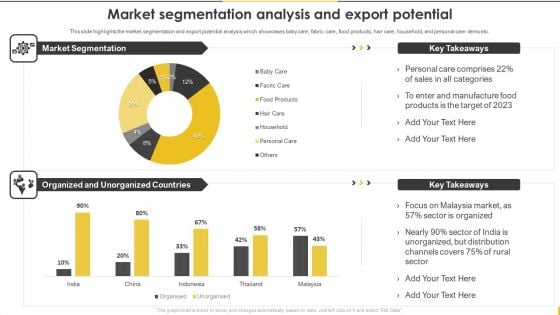
Customer Goods Production Market Segmentation Analysis And Export Potential Download PDF
This slide highlights the market segmentation and export potential analysis which showcases baby care, fabric care, food products, hair care, household, and personal care items etc. The Customer Goods Production Market Segmentation Analysis And Export Potential Download PDF is a compilation of the most recent design trends as a series of slides. It is suitable for any subject or industry presentation, containing attractive visuals and photo spots for businesses to clearly express their messages. This template contains a variety of slides for the user to input data, such as structures to contrast two elements, bullet points, and slides for written information. Slidegeeks is prepared to create an impression.
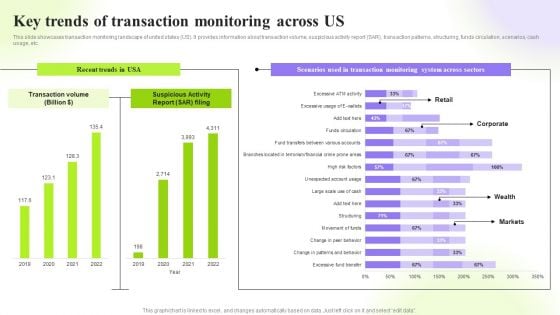
Techniques To Monitor Transactions Key Trends Of Transaction Monitoring Across Us Themes PDF
This slide showcases transaction monitoring landscape of united states US. It provides information about transaction volume, suspicious activity report SAR, transaction patterns, structuring, funds circulation, scenarios, cash usage, etc. The Techniques To Monitor Transactions Key Trends Of Transaction Monitoring Across Us Themes PDF is a compilation of the most recent design trends as a series of slides. It is suitable for any subject or industry presentation, containing attractive visuals and photo spots for businesses to clearly express their messages. This template contains a variety of slides for the user to input data, such as structures to contrast two elements, bullet points, and slides for written information. Slidegeeks is prepared to create an impression.
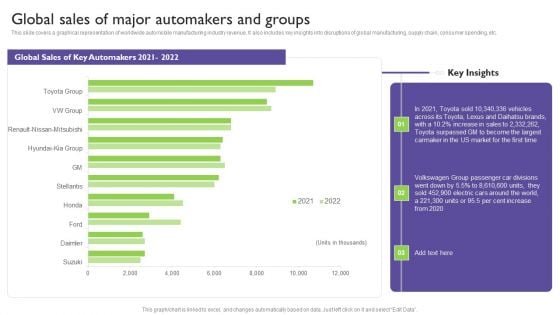
Global Automotive Industry Analysis Global Sales Of Major Automakers And Groups Pictures PDF
This slide covers a graphical representation of worldwide automobile manufacturing industry revenue. It also includes key insights into disruptions of global manufacturing, supply chain, consumer spending, etc. The Global Automotive Industry Analysis Global Sales Of Major Automakers And Groups Pictures PDF is a compilation of the most recent design trends as a series of slides. It is suitable for any subject or industry presentation, containing attractive visuals and photo spots for businesses to clearly express their messages. This template contains a variety of slides for the user to input data, such as structures to contrast two elements, bullet points, and slides for written information. Slidegeeks is prepared to create an impression.
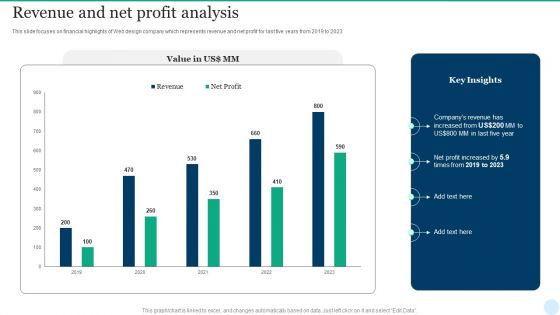
Web Interface Development Services Company Summary Revenue And Net Profit Analysis Slides PDF
This slide focuses on financial highlights of Web design company which represents revenue and net profit for last five years from 2019 to 2023. The Web Interface Development Services Company Summary Revenue And Net Profit Analysis Slides PDF is a compilation of the most recent design trends as a series of slides. It is suitable for any subject or industry presentation, containing attractive visuals and photo spots for businesses to clearly express their messages. This template contains a variety of slides for the user to input data, such as structures to contrast two elements, bullet points, and slides for written information. Slidegeeks is prepared to create an impression.
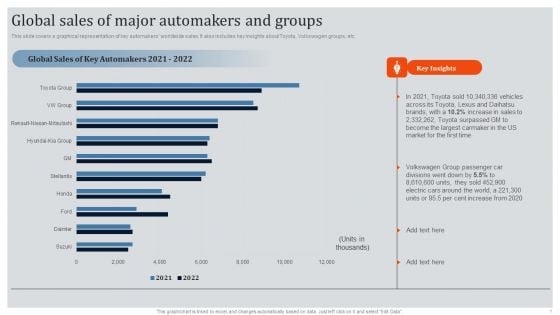
Global Automotive Industry Research And Analysis Global Sales Of Major Automakers And Groups Infographics PDF
This slide covers a graphical representation of key automakers worldwide sales. It also includes key insights about Toyota, Volkswagen groups, etc. The Global Automotive Industry Research And Analysis Global Sales Of Major Automakers And Groups Infographics PDF is a compilation of the most recent design trends as a series of slides. It is suitable for any subject or industry presentation, containing attractive visuals and photo spots for businesses to clearly express their messages. This template contains a variety of slides for the user to input data, such as structures to contrast two elements, bullet points, and slides for written information. Slidegeeks is prepared to create an impression.

Credit Score Meter Ppt PowerPoint Presentation Complete Deck With Slides
If designing a presentation takes a lot of your time and resources and you are looking for a better alternative, then this Credit Score Meter Ppt PowerPoint Presentation Complete Deck With Slides is the right fit for you. This is a prefabricated set that can help you deliver a great presentation on the topic. All the ten slides included in this sample template can be used to present a birds-eye view of the topic. These slides are also fully editable, giving you enough freedom to add specific details to make this layout more suited to your business setting. Apart from the content, all other elements like color, design, theme are also replaceable and editable. This helps in designing a variety of presentations with a single layout. Not only this, you can use this PPT design in formats like PDF, PNG, and JPG once downloaded. Therefore, without any further ado, download and utilize this sample presentation as per your liking.
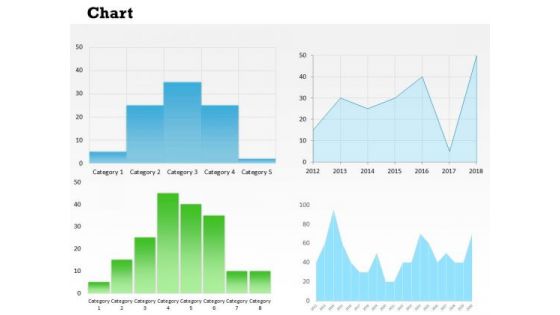
Business Diagram Multiple Charts Business Dashboard Marketing Diagram
Document The Process On Our Business Diagram Multiple Charts Business Dashboard Marketing Diagram Powerpoint Templates. Make A Record Of Every Detail.
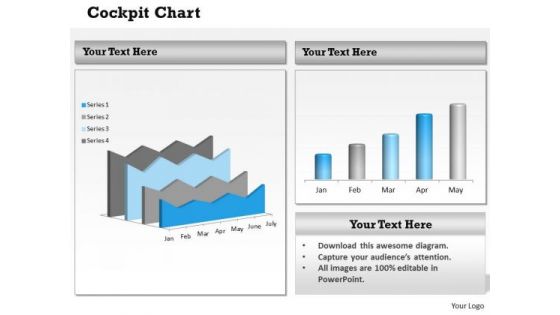
Consulting Diagram Business Dashboard Design Chart Sales Diagram
Document The Process On Our Consulting Diagram Business Dashboard Design Chart Sales Diagram Powerpoint Templates. Make A Record Of Every Detail.
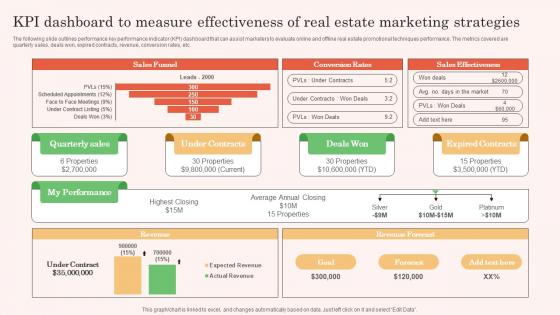
KPI Dashboard To Measure Effectivenesss Real Estate Property Marketing Themes Pdf
The following slide outlines performance key performance indicator KPI dashboard that can assist marketers to evaluate online and offline real estate promotional techniques performance. The metrics covered are quarterly sales, deals won, expired contracts, revenue, conversion rates, etc. Take your projects to the next level with our ultimate collection of KPI Dashboard To Measure Effectivenesss Real Estate Property Marketing Themes Pdf. Slidegeeks has designed a range of layouts that are perfect for representing task or activity duration, keeping track of all your deadlines at a glance. Tailor these designs to your exact needs and give them a truly corporate look with your own brand colors they all make your projects stand out from the rest. The following slide outlines performance key performance indicator KPI dashboard that can assist marketers to evaluate online and offline real estate promotional techniques performance. The metrics covered are quarterly sales, deals won, expired contracts, revenue, conversion rates, etc.
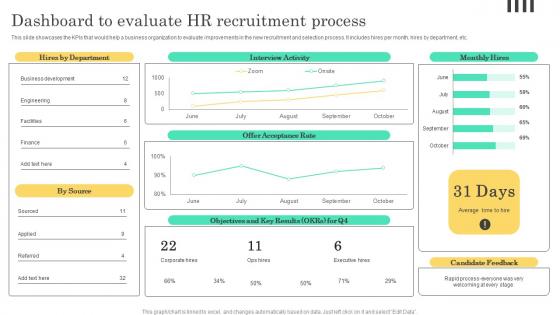
Dashboard To Evaluate HR Recruitment Implementable Hiring And Selection Themes Pdf
This slide showcases the KPIs that would help a business organization to evaluate improvements in the new recruitment and selection process. It includes hires per month, hires by department, etc. Get a simple yet stunning designed Dashboard To Evaluate HR Recruitment Implementable Hiring And Selection Themes Pdf. It is the best one to establish the tone in your meetings. It is an excellent way to make your presentations highly effective. So, download this PPT today from Slidegeeks and see the positive impacts. Our easy to edit Dashboard To Evaluate HR Recruitment Implementable Hiring And Selection Themes Pdf can be your go to option for all upcoming conferences and meetings. So, what are you waiting for Grab this template today. This slide showcases the KPIs that would help a business organization to evaluate improvements in the new recruitment and selection process. It includes hires per month, hires by department, etc.
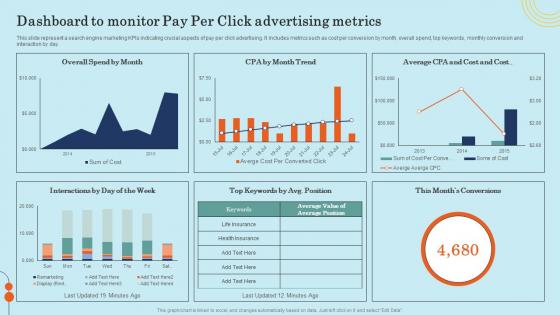
Dashboard To Monitor Pay Per Click Advertising Metrics Effective General Insurance Marketing Themes Pdf
This slide represent a search engine marketing KPIs indicating crucial aspects of pay per click advertising. It includes metrics such as cost per conversion by month, overall spend, top keywords, monthly conversion and interaction by day. Do you have to make sure that everyone on your team knows about any specific topic I yes, then you should give Dashboard To Monitor Pay Per Click Advertising Metrics Effective General Insurance Marketing Themes Pdf a try. Our experts have put a lot of knowledge and effort into creating this impeccable Dashboard To Monitor Pay Per Click Advertising Metrics Effective General Insurance Marketing Themes Pdf. You can use this template for your upcoming presentations, as the slides are perfect to represent even the tiniest detail. You can download these templates from the Slidegeeks website and these are easy to edit. So grab these today. This slide represent a search engine marketing KPIs indicating crucial aspects of pay per click advertising. It includes metrics such as cost per conversion by month, overall spend, top keywords, monthly conversion and interaction by day.
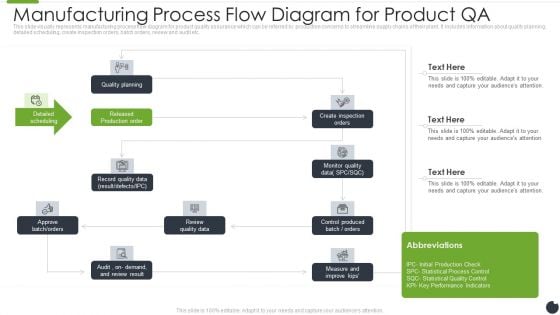
Manufacturing Process Flow Diagram For Product QA Mockup PDF
This slide visually represents manufacturing process flow diagram for product quality assurance which can be referred by production concerns to streamline supply chains of their plant. It includes information about quality planning, detailed scheduling, create inspection orders, batch orders, review and audit etc. Showcasing this set of slides titled manufacturing process flow diagram for product qa mockup pdf. The topics addressed in these templates are quality planning, approve batch and orders, review quality data. All the content presented in this PPT design is completely editable. Download it and make adjustments in color, background, font etc. as per your unique business setting.
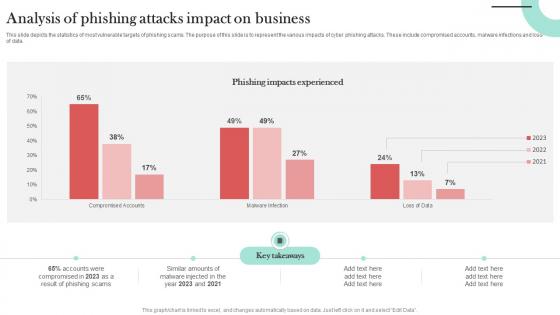
Analysis Of Phishing Attacks Impact Man In The Middle Phishing IT
This slide depicts the statistics of most vulnerable targets of phishing scams. The purpose of this slide is to represent the various impacts of cyber phishing attacks. These include compromised accounts, malware infections and loss of data. If you are looking for a format to display your unique thoughts, then the professionally designed Analysis Of Phishing Attacks Impact Man In The Middle Phishing IT is the one for you. You can use it as a Google Slides template or a PowerPoint template. Incorporate impressive visuals, symbols, images, and other charts. Modify or reorganize the text boxes as you desire. Experiment with shade schemes and font pairings. Alter, share or cooperate with other people on your work. Download Analysis Of Phishing Attacks Impact Man In The Middle Phishing IT and find out how to give a successful presentation. Present a perfect display to your team and make your presentation unforgettable. This slide depicts the statistics of most vulnerable targets of phishing scams. The purpose of this slide is to represent the various impacts of cyber phishing attacks. These include compromised accounts, malware infections and loss of data.
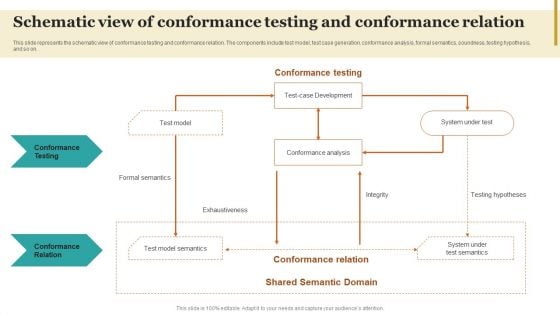
Schematic View Of Conformance Testing And Conformance Relation Themes PDF
This slide represents the schematic view of conformance testing and conformance relation. The components include test model, test case generation, conformance analysis, formal semantics, soundness, testing hypothesis, and so on. The Schematic View Of Conformance Testing And Conformance Relation Themes PDF is a compilation of the most recent design trends as a series of slides. It is suitable for any subject or industry presentation, containing attractive visuals and photo spots for businesses to clearly express their messages. This template contains a variety of slides for the user to input data, such as structures to contrast two elements, bullet points, and slides for written information. Slidegeeks is prepared to create an impression.

Dashboards Track Effectiveness Administering Diversity And Inclusion At Workplace Themes Pdf
The performance tracker includes health and safety measures which are incidence rate, critical incidence, type of incidence, consequences of injuries etc. Slidegeeks is here to make your presentations a breeze with Dashboards Track Effectiveness Administering Diversity And Inclusion At Workplace Themes Pdf With our easy to use and customizable templates, you can focus on delivering your ideas rather than worrying about formatting. With a variety of designs to choose from, you are sure to find one that suits your needs. And with animations and unique photos, illustrations, and fonts, you can make your presentation pop. So whether you are giving a sales pitch or presenting to the board, make sure to check out Slidegeeks first The performance tracker includes health and safety measures which are incidence rate, critical incidence, type of incidence, consequences of injuries etc.
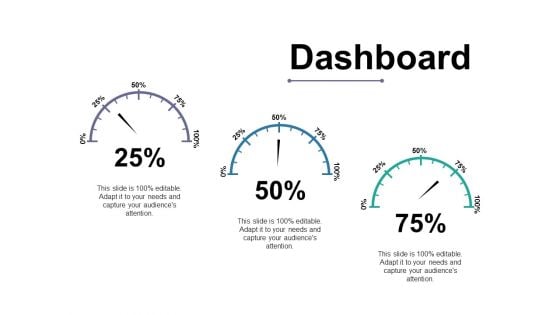
Dashboard Ppt PowerPoint Presentation Styles Themes
This is a dashboard ppt powerpoint presentation styles themes. This is a three stage process. The stages in this process are dashboard, speed, meter, business, marketing.
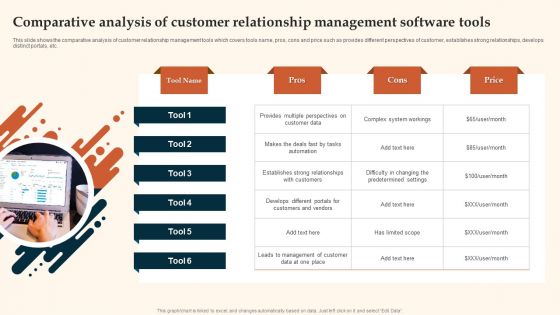
Comparative Analysis Of Customer Relationship Management Software Tools Rules PDF
This slide shows the comparative analysis of customer relationship management tools which covers tools name, pros, cons and price such as provides different perspectives of customer, establishes strong relationships, develops distinct portals, etc. Presenting Comparative Analysis Of Customer Relationship Management Software Tools Rules PDF to dispense important information. This template comprises six stages. It also presents valuable insights into the topics including Customer Data, Complex System Workings, Management. This is a completely customizable PowerPoint theme that can be put to use immediately. So, download it and address the topic impactfully.

Our Performance Indicators Powerpoint Themes
This is a our performance indicators powerpoint themes. This is a five stage process. The stages in this process are cash flow, turnover, productivity, customer satisfaction, net income.
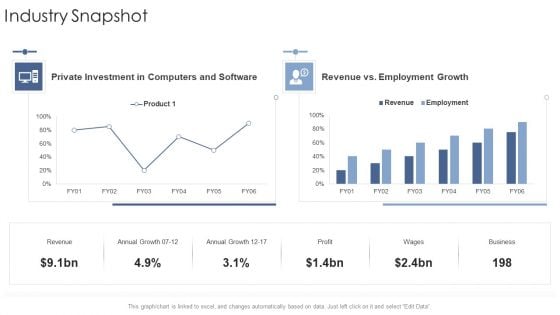
Industry Snapshot Annual Startup Business Strategy Ppt Portfolio Graphics Template PDF
Deliver and pitch your topic in the best possible manner with this industry snapshot annual startup business strategy ppt portfolio graphics template pdf. Use them to share invaluable insights on revenue, growth, business, profit and impress your audience. This template can be altered and modified as per your expectations. So, grab it now.
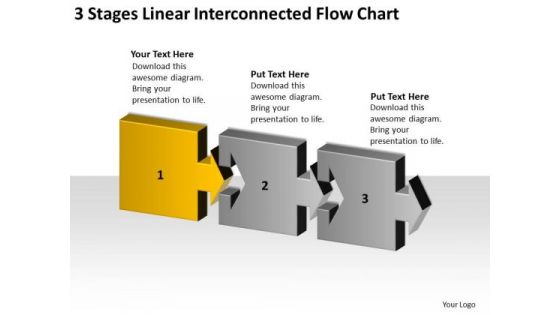
3 Stages Linear Interconnected Flow Chart Ppt Business Plans Sample PowerPoint Templates
We present our 3 stages linear interconnected flow chart ppt business plans sample PowerPoint templates.Use our Finance PowerPoint Templates because Our PowerPoint Templates and Slides will let you Hit the right notes. Watch your audience start singing to your tune. Download our Marketing PowerPoint Templates because Our PowerPoint Templates and Slides will help you be quick off the draw. Just enter your specific text and see your points hit home. Use our Arrows PowerPoint Templates because Timeline crunches are a fact of life. Meet all deadlines using our PowerPoint Templates and Slides. Present our Business PowerPoint Templates because you should Experience excellence with our PowerPoint Templates and Slides. They will take your breath away. Download and present our Process and Flows PowerPoint Templates because It will Strengthen your hand with your thoughts. They have all the aces you need to win the day.Use these PowerPoint slides for presentations relating to Flow, design, isolated, wallpaper, input, components, display, advertise, business, concept, vector, presentation, template, circle, brochure, output, directional, analytical, modern, steps, connection, chart, strategy, interconnected, web, direction, ad, text, information, pictogram, message, arrows, communication. The prominent colors used in the PowerPoint template are Yellow, Gray, Black. Get on a accelerated career track with our 3 Stages Linear Interconnected Flow Chart Ppt Business Plans Sample PowerPoint Templates. They will make you look good.
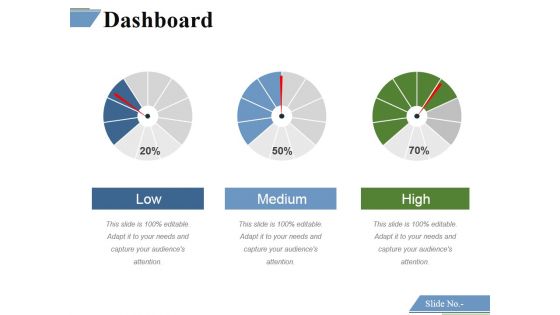
Dashboard Ppt PowerPoint Presentation Portfolio Themes
This is a dashboard ppt powerpoint presentation portfolio themes. This is a three stage process. The stages in this process are low, medium, high.
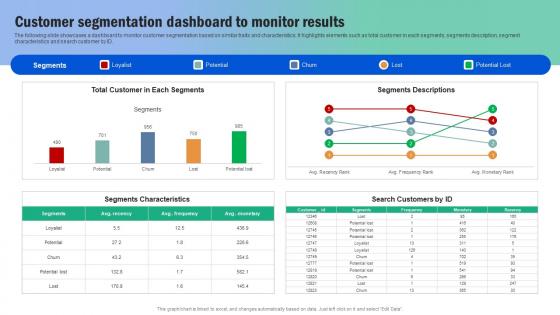
Customer Segmentation Dashboard To Monitor Results Guide For Segmenting And Formulating Diagrams Pdf
The following slide showcases a dashboard to monitor customer segmentation based on similar traits and characteristics. It highlights elements such as total customer in each segments, segments description, segment characteristics and search customer by ID. Get a simple yet stunning designed Customer Segmentation Dashboard To Monitor Results Guide For Segmenting And Formulating Diagrams Pdf. It is the best one to establish the tone in your meetings. It is an excellent way to make your presentations highly effective. So, download this PPT today from Slidegeeks and see the positive impacts. Our easy to edit Customer Segmentation Dashboard To Monitor Results Guide For Segmenting And Formulating Diagrams Pdf can be your go to option for all upcoming conferences and meetings. So, what are you waiting for Grab this template today. The following slide showcases a dashboard to monitor customer segmentation based on similar traits and characteristics. It highlights elements such as total customer in each segments, segments description, segment characteristics and search customer by ID.
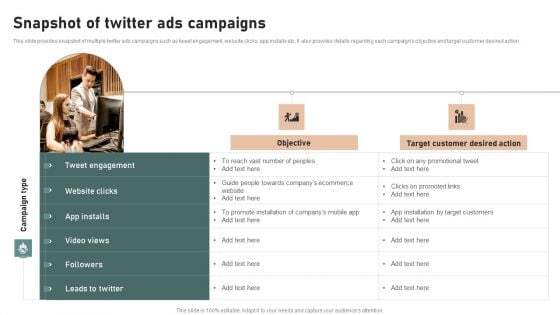
Utilizing Twitter For Social Media Snapshot Of Twitter Ads Campaigns Diagrams PDF
This slide provides snapshot of multiple twitter ads campaigns such as tweet engagement, website clicks, app installs etc. It also provides details regarding each campaigns objective and target customer desired action. Present like a pro with Utilizing Twitter For Social Media Snapshot Of Twitter Ads Campaigns Diagrams PDF Create beautiful presentations together with your team, using our easy-to-use presentation slides. Share your ideas in real-time and make changes on the fly by downloading our templates. So whether you are in the office, on the go, or in a remote location, you can stay in sync with your team and present your ideas with confidence. With Slidegeeks presentation got a whole lot easier. Grab these presentations today.
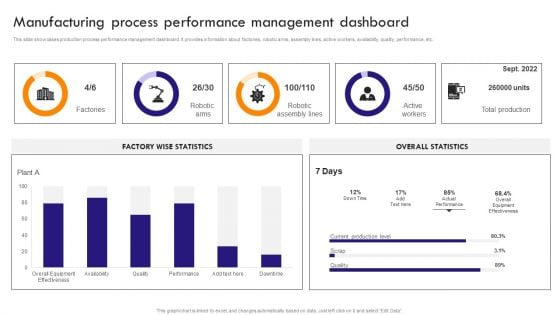
Implementing Robotic Process Manufacturing Process Performance Management Sample PDF
This slide showcases production process performance management dashboard. It provides information about factories, robotic arms, assembly lines, active workers, availability, quality, performance, etc. The Implementing Robotic Process Manufacturing Process Performance Management Sample PDF is a compilation of the most recent design trends as a series of slides. It is suitable for any subject or industry presentation, containing attractive visuals and photo spots for businesses to clearly express their messages. This template contains a variety of slides for the user to input data, such as structures to contrast two elements, bullet points, and slides for written information. Slidegeeks is prepared to create an impression.
Develop Campaign Performance Tracking Framework Elements PDF
The following slide depicts campaign performance management dashboard to measure the results. It includes elements such as conversions funnel, conversion rates, opportunity value, landing pages, sources google, twitter, Facebook etc. The Develop Campaign Performance Tracking Framework Elements PDF is a compilation of the most recent design trends as a series of slides. It is suitable for any subject or industry presentation, containing attractive visuals and photo spots for businesses to clearly express their messages. This template contains a variety of slides for the user to input data, such as structures to contrast two elements, bullet points, and slides for written information. Slidegeeks is prepared to create an impression.

Business Performance Dashboard Analysis Diagram Powerpoint Slides
This is a business performance dashboard analysis diagram powerpoint slides. This is a three stage process. The stages in this process are measure, business, management, presentation, process.

3 Stages Linear Interconnected Flow Chart Ppt Business Plan Cover Letter PowerPoint Slides
We present our 3 stages linear interconnected flow chart ppt business plan cover letter PowerPoint Slides.Use our Finance PowerPoint Templates because It is Aesthetically crafted by artistic young minds. Our PowerPoint Templates and Slides are designed to display your dexterity. Present our Marketing PowerPoint Templates because You can Connect the dots. Fan expectations as the whole picture emerges. Use our Arrows PowerPoint Templates because our PowerPoint Templates and Slides will give your ideas the shape. Download our Business PowerPoint Templates because You should Press the right buttons with our PowerPoint Templates and Slides. They will take your ideas down the perfect channel. Present our Process and Flows PowerPoint Templates because Our PowerPoint Templates and Slides are focused like a searchlight beam. They highlight your ideas for your target audience.Use these PowerPoint slides for presentations relating to Flow, design, isolated, wallpaper, input, components, display, advertise, business, concept, vector, presentation, template, circle, brochure, output, directional, analytical, modern, steps, connection, chart, strategy, interconnected, web, direction, ad, text, information, pictogram, message, arrows, communication. The prominent colors used in the PowerPoint template are Brown, Gray, Black. Our 3 Stages Linear Interconnected Flow Chart Ppt Business Plan Cover Letter PowerPoint Slides will back your concept. The audience will be convinced they can.
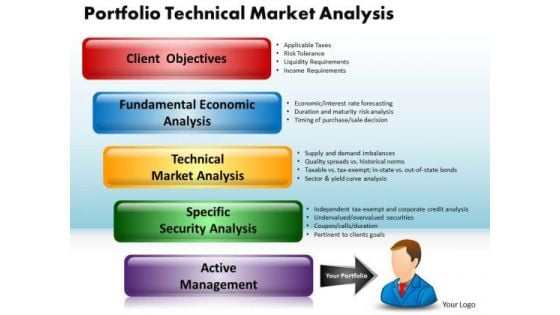
Business Arrows PowerPoint Templates Business Portfolio Technical Market Analysis Ppt Slides
Business Arrows PowerPoint Templates Business portfolio technical market analysis PPT Slides-Use this powerPoint tempalte to a managing a group of projects, and delivering these projects as a portfolio.-Business Arrows PowerPoint Templates Business portfolio technical market analysis PPT Slides-This template can be used for presentations relating to Adult, Analysis, Blackboard, Board, Business, Businessman, Career, Cartoon, Chalkboard, Character, Chart, Clean, Concept, Data, Diagram, Display, Displaying, Drawing, Finance, Forecast, Gain, Graph, Handsome, Illustration, Loss, Man, Marketing, Meeting, Person, Predict, Present, Profession, Professional Deal a decisive blow with our Business Arrows PowerPoint Templates Business Portfolio Technical Market Analysis Ppt Slides. Get clearlyahead in a critical event.
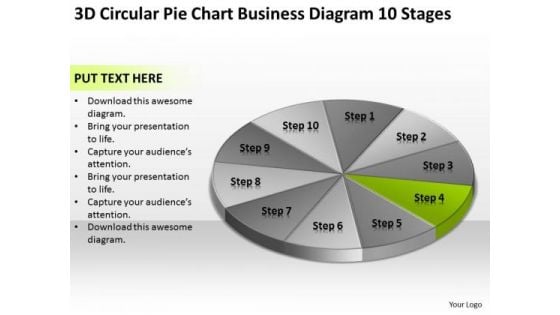
Pie Chart Business Diagram 10 Stages Ppt Plan Example PowerPoint Templates
We present our pie chart business diagram 10 stages ppt plan example PowerPoint templates.Download our Flow Charts PowerPoint Templates because Our PowerPoint Templates and Slides ensures Effective communication. They help you put across your views with precision and clarity. Download our Process and Flows PowerPoint Templates because It is Aesthetically crafted by artistic young minds. Our PowerPoint Templates and Slides are designed to display your dexterity. Download our Marketing PowerPoint Templates because You are an avid believer in ethical practices. Highlight the benefits that accrue with our PowerPoint Templates and Slides. Download and present our Business PowerPoint Templates because Our PowerPoint Templates and Slides ensures Effective communication. They help you put across your views with precision and clarity. Present our Shapes PowerPoint Templates because Our PowerPoint Templates and Slides will let your team Walk through your plans. See their energy levels rise as you show them the way.Use these PowerPoint slides for presentations relating to Graph, icon, market, isolated, statistics, percent, economics, ten, economy, display, business, render, success, presentation,diagram, circle, data, analyst, analysis, bank, report, calculation, accounting, trend, illustration, three, piece, pie, circular, chart, money, dimensional, clipart,accountant, growth, colorful, competition, account, stats, profit, part, information, background, improvement, financial. The prominent colors used in the PowerPoint template are White, Green, Black. Convey your message in an exact manner. Enable accuracy with our Pie Chart Business Diagram 10 Stages Ppt Plan Example PowerPoint Templates.
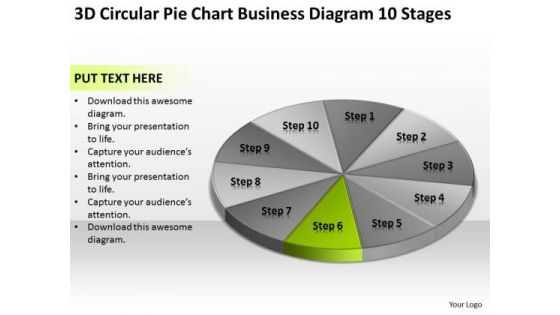
Pie Chart Business Diagram 10 Stages Creating Small Plan PowerPoint Slides
We present our pie chart business diagram 10 stages creating small plan PowerPoint Slides.Present our Flow Charts PowerPoint Templates because Our PowerPoint Templates and Slides will provide you a launch platform. Give a lift off to your ideas and send them into orbit. Present our Process and Flows PowerPoint Templates because Our PowerPoint Templates and Slides will give good value for money. They also have respect for the value of your time. Present our Marketing PowerPoint Templates because Our PowerPoint Templates and Slides will fulfill your every need. Use them and effectively satisfy the desires of your audience. Use our Business PowerPoint Templates because It will mark the footprints of your journey. Illustrate how they will lead you to your desired destination. Download our Shapes PowerPoint Templates because They will bring a lot to the table. Their alluring flavours will make your audience salivate.Use these PowerPoint slides for presentations relating to Graph, icon, market, isolated, statistics, percent, economics, ten, economy, display, business, render, success, presentation,diagram, circle, data, analyst, analysis, bank, report, calculation, accounting, trend, illustration, three, piece, pie, circular, chart, money, dimensional, clipart,accountant, growth, colorful, competition, account, stats, profit, part, information, background, improvement, financial. The prominent colors used in the PowerPoint template are Gray, Green, Black. Go to any extent with our Pie Chart Business Diagram 10 Stages Creating Small Plan PowerPoint Slides. Whatever the distance they will cover it with you.
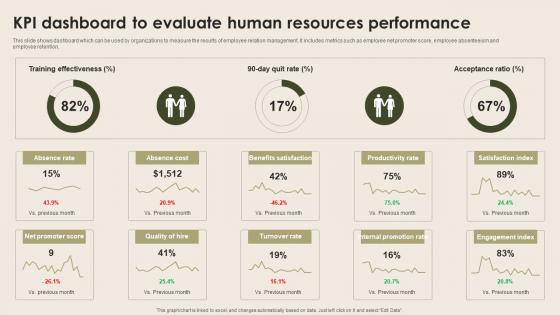
KPI Dashboard To Evaluate Human Resources Nurturing Positive Work Culture Diagrams Pdf
This slide shows dashboard which can be used by organizations to measure the results of employee relation management. It includes metrics such as employee net promoter score, employee absenteeism and employee retention. Welcome to our selection of the KPI Dashboard To Evaluate Human Resources Nurturing Positive Work Culture Diagrams Pdf. These are designed to help you showcase your creativity and bring your sphere to life. Planning and Innovation are essential for any business that is just starting out. This collection contains the designs that you need for your everyday presentations. All of our PowerPoints are 100 percent editable, so you can customize them to suit your needs. This multi-purpose template can be used in various situations. Grab these presentation templates today This slide shows dashboard which can be used by organizations to measure the results of employee relation management. It includes metrics such as employee net promoter score, employee absenteeism and employee retention.
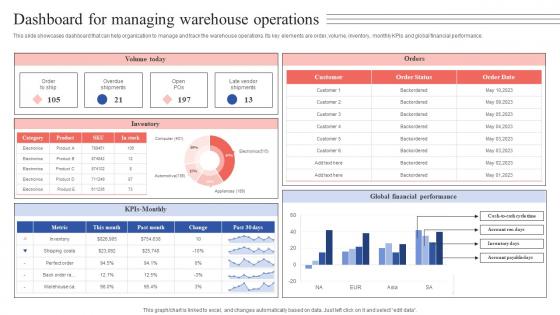
Dashboard For Managing Warehouse Operations Tactical Guide Stock Administration Diagrams Pdf
This slide showcases dashboard that can help organization to manage and track the warehouse operations. Its key elements are order, volume, inventory, monthly KPIs and global financial performance. From laying roadmaps to briefing everything in detail, our templates are perfect for you. You can set the stage with your presentation slides. All you have to do is download these easy-to-edit and customizable templates. Dashboard For Managing Warehouse Operations Tactical Guide Stock Administration Diagrams Pdf will help you deliver an outstanding performance that everyone would remember and praise you for. Do download this presentation today. This slide showcases dashboard that can help organization to manage and track the warehouse operations. Its key elements are order, volume, inventory, monthly KPIs and global financial performance.
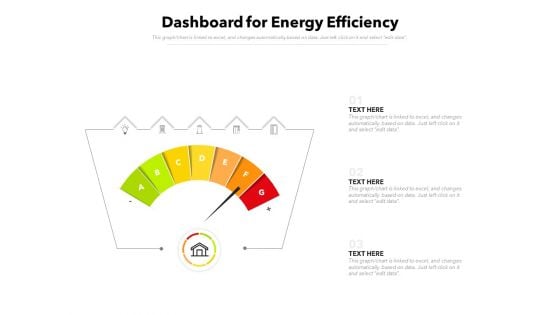
Dashboard For Energy Efficiency Ppt PowerPoint Presentation Show Format PDF
Pitch your topic with ease and precision using this dashboard for energy efficiency ppt powerpoint presentation show format pdf. This layout presents information on dashboard for energy efficiency. It is also available for immediate download and adjustment. So, changes can be made in the color, design, graphics or any other component to create a unique layout.
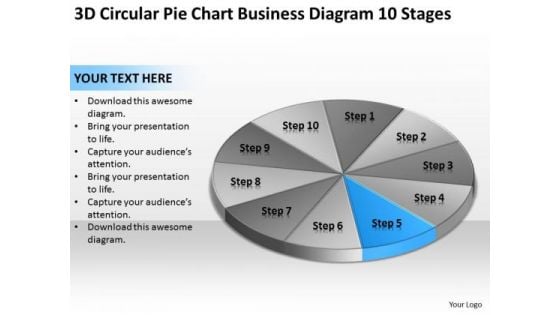
Pie Chart Business Diagram 10 Stages Ppt Templates For Plans PowerPoint Slides
We present our pie chart business diagram 10 stages ppt templates for plans PowerPoint Slides.Download our Business PowerPoint Templates because Our PowerPoint Templates and Slides come in all colours, shades and hues. They help highlight every nuance of your views. Use our Marketing PowerPoint Templates because Our PowerPoint Templates and Slides will provide you the cutting edge. Slice through the doubts in the minds of your listeners. Use our Process and Flows PowerPoint Templates because Your ideas provide food for thought. Our PowerPoint Templates and Slides will help you create a dish to tickle the most discerning palate. Present our Future PowerPoint Templates because Our PowerPoint Templates and Slides are conceived by a dedicated team. Use them and give form to your wondrous ideas. Download and present our Success PowerPoint Templates because Watching this your Audience will Grab their eyeballs, they wont even blink.Use these PowerPoint slides for presentations relating to Graph, icon, market, isolated, statistics, percent, economics, ten, economy, display, business, render, success, presentation,diagram, circle, data, analyst, analysis, bank, report, calculation, accounting, trend, illustration, three, piece, pie, circular, chart, money, dimensional, clipart,accountant, growth, colorful, competition, account, stats, profit, part, information, background, improvement, financial. The prominent colors used in the PowerPoint template are Blue, Gray, White. With our Pie Chart Business Diagram 10 Stages Ppt Templates For Plans PowerPoint Slides fear is never a factor. Do not allow adversity to effect you.
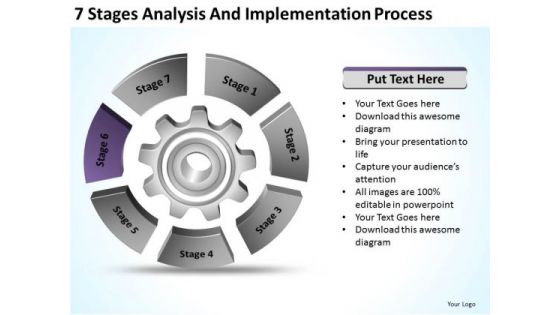
7 Stages Analysis And Implementation Process Business Plans PowerPoint Slides
We present our 7 stages analysis and implementation process business plans PowerPoint Slides.Download and present our Business PowerPoint Templates because It will let you Set new benchmarks with our PowerPoint Templates and Slides. They will keep your prospects well above par. Download our Venn Diagrams PowerPoint Templates because You are an avid believer in ethical practices. Highlight the benefits that accrue with our PowerPoint Templates and Slides. Use our Layers PowerPoint Templates because Our PowerPoint Templates and Slides will provide weight to your words. They will bring out the depth of your thought process. Use our Circle Charts PowerPoint Templates because Our PowerPoint Templates and Slides provide you with a vast range of viable options. Select the appropriate ones and just fill in your text. Download our Shapes PowerPoint Templates because you should once Tap the ingenuity of our PowerPoint Templates and Slides. They are programmed to succeed.Use these PowerPoint slides for presentations relating to diagram, process, business, graphic, design, ideas, model, data, chart, project, schema, corporate, implementation, tag, plan, engineering, concept, vector, success, symbol, stack, circle, guide, work flow, development, shape, team, management, cycle, steps, illustration, system, strategy, objects, phase, professional, organization, implement, background, image, detail, structure, product. The prominent colors used in the PowerPoint template are Blue, Black, Gray. You will rarely find fault with our 7 Stages Analysis And Implementation Process Business Plans PowerPoint Slides. They are designed by a fastidious team.
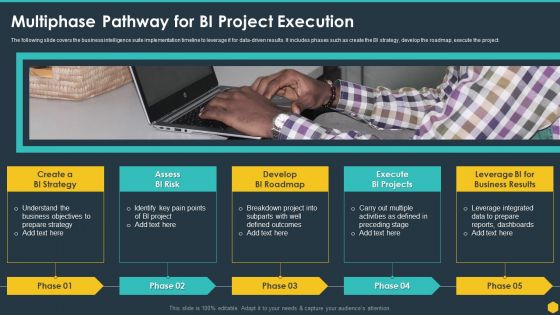
Multiphase Pathway For BI Project Execution BI Transformation Toolset Template PDF
The following slide covers the business intelligence suite implementation timeline to leverage it for data-driven results. It includes phases such as create the BI strategy, develop the roadmap, execute the project. This is a Multiphase Pathway For BI Project Execution BI Transformation Toolset Template PDF template with various stages. Focus and dispense information on five stages using this creative set, that comes with editable features. It contains large content boxes to add your information on topics like Strategy, Project, Dashboards, Execute, Develop. You can also showcase facts, figures, and other relevant content using this PPT layout. Grab it now.
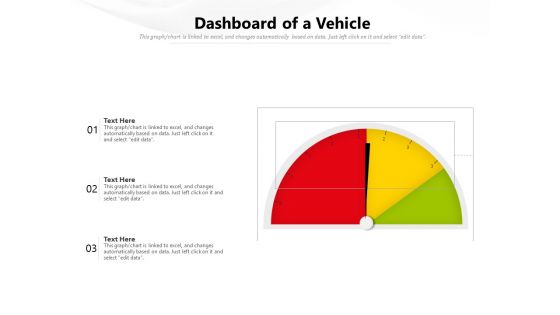
Dashboard Of A Vehicle Ppt PowerPoint Presentation Outline Layout Ideas PDF
Showcasing this set of slides titled dashboard of a vehicle ppt powerpoint presentation outline layout ideas pdf. The topics addressed in these templates are dashboard of a vehicle. All the content presented in this PPT design is completely editable. Download it and make adjustments in color, background, font etc. as per your unique business setting.
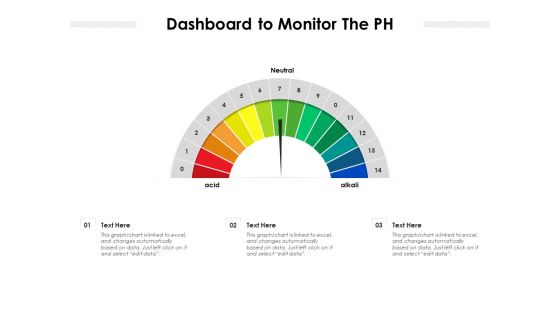
Dashboard To Monitor The PH Ppt PowerPoint Presentation Outline Master Slide PDF
Showcasing this set of slides titled dashboard to monitor the ph ppt powerpoint presentation outline master slide pdf. The topics addressed in these templates are dashboard to monitor the ph. All the content presented in this PPT design is completely editable. Download it and make adjustments in color, background, font etc. as per your unique business setting.
Sports Team And Brand Engagement Tracking Dashboard In Depth Campaigning Guide Diagrams PDF
This slide showcases major impact of sports marketing strategies on overall stakeholder engagement. It provides details about repeated store visit, brand awareness, brand recall, employee engagement, sports sponsorship, etc. Slidegeeks is here to make your presentations a breeze with Sports Team And Brand Engagement Tracking Dashboard In Depth Campaigning Guide Diagrams PDF With our easy-to-use and customizable templates, you can focus on delivering your ideas rather than worrying about formatting. With a variety of designs to choose from, you are sure to find one that suits your needs. And with animations and unique photos, illustrations, and fonts, you can make your presentation pop. So whether you are giving a sales pitch or presenting to the board, make sure to check out Slidegeeks first This slide showcases major impact of sports marketing strategies on overall stakeholder engagement. It provides details about repeated store visit, brand awareness, brand recall, employee engagement, sports sponsorship, etc.


 Continue with Email

 Home
Home


