Data Analytics Icons
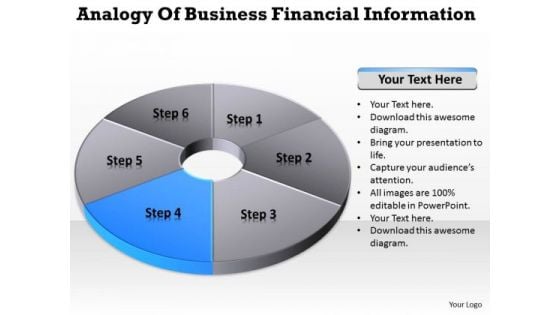
Financial Information Pie Donut Diagram 6 Stages How To Business Plan PowerPoint Slides
We present our financial information pie donut diagram 6 stages how to business plan PowerPoint Slides.Download and present our Competition PowerPoint Templates because Our PowerPoint Templates and Slides will definately Enhance the stature of your presentation. Adorn the beauty of your thoughts with their colourful backgrounds. Present our Marketing PowerPoint Templates because Our PowerPoint Templates and Slides are conceived by a dedicated team. Use them and give form to your wondrous ideas. Download our Process and Flows PowerPoint Templates because Our PowerPoint Templates and Slides will effectively help you save your valuable time. They are readymade to fit into any presentation structure. Present our Circle Charts PowerPoint Templates because Our PowerPoint Templates and Slides will let you meet your Deadlines. Present our Business PowerPoint Templates because They will bring a lot to the table. Their alluring flavours will make your audience salivate.Use these PowerPoint slides for presentations relating to chart, graph, pie, 3d, diagram, graphic, icon, control, business, data, profit, market, sales, display, corporate, concept, render, success, presentation, finance, report, marketing, accounting, management, piece, strategy, money, growth, company, competition, progress, account, sheet, part, information, investment, improvement, banking, index, financial, reflect, results, performance, exchange. The prominent colors used in the PowerPoint template are Blue, Black, Gray. Feuds can happen at the workplace. Settle them amicably with our Financial Information Pie Donut Diagram 6 Stages How To Business Plan PowerPoint Slides.
Dashboard For Tracking Viral Implementing Social Media Tactics For Boosting WOM Professional Pdf
This slide showcases the parameters for business organizations to evaluate viral marketing performance. It includes KPIs such as user metrics, campaign metrics, social metrics, engagement rate, viral sign ups, etc. Whether you have daily or monthly meetings, a brilliant presentation is necessary. Dashboard For Tracking Viral Implementing Social Media Tactics For Boosting WOM Professional Pdf can be your best option for delivering a presentation. Represent everything in detail using Dashboard For Tracking Viral Implementing Social Media Tactics For Boosting WOM Professional Pdf and make yourself stand out in meetings. The template is versatile and follows a structure that will cater to your requirements. All the templates prepared by Slidegeeks are easy to download and edit. Our research experts have taken care of the corporate themes as well. So, give it a try and see the results. This slide showcases the parameters for business organizations to evaluate viral marketing performance. It includes KPIs such as user metrics, campaign metrics, social metrics, engagement rate, viral sign ups, etc.
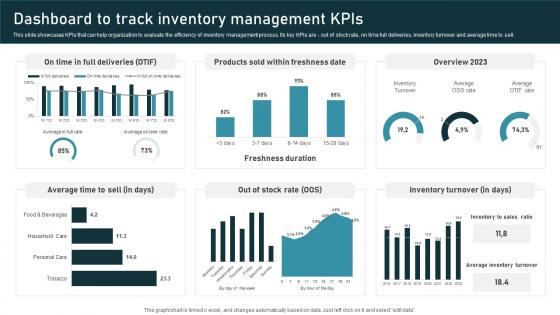
Dashboard To Track Inventory Administration Techniques For Enhanced Stock Accuracy Structure Pdf
This slide showcases KPIs that can help organization to evaluate the efficiency of inventory management process. Its key KPIs are out of stock rate, on time full deliveries, inventory turnover and average time to sell. Whether you have daily or monthly meetings, a brilliant presentation is necessary. Dashboard To Track Inventory Administration Techniques For Enhanced Stock Accuracy Structure Pdf can be your best option for delivering a presentation. Represent everything in detail using Dashboard To Track Inventory Administration Techniques For Enhanced Stock Accuracy Structure Pdf and make yourself stand out in meetings. The template is versatile and follows a structure that will cater to your requirements. All the templates prepared by Slidegeeks are easy to download and edit. Our research experts have taken care of the corporate themes as well. So, give it a try and see the results. This slide showcases KPIs that can help organization to evaluate the efficiency of inventory management process. Its key KPIs are out of stock rate, on time full deliveries, inventory turnover and average time to sell.
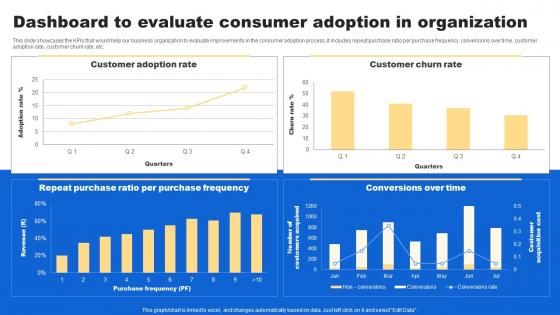
Dashboard To Evaluate Consumer Analyzing Customer Buying Behavior Enhance Conversion Inspiration Pdf
This slide showcases the KPIs that would help our business organization to evaluate improvements in the consumer adoption process. It includes repeat purchase ratio per purchase frequency, conversions over time, customer adoption rate, customer churn rate, etc. Whether you have daily or monthly meetings, a brilliant presentation is necessary. Dashboard To Evaluate Consumer Analyzing Customer Buying Behavior Enhance Conversion Inspiration Pdf can be your best option for delivering a presentation. Represent everything in detail using Dashboard To Evaluate Consumer Analyzing Customer Buying Behavior Enhance Conversion Inspiration Pdf and make yourself stand out in meetings. The template is versatile and follows a structure that will cater to your requirements. All the templates prepared by Slidegeeks are easy to download and edit. Our research experts have taken care of the corporate themes as well. So, give it a try and see the results. This slide showcases the KPIs that would help our business organization to evaluate improvements in the consumer adoption process. It includes repeat purchase ratio per purchase frequency, conversions over time, customer adoption rate, customer churn rate, etc.
Dashboard For Tracking Employee Satisfaction Rate Detailed Personnel Slides Pdf
This slide covers KPI dashboard to measure employee satisfaction due to effective internal communication. It includes indicators such as net promoter score, retention rate, absenteeism etc. This Dashboard For Tracking Employee Satisfaction Rate Detailed Personnel Slides Pdf is perfect for any presentation, be it in front of clients or colleagues. It is a versatile and stylish solution for organizing your meetings. The Dashboard For Tracking Employee Satisfaction Rate Detailed Personnel Slides Pdf features a modern design for your presentation meetings. The adjustable and customizable slides provide unlimited possibilities for acing up your presentation. Slidegeeks has done all the homework before launching the product for you. So, do not wait, grab the presentation templates today This slide covers KPI dashboard to measure employee satisfaction due to effective internal communication. It includes indicators such as net promoter score, retention rate, absenteeism etc.
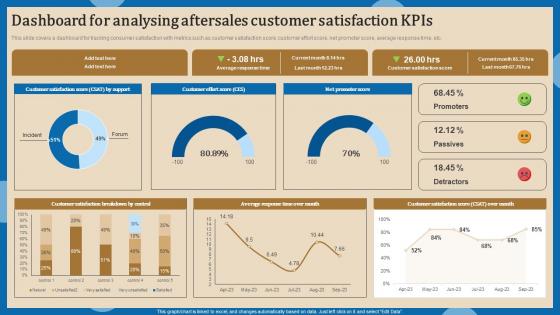
Dashboard For Analysing Increasing Client Retention Through Efficient Brochure Pdf
This slide covers a dashboard for tracking consumer satisfaction with metrics such as customer satisfaction score, customer effort score, net promoter score, average response time, etc. Do you have an important presentation coming up Are you looking for something that will make your presentation stand out from the rest Look no further than Dashboard For Analysing Increasing Client Retention Through Efficient Brochure Pdf. With our professional designs, you can trust that your presentation will pop and make delivering it a smooth process. And with Slidegeeks, you can trust that your presentation will be unique and memorable. So why wait Grab Dashboard For Analysing Increasing Client Retention Through Efficient Brochure Pdf today and make your presentation stand out from the rest. This slide covers a dashboard for tracking consumer satisfaction with metrics such as customer satisfaction score, customer effort score, net promoter score, average response time, etc.
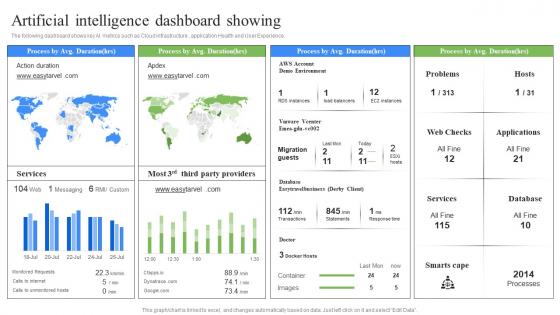
Artificial Intelligence Dashboard Showing RPA Influence On Industries Slides Pdf
The following dashboard shows key AI metrics such as Cloud infrastructure , application Health and User Experience. Create an editable Artificial Intelligence Dashboard Showing RPA Influence On Industries Slides Pdf that communicates your idea and engages your audience. Whether you are presenting a business or an educational presentation, pre-designed presentation templates help save time. Artificial Intelligence Dashboard Showing RPA Influence On Industries Slides Pdf is highly customizable and very easy to edit, covering many different styles from creative to business presentations. Slidegeeks has creative team members who have crafted amazing templates. So, go and get them without any delay. The following dashboard shows key AI metrics such as Cloud infrastructure , application Health and User Experience.
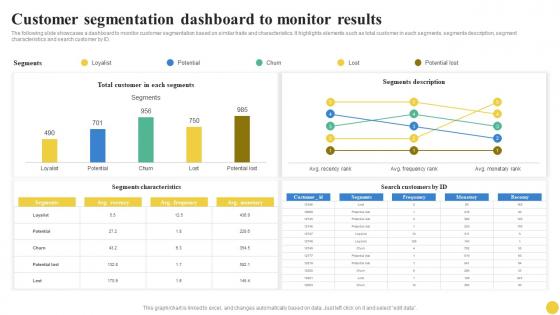
Customer Segmentation Dashboard To Monitor Results User Segmentation Portrait Pdf
The following slide showcases a dashboard to monitor customer segmentation based on similar traits and characteristics. It highlights elements such as total customer in each segments, segments description, segment characteristics and search customer by ID. Get a simple yet stunning designed Customer Segmentation Dashboard To Monitor Results User Segmentation Portrait Pdf. It is the best one to establish the tone in your meetings. It is an excellent way to make your presentations highly effective. So, download this PPT today from Slidegeeks and see the positive impacts. Our easy-to-edit Customer Segmentation Dashboard To Monitor Results User Segmentation Portrait Pdf can be your go-to option for all upcoming conferences and meetings. So, what are you waiting for Grab this template today. The following slide showcases a dashboard to monitor customer segmentation based on similar traits and characteristics. It highlights elements such as total customer in each segments, segments description, segment characteristics and search customer by ID.
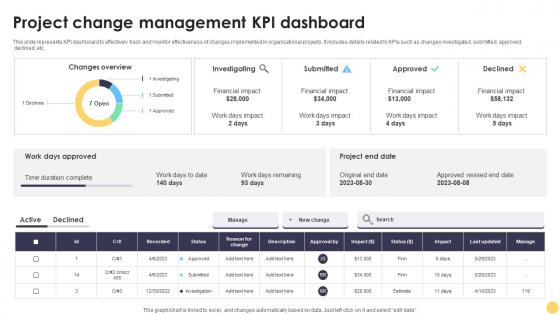
Project Change Management Kpi Dashboard Digital Project Management Strategies
This slide represents KPI dashboard to effectively track and monitor effectiveness of changes implemented in organizational projects. It includes details related to KPIs such as changes investigated, submitted, approved, declined, etc. Do you have to make sure that everyone on your team knows about any specific topic I yes, then you should give Project Change Management Kpi Dashboard Digital Project Management Strategies a try. Our experts have put a lot of knowledge and effort into creating this impeccable Project Change Management Kpi Dashboard Digital Project Management Strategies. You can use this template for your upcoming presentations, as the slides are perfect to represent even the tiniest detail. You can download these templates from the Slidegeeks website and these are easy to edit. So grab these today This slide represents KPI dashboard to effectively track and monitor effectiveness of changes implemented in organizational projects. It includes details related to KPIs such as changes investigated, submitted, approved, declined, etc.
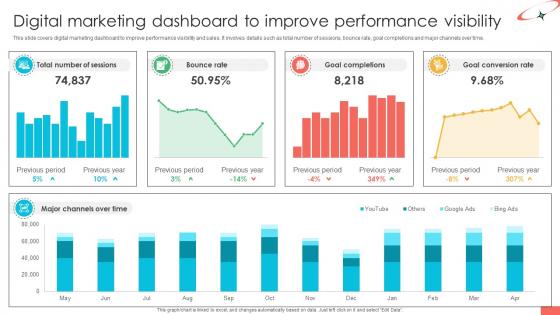
Marketing Strategies For Effective Digital Marketing Dashboard To Improve
This slide covers digital marketing dashboard to improve performance visibility and sales. It involves details such as total number of sessions, bounce rate, goal completions and major channels over time. Do you have an important presentation coming up Are you looking for something that will make your presentation stand out from the rest Look no further than Marketing Strategies For Effective Digital Marketing Dashboard To Improve. With our professional designs, you can trust that your presentation will pop and make delivering it a smooth process. And with Slidegeeks, you can trust that your presentation will be unique and memorable. So why wait Grab Marketing Strategies For Effective Digital Marketing Dashboard To Improve today and make your presentation stand out from the rest This slide covers digital marketing dashboard to improve performance visibility and sales. It involves details such as total number of sessions, bounce rate, goal completions and major channels over time.
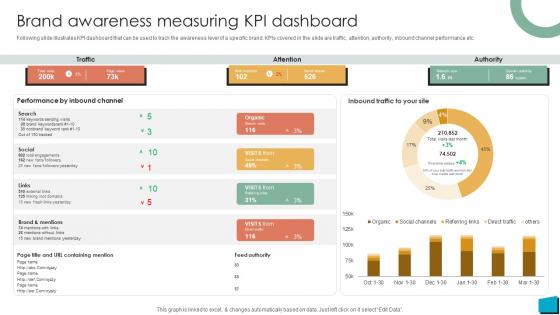
Brand Authority Brand Awareness Measuring KPI Dashboard Strategy SS V
Following slide illustrates KPI dashboard that can be used to track the awareness level of a specific brand. KPIs covered in the slide are traffic, attention, authority, inbound channel performance etc. Do you have to make sure that everyone on your team knows about any specific topic I yes, then you should give Brand Authority Brand Awareness Measuring KPI Dashboard Strategy SS V a try. Our experts have put a lot of knowledge and effort into creating this impeccable Brand Authority Brand Awareness Measuring KPI Dashboard Strategy SS V. You can use this template for your upcoming presentations, as the slides are perfect to represent even the tiniest detail. You can download these templates from the Slidegeeks website and these are easy to edit. So grab these today Following slide illustrates KPI dashboard that can be used to track the awareness level of a specific brand. KPIs covered in the slide are traffic, attention, authority, inbound channel performance etc.
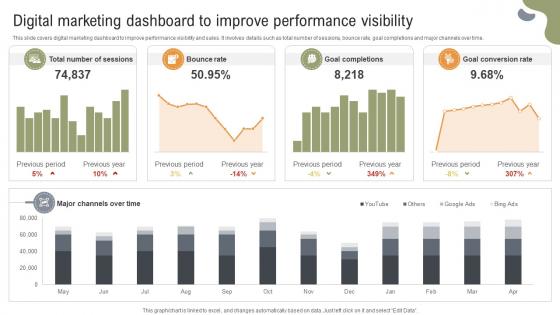
Implementing Strategies To Enhance Digital Marketing Dashboard To Improve Performance
This slide covers digital marketing dashboard to improve performance visibility and sales. It involves details such as total number of sessions, bounce rate, goal completions and major channels over time. Do you have an important presentation coming up Are you looking for something that will make your presentation stand out from the rest Look no further than Implementing Strategies To Enhance Digital Marketing Dashboard To Improve Performance. With our professional designs, you can trust that your presentation will pop and make delivering it a smooth process. And with Slidegeeks, you can trust that your presentation will be unique and memorable. So why wait Grab Implementing Strategies To Enhance Digital Marketing Dashboard To Improve Performance today and make your presentation stand out from the rest This slide covers digital marketing dashboard to improve performance visibility and sales. It involves details such as total number of sessions, bounce rate, goal completions and major channels over time.
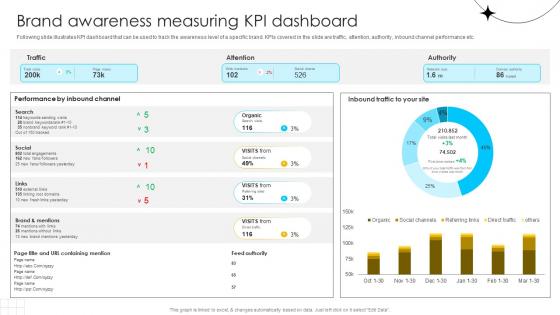
Brand Influence Brand Awareness Measuring KPI Dashboard Strategy SS V
Following slide illustrates KPI dashboard that can be used to track the awareness level of a specific brand. KPIs covered in the slide are traffic, attention, authority, inbound channel performance etc. Do you have to make sure that everyone on your team knows about any specific topic I yes, then you should give Brand Influence Brand Awareness Measuring KPI Dashboard Strategy SS V a try. Our experts have put a lot of knowledge and effort into creating this impeccable Brand Influence Brand Awareness Measuring KPI Dashboard Strategy SS V. You can use this template for your upcoming presentations, as the slides are perfect to represent even the tiniest detail. You can download these templates from the Slidegeeks website and these are easy to edit. So grab these today Following slide illustrates KPI dashboard that can be used to track the awareness level of a specific brand. KPIs covered in the slide are traffic, attention, authority, inbound channel performance etc.
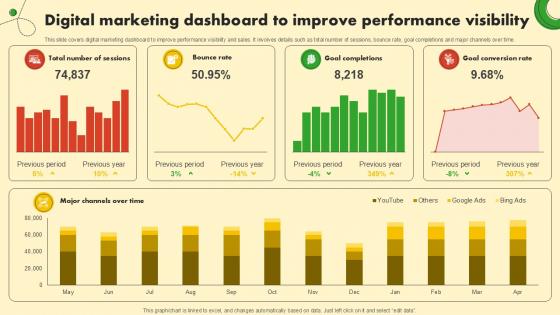
Digital Marketing Dashboard To Food And Grocery Retail Ppt Slide
This slide covers digital marketing dashboard to improve performance visibility and sales. It involves details such as total number of sessions, bounce rate, goal completions and major channels over time. Do you have an important presentation coming up Are you looking for something that will make your presentation stand out from the rest Look no further than Digital Marketing Dashboard To Food And Grocery Retail Ppt Slide. With our professional designs, you can trust that your presentation will pop and make delivering it a smooth process. And with Slidegeeks, you can trust that your presentation will be unique and memorable. So why wait Grab Digital Marketing Dashboard To Food And Grocery Retail Ppt Slide today and make your presentation stand out from the rest This slide covers digital marketing dashboard to improve performance visibility and sales. It involves details such as total number of sessions, bounce rate, goal completions and major channels over time.
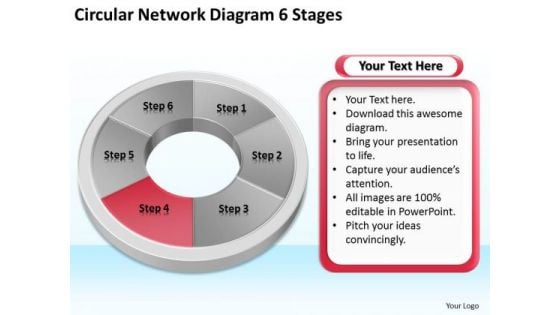
Circular Network Diagram 6 Stages Business Plan For PowerPoint Slides
We present our circular network diagram 6 stages business plan for PowerPoint Slides.Download and present our Process and Flows PowerPoint Templates because Our PowerPoint Templates and Slides will definately Enhance the stature of your presentation. Adorn the beauty of your thoughts with their colourful backgrounds. Download and present our Business PowerPoint Templates because our PowerPoint Templates and Slides are the string of your bow. Fire of your ideas and conquer the podium. Use our Flow Charts PowerPoint Templates because You are well armed with penetrative ideas. Our PowerPoint Templates and Slides will provide the gunpowder you need. Use our Business PowerPoint Templates because Our PowerPoint Templates and Slides are designed to help you succeed. They have all the ingredients you need. Present our Shapes PowerPoint Templates because Our PowerPoint Templates and Slides ensures Effective communication. They help you put across your views with precision and clarity.Use these PowerPoint slides for presentations relating to Pie, chart, business, concept, success, icon, account, market, isolated, slice, economy, presentation, diagram, circle, wealth, percentage, graphic,finance, data, report, marketing, analyzing, accounting, partition, management, graph, illustration, earnings, piece, strategy, money, planning, growth, progress,profit, part, information, investment, improvement, statistic, financial, measure, six, savings, performance. The prominent colors used in the PowerPoint template are Red, Gray, White. Crush your competition with our Circular Network Diagram 6 Stages Business Plan For PowerPoint Slides. Just download, type and present.
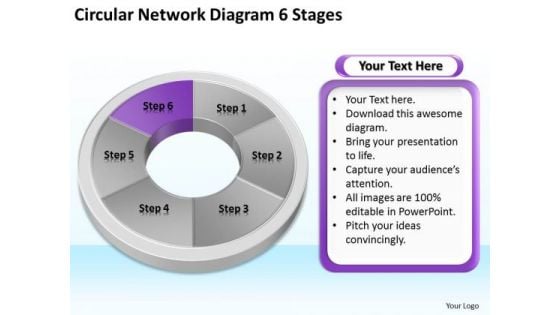
Circular Network Diagram 6 Stages Business Plan PowerPoint Slides
We present our circular network diagram 6 stages business plan PowerPoint Slides.Download our Circle Charts PowerPoint Templates because You have a driving passion to excel in your field. Our PowerPoint Templates and Slides will prove ideal vehicles for your ideas. Download our Business PowerPoint Templates because Our PowerPoint Templates and Slides are created with admirable insight. Use them and give your group a sense of your logical mind. Download and present our Process and Flows PowerPoint Templates because Our PowerPoint Templates and Slides will provide you the cutting edge. Slice through the doubts in the minds of your listeners. Present our Marketing PowerPoint Templates because Our PowerPoint Templates and Slides will fulfill your every need. Use them and effectively satisfy the desires of your audience. Present our Success PowerPoint Templates because Our PowerPoint Templates and Slides has conjured up a web of all you need with the help of our great team. Use them to string together your glistening ideas.Use these PowerPoint slides for presentations relating to Pie, chart, business, concept, success, icon, account, market, isolated, slice, economy, presentation, diagram, circle, wealth, percentage, graphic,finance, data, report, marketing, analyzing, accounting, partition, management, graph, illustration, earnings, piece, strategy, money, planning, growth, progress,profit, part, information, investment, improvement, statistic, financial, measure, six, savings, performance. The prominent colors used in the PowerPoint template are Gray, Purple, White. Our Circular Network Diagram 6 Stages Business Plan PowerPoint Slides adhere to democratic culture. They cater for different attitudes and beliefs.
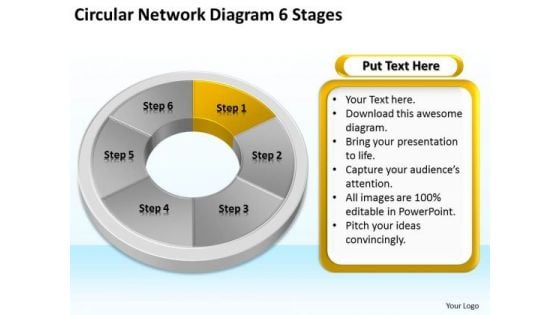
Circular Network Diagram 6 Stages Business Plans That PowerPoint Slides
We present our circular network diagram 6 stages business plans that PowerPoint Slides.Download our Circle Charts PowerPoint Templates because It will Give impetus to the hopes of your colleagues. Our PowerPoint Templates and Slides will aid you in winning their trust. Download and present our Business PowerPoint Templates because It will mark the footprints of your journey. Illustrate how they will lead you to your desired destination. Download our Process and Flows PowerPoint Templates because Our PowerPoint Templates and Slides will bullet point your ideas. See them fall into place one by one. Download our Success PowerPoint Templates because You can Inspire your team with our PowerPoint Templates and Slides. Let the force of your ideas flow into their minds. Download and present our Shapes PowerPoint Templates because Our PowerPoint Templates and Slides are truly out of this world. Even the MIB duo has been keeping tabs on our team.Use these PowerPoint slides for presentations relating to Pie, chart, business, concept, success, icon, account, market, isolated, slice, economy, presentation, diagram, circle, wealth, percentage, graphic,finance, data, report, marketing, analyzing, accounting, partition, management, graph, illustration, earnings, piece, strategy, money, planning, growth, progress,profit, part, information, investment, improvement, statistic, financial, measure, six, savings, performance. The prominent colors used in the PowerPoint template are White, Gray, Yellow. Filter out ideas with our Circular Network Diagram 6 Stages Business Plans That PowerPoint Slides. They get actionable ones to emerge.

Circular Network Diagram 6 Stages Step By Business Plan Template PowerPoint Slides
We present our circular network diagram 6 stages step by business plan template PowerPoint Slides.Download and present our Circle Charts PowerPoint Templates because Our PowerPoint Templates and Slides will give good value for money. They also have respect for the value of your time. Use our Flow Charts PowerPoint Templates because Our PowerPoint Templates and Slides are Clear and concise. Use them and dispel any doubts your team may have. Download and present our Business PowerPoint Templates because our PowerPoint Templates and Slides are the string of your bow. Fire of your ideas and conquer the podium. Use our Process and Flows PowerPoint Templates because You can Connect the dots. Fan expectations as the whole picture emerges. Download our Marketing PowerPoint Templates because It will Strengthen your hand with your thoughts. They have all the aces you need to win the day.Use these PowerPoint slides for presentations relating to Pie, chart, business, concept, success, icon, account, market, isolated, slice, economy, presentation, diagram, circle, wealth, percentage, graphic,finance, data, report, marketing, analyzing, accounting, partition, management, graph, illustration, earnings, piece, strategy, money, planning, growth, progress,profit, part, information, investment, improvement, statistic, financial, measure, six, savings, performance. The prominent colors used in the PowerPoint template are Pink, Gray, White. Become an oracle with our Circular Network Diagram 6 Stages Step By Business Plan Template PowerPoint Slides. You will come out on top.
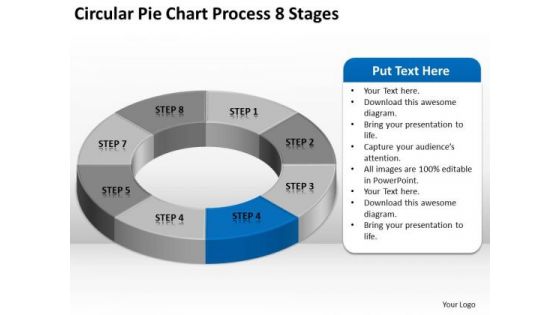
Circular Pie Chart Process 8 Stages Business Plan PowerPoint Slide
We present our circular pie chart process 8 stages business plan PowerPoint Slide.Download our Marketing PowerPoint Templates because Our PowerPoint Templates and Slides are designed to help you succeed. They have all the ingredients you need. Download our Finance PowerPoint Templates because Our PowerPoint Templates and Slides are the chords of your song. String them along and provide the lilt to your views. Present our Business PowerPoint Templates because Our PowerPoint Templates and Slides are the chords of your song. String them along and provide the lilt to your views. Use our Circle Charts PowerPoint Templates because Our PowerPoint Templates and Slides will provide weight to your words. They will bring out the depth of your thought process. Present our Shapes PowerPoint Templates because Our PowerPoint Templates and Slides are created with admirable insight. Use them and give your group a sense of your logical mind.Use these PowerPoint slides for presentations relating to Chart, Pie, Graph, Vector, 3d, Icon, Diagram, Progress, Business, Circular, Design, Information, Market, Opinion, Corporate, Sign, Symbol, Shadow, Percentage, Graphic, Finance, Data, Element, Drawing, Report, Marketing, Shape, Illustration, Earnings, Number, Strategy, Money, Dimensional, Survey, Growth, Colorful, Global, Account, Part, Investment, Statistic, Financial. The prominent colors used in the PowerPoint template are Blue, Gray, White. Commence the festivity with our Circular Pie Chart Process 8 Stages Business Plan PowerPoint Slide. Put them all in a celeberatory mood.
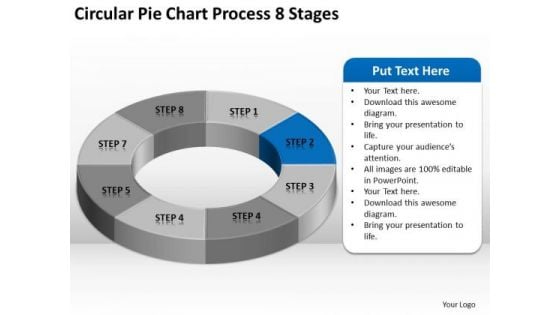
Circular Pie Chart Process 8 Stages Business Plan PowerPoint Slides
We present our circular pie chart process 8 stages business plan PowerPoint Slides.Download our Marketing PowerPoint Templates because Our PowerPoint Templates and Slides are designed to help you succeed. They have all the ingredients you need. Use our Finance PowerPoint Templates because It can be used to Set your controls for the heart of the sun. Our PowerPoint Templates and Slides will be the propellant to get you there. Download our Business PowerPoint Templates because It can Leverage your style with our PowerPoint Templates and Slides. Charm your audience with your ability. Use our Circle Charts PowerPoint Templates because you should once Tap the ingenuity of our PowerPoint Templates and Slides. They are programmed to succeed. Download our Shapes PowerPoint Templates because You can Hit the nail on the head with our PowerPoint Templates and Slides. Embed your ideas in the minds of your audience.Use these PowerPoint slides for presentations relating to Chart, Pie, Graph, Vector, 3d, Icon, Diagram, Progress, Business, Circular, Design, Information, Market, Opinion, Corporate, Sign, Symbol, Shadow, Percentage, Graphic, Finance, Data, Element, Drawing, Report, Marketing, Shape, Illustration, Earnings, Number, Strategy, Money, Dimensional, Survey, Growth, Colorful, Global, Account, Part, Investment, Statistic, Financial. The prominent colors used in the PowerPoint template are Blue, Gray, White. Start accelerating revenue growth with our Circular Pie Chart Process 8 Stages Business Plan PowerPoint Slides. They will make you look good.
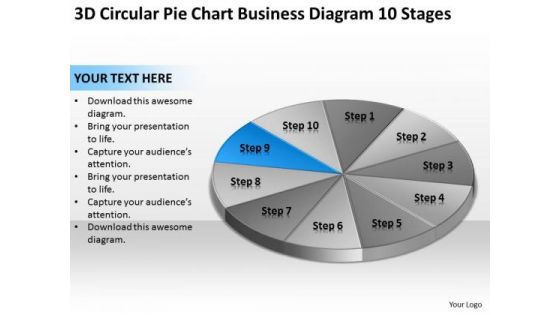
3d Circular Pie Chart Business Diagram 10 Stages Ppt Plan PowerPoint Templates
We present our 3d circular pie chart business diagram 10 stages ppt plan PowerPoint templates.Use our Flow Charts PowerPoint Templates because You are an avid believer in ethical practices. Highlight the benefits that accrue with our PowerPoint Templates and Slides. Present our Marketing PowerPoint Templates because Your ideas provide food for thought. Our PowerPoint Templates and Slides will help you create a dish to tickle the most discerning palate. Download our Shapes PowerPoint Templates because You can Channelise the thoughts of your team with our PowerPoint Templates and Slides. Urge them to focus on the goals you have set. Use our Business PowerPoint Templates because It can be used to Set your controls for the heart of the sun. Our PowerPoint Templates and Slides will be the propellant to get you there. Download and present our Process and Flows PowerPoint Templates because Our PowerPoint Templates and Slides will help you be quick off the draw. Just enter your specific text and see your points hit home.Use these PowerPoint slides for presentations relating to Market, slice,business, concept, sign, render, symbol, shadow, diagram, commercial, percentage, occupation, graphic, finance, data,dollar, bank, report, marketing, trading, tones, price, abstract, graph, icon, economic, piece, pie, chart, number, money, currency, making, representative,background, investment, improvement, banking, economical, reflect, results. The prominent colors used in the PowerPoint template are Gray, Blue, White. Everybody needs somebody. Our 3d Circular Pie Chart Business Diagram 10 Stages Ppt Plan PowerPoint Templates will befriend your thoughts.
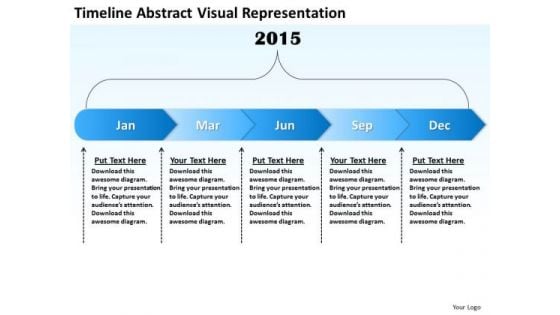
Business Process Flow Diagrams Timeline Abstract Visual Representation Ppt PowerPoint Slides
We present our business process flow diagrams timeline abstract visual representation ppt PowerPoint Slides.Use our Business PowerPoint Templates because Our PowerPoint Templates and Slides will give you great value for your money. Be assured of finding the best projection to highlight your words. Download and present our Process and Flows PowerPoint Templates because Our PowerPoint Templates and Slides will fulfill your every need. Use them and effectively satisfy the desires of your audience. Download our Shapes PowerPoint Templates because Our PowerPoint Templates and Slides help you pinpoint your timelines. Highlight the reasons for your deadlines with their use. Download our Arrows PowerPoint Templates because Our PowerPoint Templates and Slides are designed to help you succeed. They have all the ingredients you need. Use our Shapes PowerPoint Templates because Our PowerPoint Templates and Slides has conjured up a web of all you need with the help of our great team. Use them to string together your glistening ideas.Use these PowerPoint slides for presentations relating to abstract, algorithm, algorithmic, analysis, analyze, chart, cluster, clustering, connections, data, dataset, decision, depth, edge, elements, else, equal, graph, layers, level, messaging, mining,multiple, networking, nodes, objects, parent, path, pen, representation, root, route, routing, sampling, science, scientific, social, structure, subset, system, technology, traverse, visual. The prominent colors used in the PowerPoint template are Blue, Blue light, White. Be a peak performer with our Business Process Flow Diagrams Timeline Abstract Visual Representation Ppt PowerPoint Slides. They will make you look good.
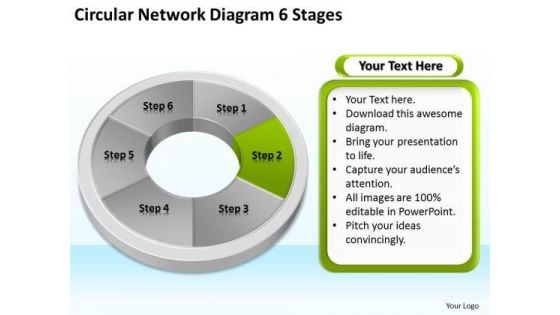
Circular Network Diagram 6 Stages Sales Business Plan Outline PowerPoint Slides
We present our circular network diagram 6 stages sales business plan outline PowerPoint Slides.Download our Process and Flows PowerPoint Templates because You can Zap them with our PowerPoint Templates and Slides. See them reel under the impact. Download and present our Business PowerPoint Templates because You have the co-ordinates for your destination of success. Let our PowerPoint Templates and Slides map out your journey. Present our Marketing PowerPoint Templates because Our PowerPoint Templates and Slides are aesthetically designed to attract attention. We gaurantee that they will grab all the eyeballs you need. Use our Business PowerPoint Templates because You can Be the star of the show with our PowerPoint Templates and Slides. Rock the stage with your ideas. Use our Success PowerPoint Templates because You are an avid believer in ethical practices. Highlight the benefits that accrue with our PowerPoint Templates and Slides.Use these PowerPoint slides for presentations relating to Pie, chart, business, concept, success, icon, account, market, isolated, slice, economy, presentation, diagram, circle, wealth, percentage, graphic,finance, data, report, marketing, analyzing, accounting, partition, management, graph, illustration, earnings, piece, strategy, money, planning, growth, progress,profit, part, information, investment, improvement, statistic, financial, measure, six, savings, performance. The prominent colors used in the PowerPoint template are Green lime, White, Gray. Earn the credits you do deserve. Answer the critics with our Circular Network Diagram 6 Stages Sales Business Plan Outline PowerPoint Slides.
Brand Podcast Performance Tracking Dashboards Comprehensive Guide Mockup Pdf
This slide showcases dashboard used to track the performance of podcast produced by brands as part of storytelling marketing campaign. It tracks listeners, number of plays, new followers, time-listened, top performing episode and top cities. Presenting this PowerPoint presentation, titled Brand Podcast Performance Tracking Dashboards Comprehensive Guide Mockup Pdf with topics curated by our researchers after extensive research. This editable presentation is available for immediate download and provides attractive features when used. Download now and captivate your audience. Presenting this Brand Podcast Performance Tracking Dashboards Comprehensive Guide Mockup Pdf Our researchers have carefully researched and created these slides with all aspects taken into consideration. This is a completely customizable Brand Podcast Performance Tracking Dashboards Comprehensive Guide Mockup Pdf that is available for immediate downloading. Download now and make an impact on your audience. Highlight the attractive features available with our PPTs. This slide showcases dashboard used to track the performance of podcast produced by brands as part of storytelling marketing campaign. It tracks listeners, number of plays, new followers, time-listened, top performing episode and top cities.
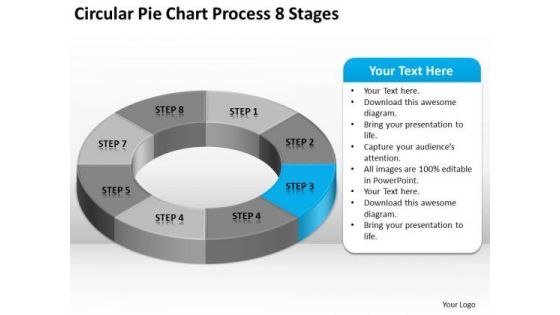
Circular Pie Chart Process 8 Stages Business Plan Forms PowerPoint Slides
We present our circular pie chart process 8 stages business plan forms PowerPoint Slides.Download our Marketing PowerPoint Templates because Our PowerPoint Templates and Slides will give good value for money. They also have respect for the value of your time. Download and present our Finance PowerPoint Templates because Our PowerPoint Templates and Slides will help you be quick off the draw. Just enter your specific text and see your points hit home. Download our Business PowerPoint Templates because Our PowerPoint Templates and Slides will generate and maintain the level of interest you desire. They will create the impression you want to imprint on your audience. Download and present our Circle Charts PowerPoint Templates because You have gained great respect for your brilliant ideas. Use our PowerPoint Templates and Slides to strengthen and enhance your reputation. Present our Shapes PowerPoint Templates because They will Put the wind in your sails. Skim smoothly over the choppy waters of the market.Use these PowerPoint slides for presentations relating to Chart, Pie, Graph, Vector, 3d, Icon, Diagram, Progress, Business, Circular, Design, Information, Market, Opinion, Corporate, Sign, Symbol, Shadow, Percentage, Graphic, Finance, Data, Element, Drawing, Report, Marketing, Shape, Illustration, Earnings, Number, Strategy, Money, Dimensional, Survey, Growth, Colorful, Global, Account, Part, Investment, Statistic, Financial. The prominent colors used in the PowerPoint template are Blue light, Gray, White. Get the largest value at the lowest price with our Circular Pie Chart Process 8 Stages Business Plan Forms PowerPoint Slides. Dont waste time struggling with PowerPoint. Let us do it for you.
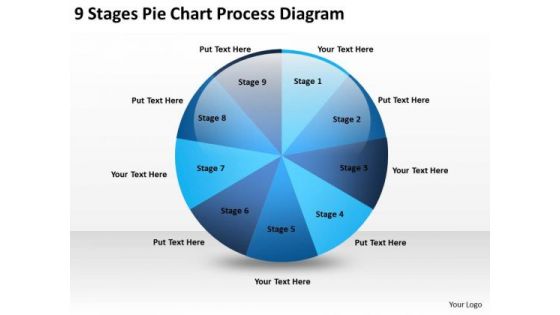
9 Stages Pie Chart Process Diagram How Do You Write Business Plan PowerPoint Slides
We present our 9 stages pie chart process diagram how do you write business plan PowerPoint Slides.Present our Process and Flows PowerPoint Templates because You can Zap them with our PowerPoint Templates and Slides. See them reel under the impact. Use our Circle Charts PowerPoint Templates because You can Create a matrix with our PowerPoint Templates and Slides. Feel the strength of your ideas click into place. Use our Business PowerPoint Templates because Our PowerPoint Templates and Slides are designed to help you succeed. They have all the ingredients you need. Present our Success PowerPoint Templates because Your audience will believe you are the cats whiskers. Download our Future PowerPoint Templates because Our PowerPoint Templates and Slides will give you great value for your money. Be assured of finding the best projection to highlight your words. Use these PowerPoint slides for presentations relating to Pie, chart, business, market, slice, isometric, display, perspective, green, corporate, blank, concept, sign, presentation, symbol, diagram,circle, graphic, finance, data, stock, element, bank, report, marketing, abstract, management, graph, modern, illustration, icon, motion, company,organization, information, environment, banking, financial. The prominent colors used in the PowerPoint template are Blue, Blue light, Blue navy. Add class with our 9 Stages Pie Chart Process Diagram How Do You Write Business Plan PowerPoint Slides. You will come out on top.
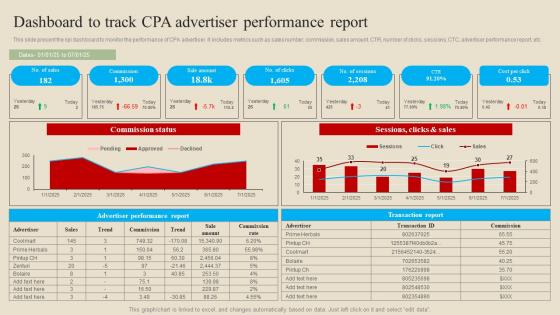
Dashboard To Track CPA Introduction And Implementation Procedure Background Pdf
This slide present the kpi dashboard to monitor the performance of CPA advertiser. It includes metrics such as sales number, commission, sales amount, CTR, number of clicks, sessions, CTC, advertiser performance report, etc. Present like a pro with Dashboard To Track CPA Introduction And Implementation Procedure Background Pdf Create beautiful presentations together with your team, using our easy to use presentation slides. Share your ideas in real time and make changes on the fly by downloading our templates. So whether you are in the office, on the go, or in a remote location, you can stay in sync with your team and present your ideas with confidence. With Slidegeeks presentation got a whole lot easier. Grab these presentations today. This slide present the kpi dashboard to monitor the performance of CPA advertiser. It includes metrics such as sales number, commission, sales amount, CTR, number of clicks, sessions, CTC, advertiser performance report, etc.
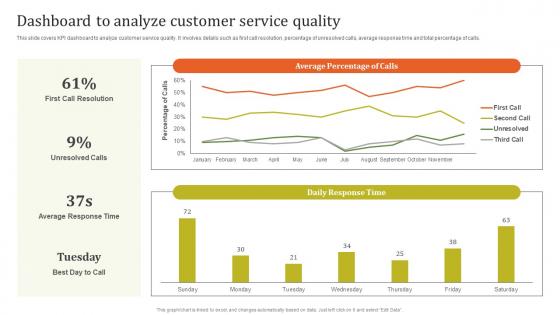
Dashboard To Analyze Customer Executing Effective Quality Enhancement Mockup Pdf
This slide covers KPI dashboard to analyze customer service quality. It involves details such as first call resolution, percentage of unresolved calls, average response time and total percentage of calls. From laying roadmaps to briefing everything in detail, our templates are perfect for you. You can set the stage with your presentation slides. All you have to do is download these easy to edit and customizable templates. Dashboard To Analyze Customer Executing Effective Quality Enhancement Mockup Pdf will help you deliver an outstanding performance that everyone would remember and praise you for. Do download this presentation today. This slide covers KPI dashboard to analyze customer service quality. It involves details such as first call resolution, percentage of unresolved calls, average response time and total percentage of calls.
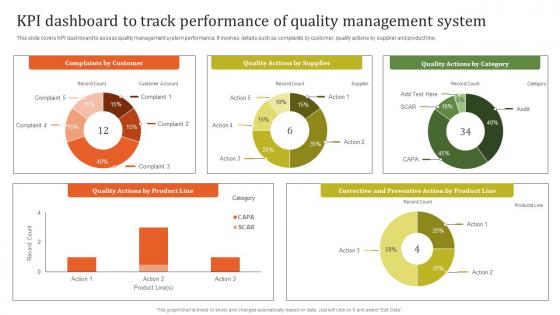
KPI Dashboard To Track Executing Effective Quality Enhancement Slides Pdf
This slide covers KPI dashboard to assess quality management system performance. It involves details such as complaints by customer, quality actions by supplier and product line. Slidegeeks is one of the best resources for PowerPoint templates. You can download easily and regulate KPI Dashboard To Track Executing Effective Quality Enhancement Slides Pdf for your personal presentations from our wonderful collection. A few clicks is all it takes to discover and get the most relevant and appropriate templates. Use our Templates to add a unique zing and appeal to your presentation and meetings. All the slides are easy to edit and you can use them even for advertisement purposes. This slide covers KPI dashboard to assess quality management system performance. It involves details such as complaints by customer, quality actions by supplier and product line.
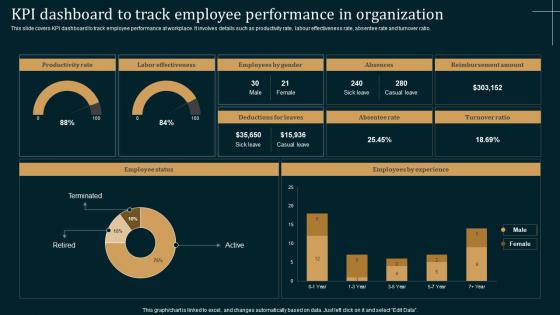
Employee Performance Improvement Strategies KPI Dashboard Track Employee Guidelines Pdf
This slide covers KPI dashboard to track employee performance at workplace. It involves details such as productivity rate, labour effectiveness rate, absentee rate and turnover ratio. Slidegeeks is here to make your presentations a breeze with Employee Performance Improvement Strategies KPI Dashboard Track Employee Guidelines Pdf With our easy to use and customizable templates, you can focus on delivering your ideas rather than worrying about formatting. With a variety of designs to choose from, you are sure to find one that suits your needs. And with animations and unique photos, illustrations, and fonts, you can make your presentation pop. So whether you are giving a sales pitch or presenting to the board, make sure to check out Slidegeeks first This slide covers KPI dashboard to track employee performance at workplace. It involves details such as productivity rate, labour effectiveness rate, absentee rate and turnover ratio.
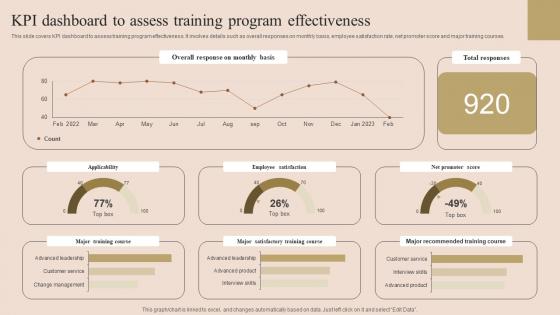
KPI Dashboard To Assess Employee Performance Improvement Techniques Ideas Pdf
This slide covers KPI dashboard to assess training program effectiveness. It involves details such as overall responses on monthly basis, employee satisfaction rate, net promoter score and major training courses. Welcome to our selection of the KPI Dashboard To Assess Employee Performance Improvement Techniques Ideas Pdf. These are designed to help you showcase your creativity and bring your sphere to life. Planning and Innovation are essential for any business that is just starting out. This collection contains the designs that you need for your everyday presentations. All of our PowerPoints are 100 percent editable, so you can customize them to suit your needs. This multi purpose template can be used in various situations. Grab these presentation templates today This slide covers KPI dashboard to assess training program effectiveness. It involves details such as overall responses on monthly basis, employee satisfaction rate, net promoter score and major training courses.
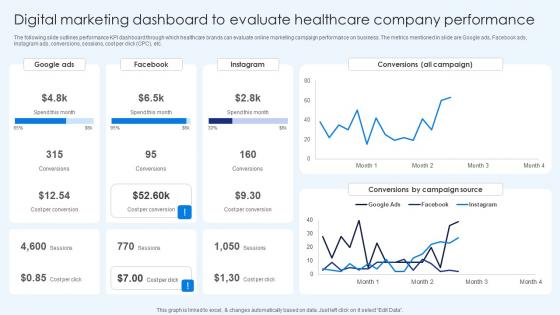
Digital Marketing Dashboard To Evaluate Healthcare Promotion Introduction Pdf
The following slide outlines performance KPI dashboard through which healthcare brands can evaluate online marketing campaign performance on business. The metrics mentioned in slide are Google ads, Facebook ads, Instagram ads, conversions, sessions, cost per click CPC, etc. Present like a pro with Digital Marketing Dashboard To Evaluate Healthcare Promotion Introduction Pdf Create beautiful presentations together with your team, using our easy-to-use presentation slides. Share your ideas in real-time and make changes on the fly by downloading our templates. So whether you are in the office, on the go, or in a remote location, you can stay in sync with your team and present your ideas with confidence. With Slidegeeks presentation got a whole lot easier. Grab these presentations today. The following slide outlines performance KPI dashboard through which healthcare brands can evaluate online marketing campaign performance on business. The metrics mentioned in slide are Google ads, Facebook ads, Instagram ads, conversions, sessions, cost per click CPC, etc.
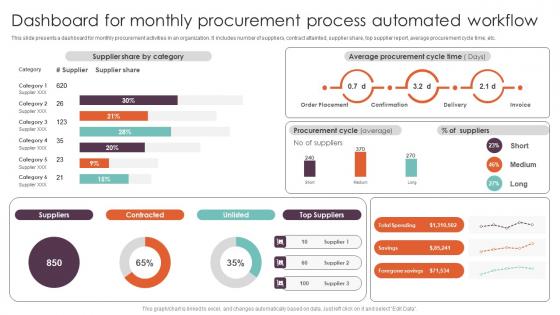
Dashboard For Monthly Procurement Process Techniques Executing Workflow Guidelines Pdf
This slide presents a dashboard for monthly procurement activities in an organization. It includes number of suppliers, contract attainted, supplier share, top supplier report, average procurement cycle time, etc. Present like a pro with Dashboard For Monthly Procurement Process Techniques Executing Workflow Guidelines Pdf Create beautiful presentations together with your team, using our easy-to-use presentation slides. Share your ideas in real-time and make changes on the fly by downloading our templates. So whether you are in the office, on the go, or in a remote location, you can stay in sync with your team and present your ideas with confidence. With Slidegeeks presentation got a whole lot easier. Grab these presentations today. This slide presents a dashboard for monthly procurement activities in an organization. It includes number of suppliers, contract attainted, supplier share, top supplier report, average procurement cycle time, etc.
Enhancing Global Presence Dashboard For Tracking Post Expansion Formats Pdf
This slide covers the dashboard for analyzing fast food business sales by region. It includes KPIs such as sales, sales target, target achievement, gross profit, gross profit margin, sales by channels, sales growth, etc.If your project calls for a presentation, then Slidegeeks is your go-to partner because we have professionally designed, easy-to-edit templates that are perfect for any presentation. After downloading, you can easily edit Enhancing Global Presence Dashboard For Tracking Post Expansion Formats Pdf and make the changes accordingly. You can rearrange slides or fill them with different images. Check out all the handy templates This slide covers the dashboard for analyzing fast food business sales by region. It includes KPIs such as sales, sales target, target achievement, gross profit, gross profit margin, sales by channels, sales growth, etc.
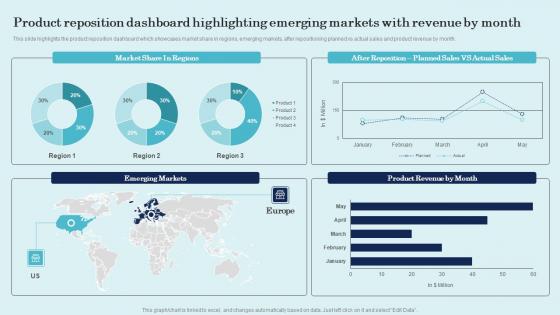
Product Reposition Dashboard Highlighting Emerging Product Repositioning Technique Pictures Pdf
This slide highlights the product reposition dashboard which showcases market share in regions, emerging markets, after repositioning planned vs actual sales and product revenue by month. Welcome to our selection of the Product Reposition Dashboard Highlighting Emerging Product Repositioning Technique Pictures Pdf. These are designed to help you showcase your creativity and bring your sphere to life. Planning and Innovation are essential for any business that is just starting out. This collection contains the designs that you need for your everyday presentations. All of our PowerPoints are 100 percent editable, so you can customize them to suit your needs. This multi-purpose template can be used in various situations. Grab these presentation templates today. This slide highlights the product reposition dashboard which showcases market share in regions, emerging markets, after repositioning planned vs actual sales and product revenue by month.
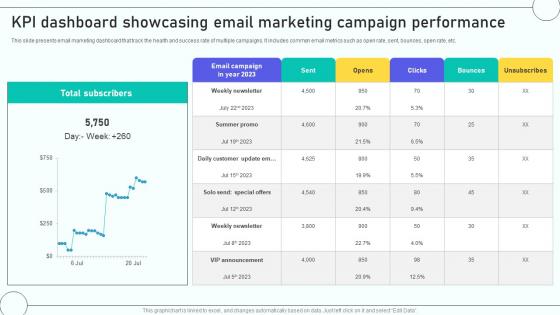
Email Marketing Automation Process KPI Dashboard Showcasing Email Marketing
This slide presents email marketing dashboard that track the health and success rate of multiple campaigns. It includes common email metrics such as open rate, sent, bounces, open rate, etc. Welcome to our selection of the Email Marketing Automation Process KPI Dashboard Showcasing Email Marketing. These are designed to help you showcase your creativity and bring your sphere to life. Planning and Innovation are essential for any business that is just starting out. This collection contains the designs that you need for your everyday presentations. All of our PowerPoints are 100 percent editable, so you can customize them to suit your needs. This multi-purpose template can be used in various situations. Grab these presentation templates today. This slide presents email marketing dashboard that track the health and success rate of multiple campaigns. It includes common email metrics such as open rate, sent, bounces, open rate, etc.
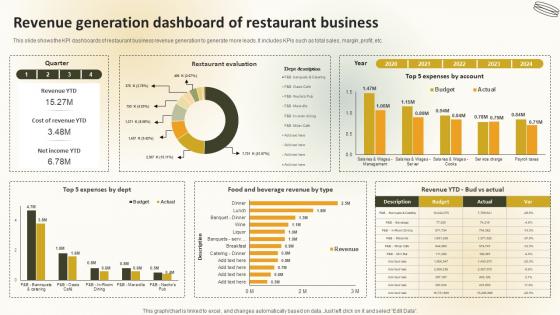
Revenue Generation Dashboard Of Restaurant Business Create An Effective Restaurant
This slide shows the KPI dashboards of restaurant business revenue generation to generate more leads. It includes KPIs such as total sales, margin,profit, etc. Present like a pro with Revenue Generation Dashboard Of Restaurant Business Create An Effective Restaurant. Create beautiful presentations together with your team, using our easy-to-use presentation slides. Share your ideas in real-time and make changes on the fly by downloading our templates. So whether you are in the office, on the go, or in a remote location, you can stay in sync with your team and present your ideas with confidence. With Slidegeeks presentation got a whole lot easier. Grab these presentations today. This slide shows the KPI dashboards of restaurant business revenue generation to generate more leads. It includes KPIs such as total sales, margin,profit, etc.
CASB 2 0 IT CASB Performance Tracking Dashboard
This slide outlines the performance tracking dashboard for CASB deployment. The purpose of this slide is to showcase the status of various applications, IP addresses, users, machines, and web traffic. It also includes cloud discovery open alerts, risk levels, and top entities. If your project calls for a presentation, then Slidegeeks is your go-to partner because we have professionally designed, easy-to-edit templates that are perfect for any presentation. After downloading, you can easily edit CASB 2 0 IT CASB Performance Tracking Dashboard and make the changes accordingly. You can rearrange slides or fill them with different images. Check out all the handy templates This slide outlines the performance tracking dashboard for CASB deployment. The purpose of this slide is to showcase the status of various applications, IP addresses, users, machines, and web traffic. It also includes cloud discovery open alerts, risk levels, and top entities.

Create A Restaurant Marketing Revenue Generation Dashboard Of Restaurant
This slide shows the KPI dashboards of restaurant business revenue generation to generate more leads. It includes KPIs such as total sales, margin ,profit, etc. Present like a pro with Create A Restaurant Marketing Revenue Generation Dashboard Of Restaurant. Create beautiful presentations together with your team, using our easy-to-use presentation slides. Share your ideas in real-time and make changes on the fly by downloading our templates. So whether you are in the office, on the go, or in a remote location, you can stay in sync with your team and present your ideas with confidence. With Slidegeeks presentation got a whole lot easier. Grab these presentations today. This slide shows the KPI dashboards of restaurant business revenue generation to generate more leads. It includes KPIs such as total sales, margin ,profit, etc.
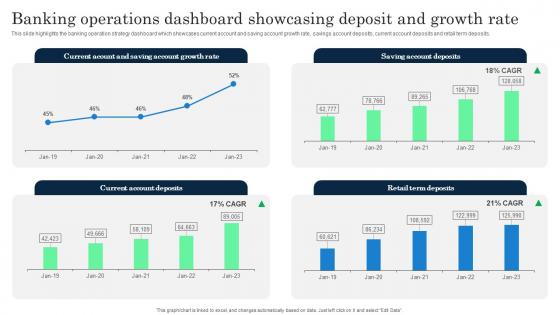
Banking Operations Dashboard Showcasing Deposit Incorporating Banking Operational Growth
This slide highlights the banking operation strategy dashboard which showcases current account and saving account growth rate, savings account deposits, current account deposits and retail term deposits. Slidegeeks is one of the best resources for PowerPoint templates. You can download easily and regulate Banking Operations Dashboard Showcasing Deposit Incorporating Banking Operational Growth for your personal presentations from our wonderful collection. A few clicks is all it takes to discover and get the most relevant and appropriate templates. Use our Templates to add a unique zing and appeal to your presentation and meetings. All the slides are easy to edit and you can use them even for advertisement purposes. This slide highlights the banking operation strategy dashboard which showcases current account and saving account growth rate, savings account deposits, current account deposits and retail term deposits.
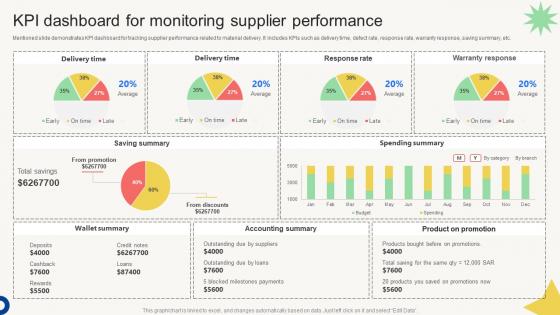
Vendor Management Audit KPI Dashboard For Monitoring Supplier Performance
Mentioned slide demonstrates KPI dashboard for tracking supplier performance related to material delivery. It includes KPIs such as delivery time, defect rate, response rate, warranty response, saving summary, etc. This modern and well-arranged Vendor Management Audit KPI Dashboard For Monitoring Supplier Performance provides lots of creative possibilities. It is very simple to customize and edit with the Powerpoint Software. Just drag and drop your pictures into the shapes. All facets of this template can be edited with Powerpoint, no extra software is necessary. Add your own material, put your images in the places assigned for them, adjust the colors, and then you can show your slides to the world, with an animated slide included. Mentioned slide demonstrates KPI dashboard for tracking supplier performance related to material delivery. It includes KPIs such as delivery time, defect rate, response rate, warranty response, saving summary, etc.
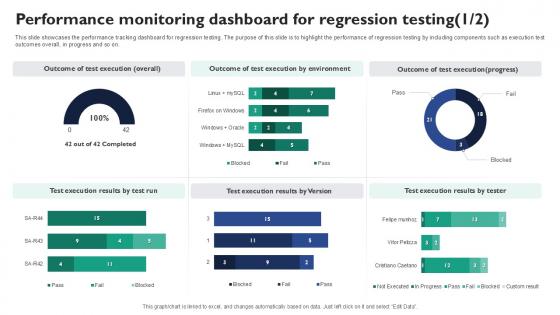
Performance Monitoring Dashboard For Corrective Regression Testing Ppt Example
This slide showcases the performance tracking dashboard for regression testing. The purpose of this slide is to highlight the performance of regression testing by including components such as execution test outcomes overall, in progress and so on. Want to ace your presentation in front of a live audience Our Performance Monitoring Dashboard For Corrective Regression Testing Ppt Example can help you do that by engaging all the users towards you. Slidegeeks experts have put their efforts and expertise into creating these impeccable powerpoint presentations so that you can communicate your ideas clearly. Moreover, all the templates are customizable, and easy-to-edit and downloadable. Use these for both personal and commercial use. This slide showcases the performance tracking dashboard for regression testing. The purpose of this slide is to highlight the performance of regression testing by including components such as execution test outcomes overall, in progress and so on.
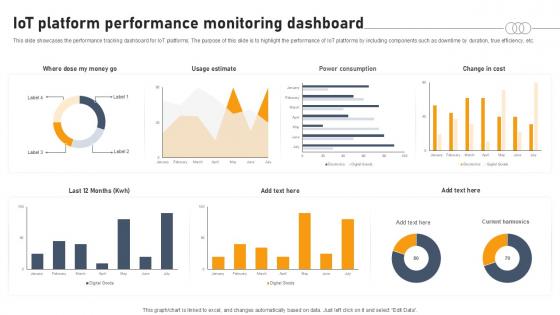
IOT Platform Performance Monitoring Dashboard Aws IOT Platform Ppt Example
This slide showcases the performance tracking dashboard for IoT platforms. The purpose of this slide is to highlight the performance of IoT platforms by including components such as downtime by duration, true efficiency, etc. Present like a pro with IOT Platform Performance Monitoring Dashboard Aws IOT Platform Ppt Example Create beautiful presentations together with your team, using our easy-to-use presentation slides. Share your ideas in real-time and make changes on the fly by downloading our templates. So whether you are in the office, on the go, or in a remote location, you can stay in sync with your team and present your ideas with confidence. With Slidegeeks presentation got a whole lot easier. Grab these presentations today. This slide showcases the performance tracking dashboard for IoT platforms. The purpose of this slide is to highlight the performance of IoT platforms by including components such as downtime by duration, true efficiency, etc.
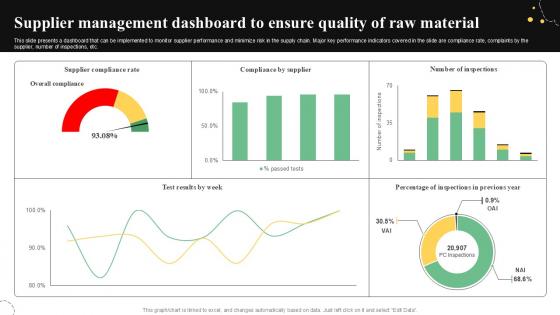
Supplier Management Dashboard Quality Control Guide For Food PPT Sample
This slide presents a dashboard that can be implemented to monitor supplier performance and minimize risk in the supply chain. Major key performance indicators covered in the slide are compliance rate, complaints by the supplier, number of inspections, etc. Present like a pro with Supplier Management Dashboard Quality Control Guide For Food PPT Sample. Create beautiful presentations together with your team, using our easy-to-use presentation slides. Share your ideas in real-time and make changes on the fly by downloading our templates. So whether you are in the office, on the go, or in a remote location, you can stay in sync with your team and present your ideas with confidence. With Slidegeeks presentation got a whole lot easier. Grab these presentations today. This slide presents a dashboard that can be implemented to monitor supplier performance and minimize risk in the supply chain. Major key performance indicators covered in the slide are compliance rate, complaints by the supplier, number of inspections, etc.

Customer Segmentation Dashboard With Power BI Ppt Template SS
Do you have an important presentation coming up Are you looking for something that will make your presentation stand out from the rest Look no further than Customer Segmentation Dashboard With Power BI Ppt Template SS With our professional designs, you can trust that your presentation will pop and make delivering it a smooth process. And with Slidegeeks, you can trust that your presentation will be unique and memorable. So why wait Grab Customer Segmentation Dashboard With Power BI Ppt Template SS today and make your presentation stand out from the rest Our Customer Segmentation Dashboard With Power BI Ppt Template SS are topically designed to provide an attractive backdrop to any subject. Use them to look like a presentation pro.
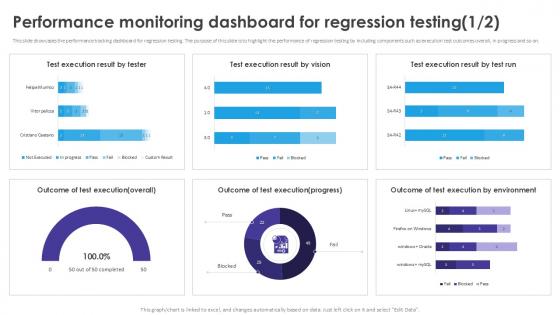
Performance Monitoring Dashboard Automated Regression Testing And Achieving PPT Example
This slide showcases the performance tracking dashboard for regression testing. The purpose of this slide is to highlight the performance of regression testing by including components such as execution test outcomes overall, in progress and so on. If your project calls for a presentation, then Slidegeeks is your go-to partner because we have professionally designed, easy-to-edit templates that are perfect for any presentation. After downloading, you can easily edit Performance Monitoring Dashboard Automated Regression Testing And Achieving PPT Example and make the changes accordingly. You can rearrange slides or fill them with different images. Check out all the handy templates This slide showcases the performance tracking dashboard for regression testing. The purpose of this slide is to highlight the performance of regression testing by including components such as execution test outcomes overall, in progress and so on.
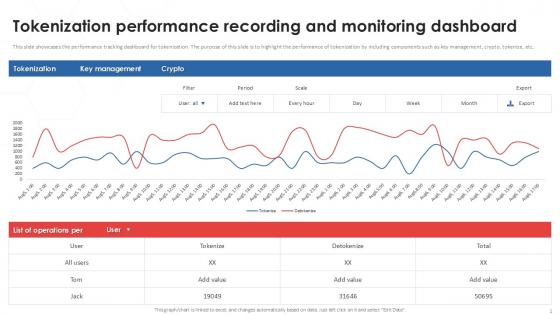
Tokenization Performance Recording And Monitoring Dashboard PPT Example
This slide showcases the performance tracking dashboard for tokenization. The purpose of this slide is to highlight the performance of tokenization by including components such as key management, crypto, tokenize, etc. Find a pre-designed and impeccable Tokenization Performance Recording And Monitoring Dashboard PPT Example. The templates can ace your presentation without additional effort. You can download these easy-to-edit presentation templates to make your presentation stand out from others. So, what are you waiting for Download the template from Slidegeeks today and give a unique touch to your presentation. This slide showcases the performance tracking dashboard for tokenization. The purpose of this slide is to highlight the performance of tokenization by including components such as key management, crypto, tokenize, etc.
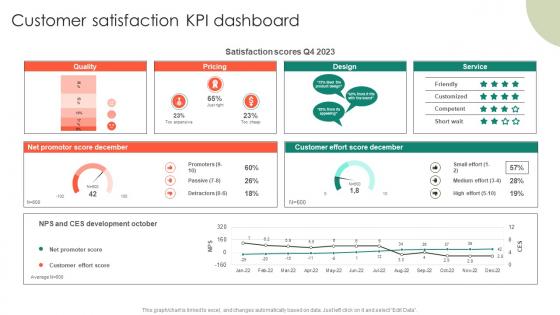
Customer Satisfaction KPI Dashboard Entrepreneurs Roadmap To Effective Demonstration Pdf
If your project calls for a presentation, then Slidegeeks is your go-to partner because we have professionally designed, easy-to-edit templates that are perfect for any presentation. After downloading, you can easily edit Customer Satisfaction KPI Dashboard Entrepreneurs Roadmap To Effective Demonstration Pdf and make the changes accordingly. You can rearrange slides or fill them with different images. Check out all the handy templates Our Customer Satisfaction KPI Dashboard Entrepreneurs Roadmap To Effective Demonstration Pdf are topically designed to provide an attractive backdrop to any subject. Use them to look like a presentation pro.
Secure Web Gateway Performance Tracking Dashboard Web Threat Protection System
Want to ace your presentation in front of a live audience Our Secure Web Gateway Performance Tracking Dashboard Web Threat Protection System can help you do that by engaging all the users towards you. Slidegeeks experts have put their efforts and expertise into creating these impeccable powerpoint presentations so that you can communicate your ideas clearly. Moreover, all the templates are customizable, and easy-to-edit and downloadable. Use these for both personal and commercial use. This slide represents a dashboard to maintain the record of various functions of Secure Web Gateway. The main components are top blocked web malware, web usage trend, top web application categories, risky web
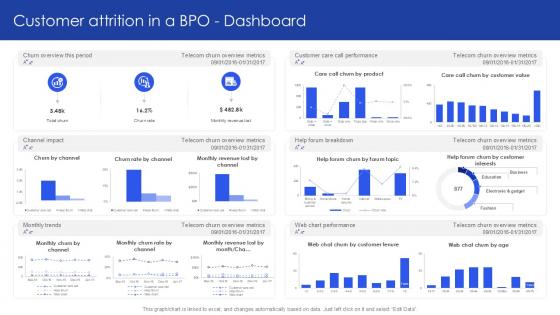
Customer Attrition In A BPO Dashboard PPT Example SS
Want to ace your presentation in front of a live audience Our Customer Attrition In A BPO Dashboard PPT Example SS can help you do that by engaging all the users towards you. Slidegeeks experts have put their efforts and expertise into creating these impeccable powerpoint presentations so that you can communicate your ideas clearly. Moreover, all the templates are customizable, and easy-to-edit and downloadable. Use these for both personal and commercial use. Our Customer Attrition In A BPO Dashboard PPT Example SS are topically designed to provide an attractive backdrop to any subject. Use them to look like a presentation pro.
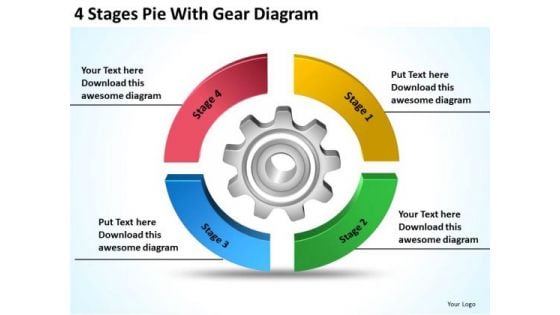
4 Stages Pie With Gear Diagram How To Create Business Plan PowerPoint Templates
We present our 4 stages pie with gear diagram how to create business plan PowerPoint templates.Use our Gear Wheels PowerPoint Templates because Our PowerPoint Templates and Slides are truly out of this world. Even the MIB duo has been keeping tabs on our team. Download our Circle Charts PowerPoint Templates because Our PowerPoint Templates and Slides will let you Illuminate the road ahead to Pinpoint the important landmarks along the way. Download our Business PowerPoint Templates because You can Channelise the thoughts of your team with our PowerPoint Templates and Slides. Urge them to focus on the goals you have set. Present our Process and Flows PowerPoint Templates because Our PowerPoint Templates and Slides will Embellish your thoughts. They will help you illustrate the brilliance of your ideas. Present our Shapes PowerPoint Templates because Our PowerPoint Templates and Slides are effectively colour coded to prioritise your plans They automatically highlight the sequence of events you desire.Use these PowerPoint slides for presentations relating to Chart, gear, pie, icon, profit, business, vector, wheel, isolated, white, concept, success, presentation, symbol, diagram, graphic, finance, data, calculate, cog, report, marketing, shape, management, piece, progress, part, investment, statistic, financial, editable, portion, performance. The prominent colors used in the PowerPoint template are Red, Yellow, Green. Address the developmental concerns of your clients. Advise on avenues available with our 4 Stages Pie With Gear Diagram How To Create Business Plan PowerPoint Templates.
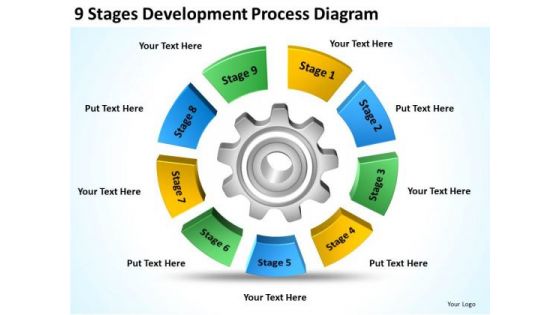
9 Stages Development Process Diagram Examples Of Business Plan PowerPoint Slides
We present our 9 stages development process diagram examples of business plan PowerPoint Slides.Download and present our Gear Wheels PowerPoint Templates because Our PowerPoint Templates and Slides will provide weight to your words. They will bring out the depth of your thought process. Download and present our Circle Charts PowerPoint Templates because Our PowerPoint Templates and Slides are aesthetically designed to attract attention. We gaurantee that they will grab all the eyeballs you need. Download our Business PowerPoint Templates because It will Give impetus to the hopes of your colleagues. Our PowerPoint Templates and Slides will aid you in winning their trust. Download our Process and Flows PowerPoint Templates because It can be used to Set your controls for the heart of the sun. Our PowerPoint Templates and Slides will be the propellant to get you there. Use our Shapes PowerPoint Templates because It can be used to Set your controls for the heart of the sun. Our PowerPoint Templates and Slides will be the propellant to get you there.Use these PowerPoint slides for presentations relating to Chart, gear, pie, icon, profit, business, vector, wheel, isolated, white, concept, success, presentation, symbol, diagram, graphic, finance, data, calculate, cog, report, marketing, shape, management, piece, progress, part, investment, statistic, financial, editable, portion, performance. The prominent colors used in the PowerPoint template are Orange, Yellow, Green. Advance your career with our 9 Stages Development Process Diagram Examples Of Business Plan PowerPoint Slides. Download without worries with our money back guaranteee.
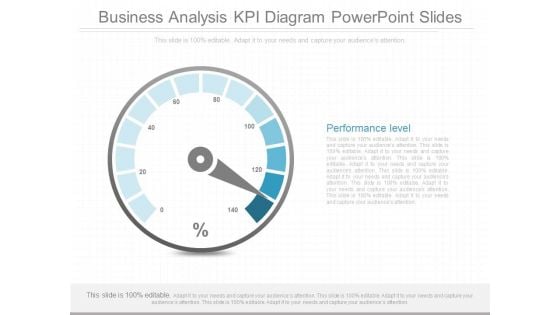
Business Analysis Kpi Diagram Powerpoint Slides
This is a business analysis kpi diagram powerpoint slides. This is a one stage process. The stages in this process are performance level.
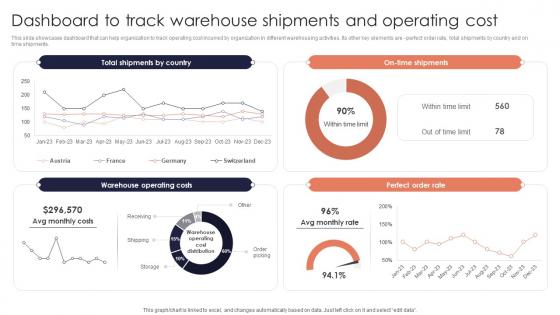
Dashboard Track Warehouse Minimizing Inventory Wastage Through Warehouse Designs Pdf
This slide showcases dashboard that can help organization to track operating cost incurred by organization in different warehousing activities. Its other key elements are perfect order rate, total shipments by country and on time shipments. Do you have to make sure that everyone on your team knows about any specific topic I yes, then you should give Dashboard Track Warehouse Minimizing Inventory Wastage Through Warehouse Designs Pdf a try. Our experts have put a lot of knowledge and effort into creating this impeccable Dashboard Track Warehouse Minimizing Inventory Wastage Through Warehouse Designs Pdf. You can use this template for your upcoming presentations, as the slides are perfect to represent even the tiniest detail. You can download these templates from the Slidegeeks website and these are easy to edit. So grab these today This slide showcases dashboard that can help organization to track operating cost incurred by organization in different warehousing activities. Its other key elements are perfect order rate, total shipments by country and on time shipments.
Dashboard For Tracking Impact Leveraging Logistics Automation Inspiration Pdf
This slide covers the dashboard for tracking vehicle efficiency after transport automation. It include KPIs such as truck turnaround time, average revenue per hour, truckload capacity, transit time, on-time pickup, and average revenue per mile.Do you have to make sure that everyone on your team knows about any specific topic I yes, then you should give Dashboard For Tracking Impact Leveraging Logistics Automation Inspiration Pdf a try. Our experts have put a lot of knowledge and effort into creating this impeccable Dashboard For Tracking Impact Leveraging Logistics Automation Inspiration Pdf. You can use this template for your upcoming presentations, as the slides are perfect to represent even the tiniest detail. You can download these templates from the Slidegeeks website and these are easy to edit. So grab these today. This slide covers the dashboard for tracking vehicle efficiency after transport automation. It include KPIs such as truck turnaround time, average revenue per hour, truckload capacity, transit time, on time pickup, and average revenue per mile.
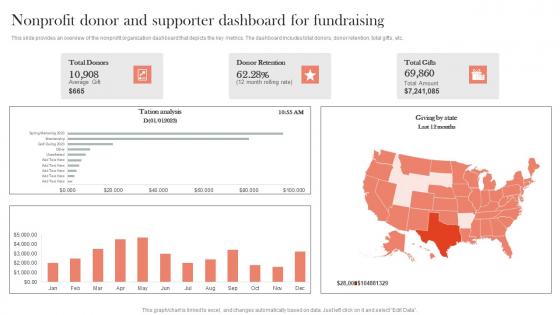
Non profit Donor And Supporter Dashboard For Efficient Nonprofit Marketing Template Pdf
This slide provides an overview of the nonprofit organization dashboard that depicts the key metrics. The dashboard includes total donors, donor retention, total gifts, etc.Create an editable Non profit Donor And Supporter Dashboard For Efficient Nonprofit Marketing Template Pdf that communicates your idea and engages your audience. Whether you are presenting a business or an educational presentation, pre-designed presentation templates help save time. Non profit Donor And Supporter Dashboard For Efficient Nonprofit Marketing Template Pdf is highly customizable and very easy to edit, covering many different styles from creative to business presentations. Slidegeeks has creative team members who have crafted amazing templates. So, go and get them without any delay. This slide provides an overview of the nonprofit organization dashboard that depicts the key metrics. The dashboard includes total donors, donor retention, total gifts, etc.
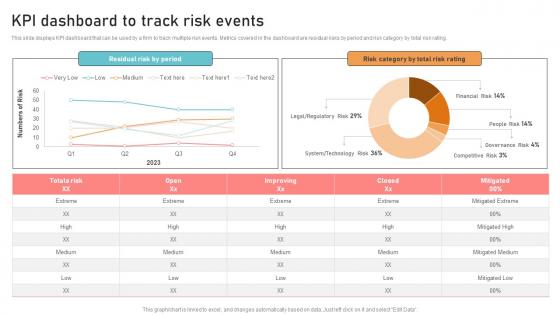
Optimizing Business Integration KPI Dashboard To Track Risk Events Designs Pdf
This slide displays KPI dashboard that can be used by a firm to track multiple risk events. Metrics covered in the dashboard are residual risks by period and risk category by total risk rating. Crafting an eye catching presentation has never been more straightforward. Let your presentation shine with this tasteful yet straightforward Optimizing Business Integration KPI Dashboard To Track Risk Events Designs Pdf template. It offers a minimalistic and classy look that is great for making a statement. The colors have been employed intelligently to add a bit of playfulness while still remaining professional. Construct the ideal Optimizing Business Integration KPI Dashboard To Track Risk Events Designs Pdf that effortlessly grabs the attention of your audience. Begin now and be certain to wow your customers. This slide displays KPI dashboard that can be used by a firm to track multiple risk events. Metrics covered in the dashboard are residual risks by period and risk category by total risk rating.
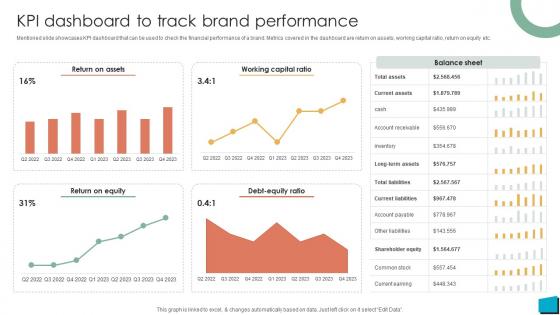
Brand Authority KPI Dashboard To Track Brand Performance Strategy SS V
Mentioned slide showcases KPI dashboard that can be used to check the financial performance of a brand. Metrics covered in the dashboard are return on assets, working capital ratio, return on equity etc. This Brand Authority KPI Dashboard To Track Brand Performance Strategy SS V is perfect for any presentation, be it in front of clients or colleagues. It is a versatile and stylish solution for organizing your meetings. The Brand Authority KPI Dashboard To Track Brand Performance Strategy SS V features a modern design for your presentation meetings. The adjustable and customizable slides provide unlimited possibilities for acing up your presentation. Slidegeeks has done all the homework before launching the product for you. So, do not wait, grab the presentation templates today Mentioned slide showcases KPI dashboard that can be used to check the financial performance of a brand. Metrics covered in the dashboard are return on assets, working capital ratio, return on equity etc.
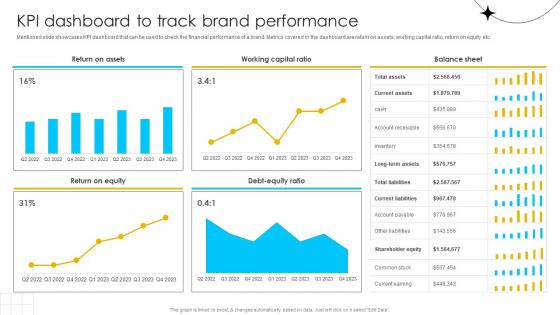
Brand Influence KPI Dashboard To Track Brand Performance Strategy SS V
Mentioned slide showcases KPI dashboard that can be used to check the financial performance of a brand. Metrics covered in the dashboard are return on assets, working capital ratio, return on equity etc. This Brand Influence KPI Dashboard To Track Brand Performance Strategy SS V is perfect for any presentation, be it in front of clients or colleagues. It is a versatile and stylish solution for organizing your meetings. The Brand Influence KPI Dashboard To Track Brand Performance Strategy SS V features a modern design for your presentation meetings. The adjustable and customizable slides provide unlimited possibilities for acing up your presentation. Slidegeeks has done all the homework before launching the product for you. So, do not wait, grab the presentation templates today Mentioned slide showcases KPI dashboard that can be used to check the financial performance of a brand. Metrics covered in the dashboard are return on assets, working capital ratio, return on equity etc.
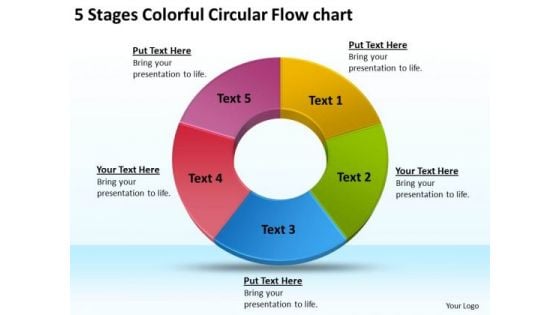
Stages Colorful Circular Flow Chart Business Plans For Small PowerPoint Slides
We present our stages colorful circular flow chart business plans for small PowerPoint Slides.Present our Process and Flows PowerPoint Templates because Our PowerPoint Templates and Slides will let you Leave a lasting impression to your audiences. They possess an inherent longstanding recall factor. Download our Flow Charts PowerPoint Templates because Our PowerPoint Templates and Slides will provide you a launch platform. Give a lift off to your ideas and send them into orbit. Use our Business PowerPoint Templates because Our PowerPoint Templates and Slides are created by a hardworking bunch of busybees. Always flitting around with solutions gauranteed to please. Present our Shapes PowerPoint Templates because Our PowerPoint Templates and Slides are conceived by a dedicated team. Use them and give form to your wondrous ideas. Download and present our Marketing PowerPoint Templates because Our PowerPoint Templates and Slides are conceived by a dedicated team. Use them and give form to your wondrous ideas.Use these PowerPoint slides for presentations relating to Business, chart, company, competition, concept, control, corporate, data, diagram, display, economy, exchange, finance,financial, graphic, icon, illustration, improvement, information, market, marketing, money, part, percentage, performance, pie, piece, presentation, profit, progress,reflect, render, report, results, sales, sheet, slice, statistics, strategy, vector. The prominent colors used in the PowerPoint template are Blue, White, Pink. Motivate teams with our Stages Colorful Circular Flow Chart Business Plans For Small PowerPoint Slides. Download without worries with our money back guaranteee.


 Continue with Email

 Home
Home


