Graph

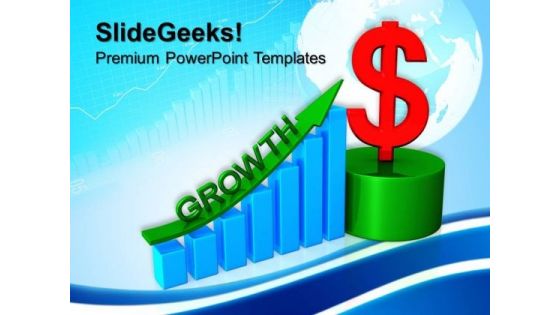
Blue Dollar Graph Up Business PowerPoint Templates And PowerPoint Themes 0712
Blue Dollar Graph Up Business PowerPoint Templates And PowerPoint Themes 0712-Microsoft Powerpoint Templates and Background with arrow diagram moving up over dollar graph bar Give birth to ambition with our Blue Dollar Graph Up Business PowerPoint Templates And PowerPoint Themes 0712. Let your thoughts design a dream.
Business Graph Growth Dollar Finance PowerPoint Templates And PowerPoint Themes 0712
Business Graph Growth Dollar Finance PowerPoint Templates And PowerPoint Themes 0712-Microsoft Powerpoint Templates and Background with bar graph Reposition yourself with our Business Graph Growth Dollar Finance PowerPoint Templates And PowerPoint Themes 0712. Download without worries with our money back guaranteee.

Bar Graph With Green Arrow Finance PowerPoint Templates And PowerPoint Themes 0712
Bar Graph With Green Arrow Finance PowerPoint Templates And PowerPoint Themes 0712-Microsoft Powerpoint Templates and Background with bar graph with arrow Create failsafe designs with our Bar Graph With Green Arrow Finance PowerPoint Templates And PowerPoint Themes 0712. Examine likely defects in detail.
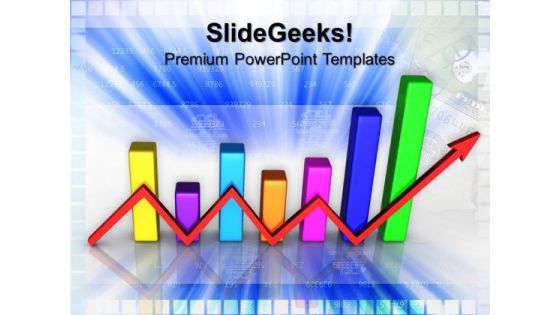
Bar Graph With Red Arrow Finance PowerPoint Templates And PowerPoint Themes 0712
Bar Graph With Red Arrow Finance PowerPoint Templates And PowerPoint Themes 0712-Microsoft Powerpoint Templates and Background with bar graph with arrow Attempt great targets with our Bar Graph With Red Arrow Finance PowerPoint Templates And PowerPoint Themes 0712. You will come out on top.
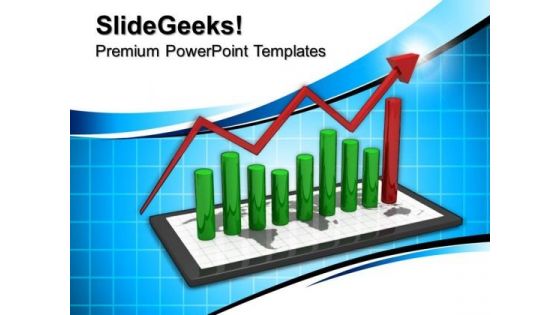
Tablet With Bar Graph Success PowerPoint Templates And PowerPoint Themes 0712
Tablet With Bar Graph Success PowerPoint Templates And PowerPoint Themes 0712-Microsoft Powerpoint Templates and Background with tablets with bar graph Our Tablet With Bar Graph Success PowerPoint Templates And PowerPoint Themes 0712 are a great feeder line. They keep the energy coming to you.
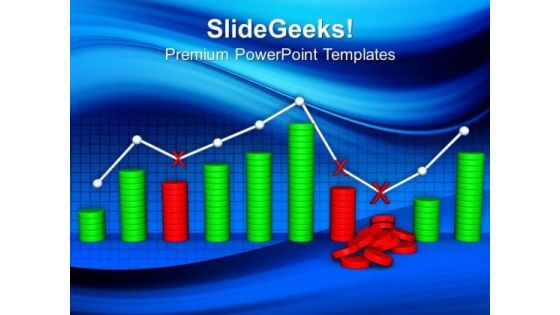
Business Graph With Fall Finance PowerPoint Templates And PowerPoint Themes 0812
Business Graph With Fall Finance PowerPoint Templates And PowerPoint Themes 0812-Microsoft Powerpoint Templates and Background with business graph with fall finance Fence in problems with our Business Graph With Fall Finance PowerPoint Templates And PowerPoint Themes 0812. Try us out and see what a difference our templates make.
Pie Chart Graph Dollar Finance PowerPoint Templates And PowerPoint Themes 0812
Pie Chart Graph Dollar Finance PowerPoint Templates And PowerPoint Themes 0812-Microsoft Powerpoint Templates and Background with pie chart graph and dollar Dosen't matter what the topic. Make it interesting with our Pie Chart Graph Dollar Finance PowerPoint Templates And PowerPoint Themes 0812. You will be at the top of your game.
Tablet With Business Graph Arrows PowerPoint Templates And PowerPoint Themes 0812
Tablet With Business Graph Arrows PowerPoint Templates And PowerPoint Themes 0812-Microsoft Powerpoint Templates and Background with computer tablet with graph Our Tablet With Business Graph Arrows PowerPoint Templates And PowerPoint Themes 0812 offer added advantage at no extra fee. They will be a bonus to your thoughts.

Increase In Dollar Graph Business PowerPoint Templates And PowerPoint Themes 0812
Increase In Dollar Graph Business PowerPoint Templates And PowerPoint Themes 0812-Microsoft Powerpoint Templates and Background with increase in dollar graph Examine every deatail with our Increase In Dollar Graph Business PowerPoint Templates And PowerPoint Themes 0812. Put each element to the test.

Pie Chart Graph Dollar Marketing PowerPoint Templates And PowerPoint Themes 0812
Pie Chart Graph Dollar Marketing PowerPoint Templates And PowerPoint Themes 0812-Microsoft Powerpoint Templates and Background with pie chart graph and dollar Our Pie Chart Graph Dollar Marketing PowerPoint Templates And PowerPoint Themes 0812 have a chrismatic effect. The audience will attest to your brilliance.
Computer Tablet With Business Growth Graph Success PowerPoint Templates And PowerPoint Themes 0812
Computer Tablet With Business Growth Graph Success PowerPoint Templates And PowerPoint Themes 0812-Microsoft Powerpoint Templates and Background with computer tablet with graph Get your brains abuzz with our Computer Tablet With Business Growth Graph Success PowerPoint Templates And PowerPoint Themes 0812. Activate and analyse the ideas that emerge.
Computer Tablet With Business Graph PowerPoint Templates And PowerPoint Themes 0912
Computer Tablet With Business Graph PowerPoint Templates And PowerPoint Themes 0912-Microsoft Powerpoint Templates and Background with computer tablet with business growth graph Our Computer Tablet With Business Graph PowerPoint Templates And PowerPoint Themes 0912 have fantastic ability. They will have an astounding effect on the audience.
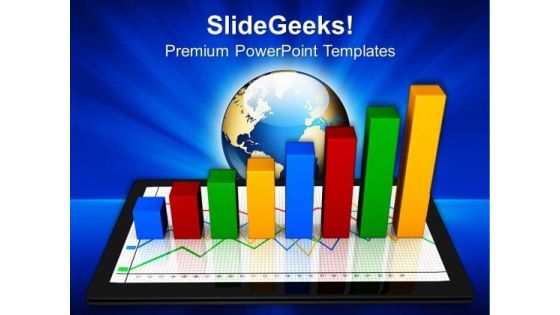
Computer Tablet With Business Growth Graph Marketing PowerPoint Templates And PowerPoint Themes 0912
Computer Tablet With Business Growth Graph Marketing PowerPoint Templates And PowerPoint Themes 0912-Microsoft Powerpoint Templates and Background with computer tablet with business growth graph Clad your thoughts in our Computer Tablet With Business Growth Graph Marketing PowerPoint Templates And PowerPoint Themes 0912. Dress them appropriately for the event.

Bar Graph And Dollars Money PowerPoint Templates And PowerPoint Themes 0912
Bar Graph And Dollars Money PowerPoint Templates And PowerPoint Themes 0912-Microsoft Powerpoint Templates and Background with bar graph and dollar money Encourage creativity with our Bar Graph And Dollars Money PowerPoint Templates And PowerPoint Themes 0912. You will come out on top.
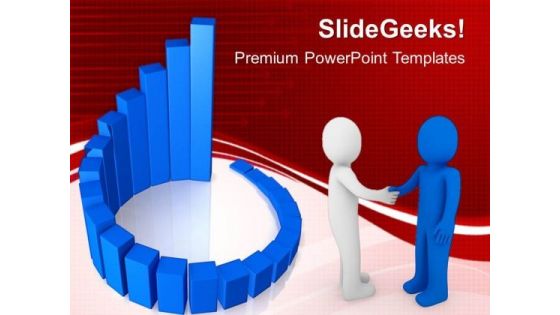
Circular Bar Graph Business Success PowerPoint Templates And PowerPoint Themes 1012
Circular Bar Graph Business Success PowerPoint Templates And PowerPoint Themes 1012-The above template displays a diagram of blue circular progress bars. This image represent the concept of business growth and success. This template imitates economy, finance, global, goal, growth, ideas, information, management, profit and statistics. This image has been conceived to enable you to emphatically communicate your ideas in your Business and Marketing PPT presentations. Use this template for financial analysis, business reviews and statistics. Go ahead and add charm to your presentations with our high quality template.-Circular Bar Graph Business Success PowerPoint Templates And PowerPoint Themes 1012-This PowerPoint template can be used for presentations relating to-Circular success graph, marketing, business, finance, success, circle charts Fashion your plans on our Circular Bar Graph Business Success PowerPoint Templates And PowerPoint Themes 1012. They will always keep you in contention.
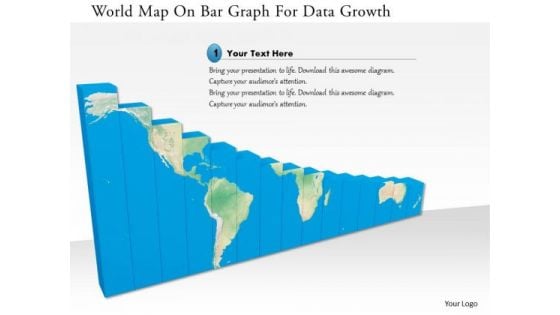
Stock Photo World Map On Bar Graph For Data Growth Image Graphics For PowerPoint Slide
This image is designed with blue graph with world map printed on it. This conceptual image portrays the concepts of global business and global economy. This image slide will help you express your views to target audience.
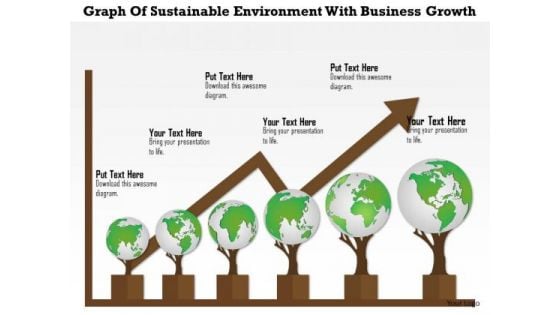
Business Diagram Graph Of Sustainable Environment With Business Growth Presentation Template
This diagram displays bar graph with globes and growth arrow. This image depicts concepts of green environment and business growth .Use this diagram to present your views in a wonderful manner.
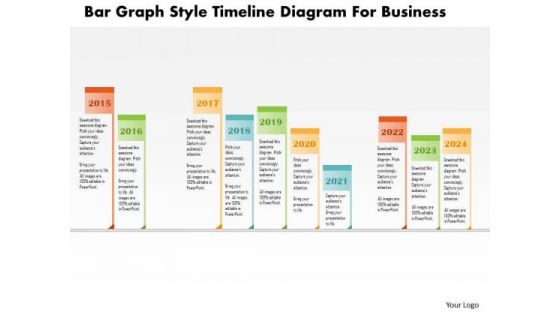
Business Diagram Bar Graph Style Timeline Diagram For Business Presentation Template
This business slide has been designed with bar graph style timeline diagram. Download this diagram to depict business annual plans and growth on your presentations. Make your presentations outshine using this diagram slide.
Dollar Mobile Bar Graph And Monitor Icons In Circles Powerpoint Templates
Our above slide has been designed with dollar, mobile, bar graph and monitor icons. This infographic slide is best to describe text information. You can provide a fantastic explanation of the topic with this slide.
5 Level Bar Graph For Analysis With Icons Ppt PowerPoint Presentation Shapes
This is a 5 level bar graph for analysis with icons ppt powerpoint presentation shapes. This is a five stage process. The stages in this process are business, strategy, marketing, icons, growth, management.
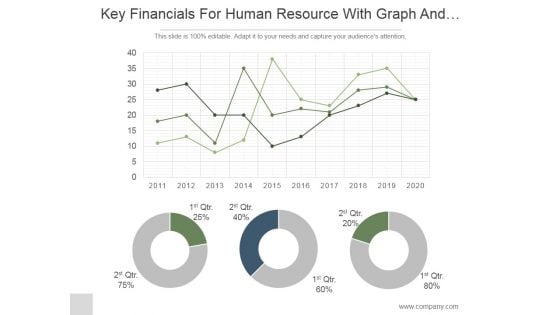
Key Financials For Human Resource With Graph And Pie Chart Ppt PowerPoint Presentation Ideas
This is a key financials for human resource with graph and pie chart ppt powerpoint presentation ideas. This is a three stage process. The stages in this process are business, strategy, marketing, analysis, donut, growth.
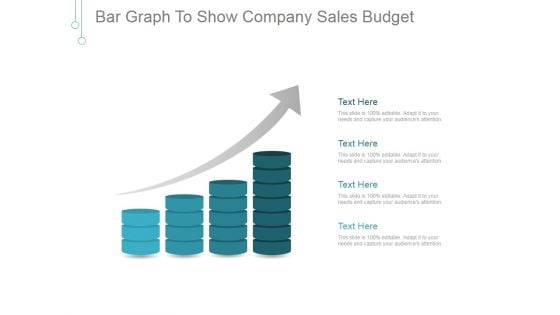
Bar Graph To Show Company Sales Budget Ppt PowerPoint Presentation Sample
This is a bar graph to show company sales budget ppt powerpoint presentation sample. This is a four stage process. The stages in this process are business, finance, growth, success, marketing, arrow.
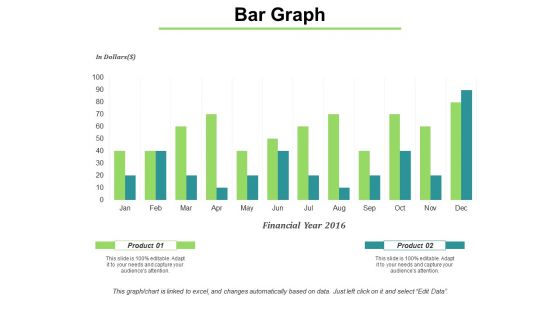
Bar Graph Shows Financial Values Ppt PowerPoint Presentation Infographic Template Gridlines
This is a bar graph shows financial values ppt powerpoint presentation infographic template gridlines. This is a two stage process. The stages in this process are bar, marketing, strategy, finance, planning.
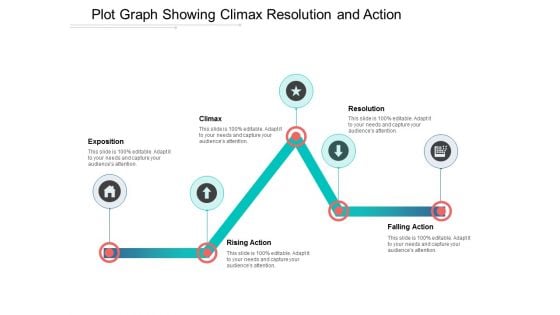
Plot Graph Showing Climax Resolution And Action Ppt Powerpoint Presentation Outline Themes
This is a plot graph showing climax resolution and action ppt powerpoint presentation outline themes. This is a five stage process. The stages in this process are scatter plot, probability plots, plot diagram.
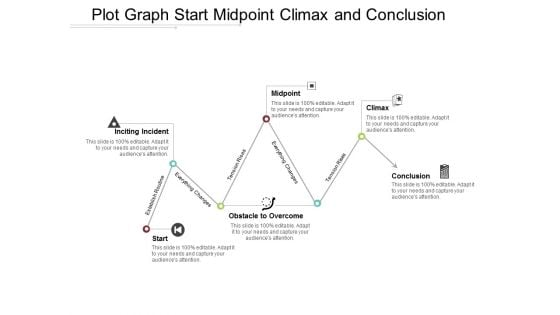
Plot Graph Start Midpoint Climax And Conclusion Ppt Powerpoint Presentation Portfolio Microsoft
This is a plot graph start midpoint climax and conclusion ppt powerpoint presentation portfolio microsoft. This is a six stage process. The stages in this process are scatter plot, probability plots, plot diagram.
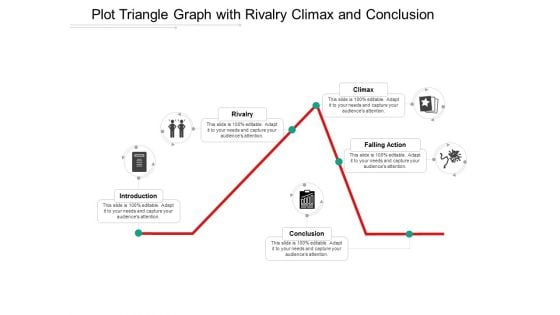
Plot Triangle Graph With Rivalry Climax And Conclusion Ppt Powerpoint Presentation Ideas Design Inspiration
This is a plot triangle graph with rivalry climax and conclusion ppt powerpoint presentation ideas design inspiration. This is a five stage process. The stages in this process are scatter plot, probability plots, plot diagram.
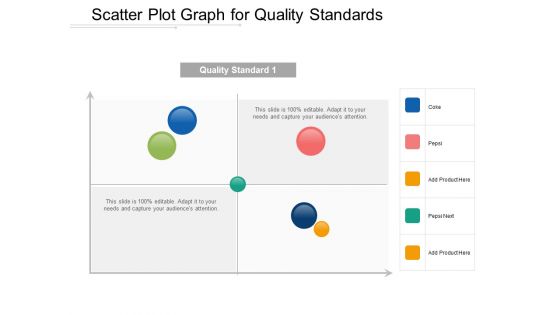
Scatter Plot Graph For Quality Standards Ppt Powerpoint Presentation Show Infographics
This is a scatter plot graph for quality standards ppt powerpoint presentation show infographics. This is a four stage process. The stages in this process are scatter plot, probability plots, plot diagram.
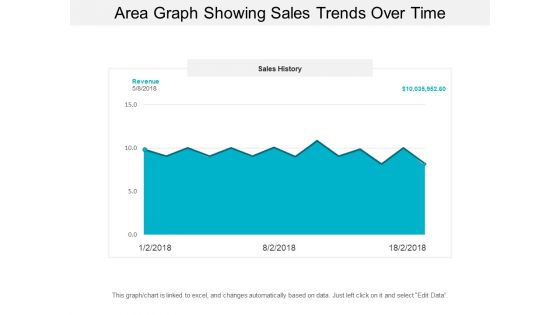
Area Graph Showing Sales Trends Over Time Ppt PowerPoint Presentation Model Background Designs
This is a area graph showing sales trends over time ppt powerpoint presentation model background designs. This is a three stage process. The stages in this process are financial analysis, quantitative, statistical modelling.
Bar Graph Icon For Data Analysis Ppt PowerPoint Presentation Pictures Ideas
This is a bar graph icon for data analysis ppt powerpoint presentation pictures ideas. This is a four stage process. The stages in this process are financial analysis, quantitative, statistical modelling.
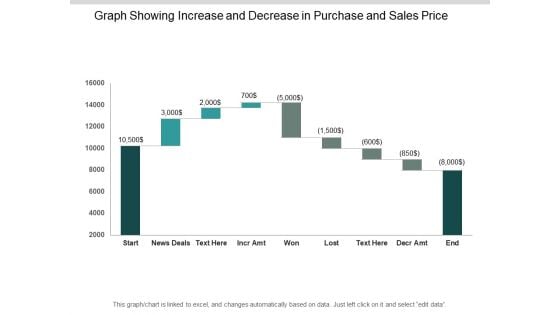
Graph Showing Increase And Decrease In Purchase And Sales Price Ppt PowerPoint Presentation Outline Gallery
This is a graph showing increase and decrease in purchase and sales price ppt powerpoint presentation outline gallery. This is a nine stage process. The stages in this process are sales waterfall, waterfall chart, business.
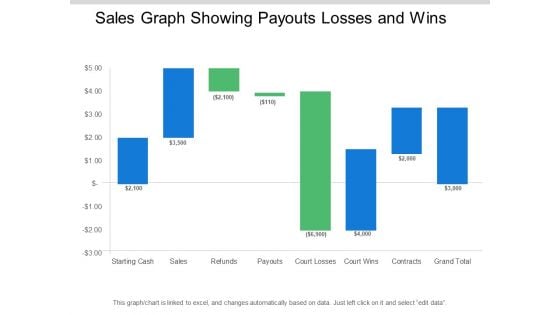
Sales Graph Showing Payouts Losses And Wins Ppt PowerPoint Presentation Pictures Designs Download
This is a sales graph showing payouts losses and wins ppt powerpoint presentation pictures designs download. This is a eight stage process. The stages in this process are sales waterfall, waterfall chart, business.
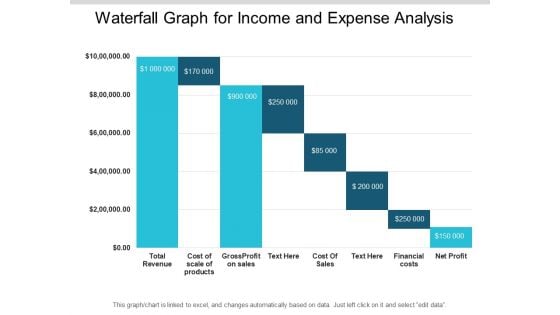
Waterfall Graph For Income And Expense Analysis Ppt PowerPoint Presentation File Deck
This is a waterfall graph for income and expense analysis ppt powerpoint presentation file deck. This is a eight stage process. The stages in this process are sales waterfall, waterfall chart, business.
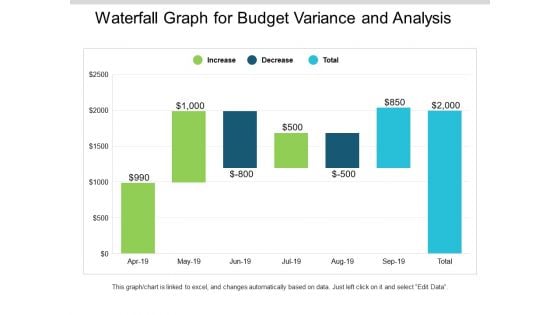
Waterfall Graph For Budget Variance And Analysis Ppt PowerPoint Presentation Slides Mockup
This is a waterfall graph for budget variance and analysis ppt powerpoint presentation slides mockup. This is a three stage process. The stages in this process are profit and loss, balance sheet, income statement, benefit and loss.
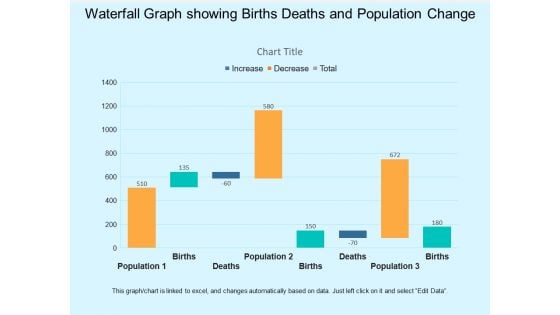
Waterfall Graph Showing Births Deaths And Population Change Ppt PowerPoint Presentation Infographic Template Visual Aids
This is a waterfall graph showing births deaths and population change ppt powerpoint presentation infographic template visual aids. This is a three stage process. The stages in this process are profit and loss, balance sheet, income statement, benefit and loss.
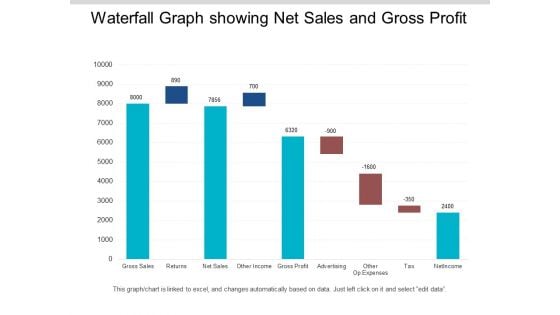
Waterfall Graph Showing Net Sales And Gross Profit Ppt PowerPoint Presentation Infographics Format
This is a waterfall graph showing net sales and gross profit ppt powerpoint presentation infographics format. This is a three stage process. The stages in this process are profit and loss, balance sheet, income statement, benefit and loss.
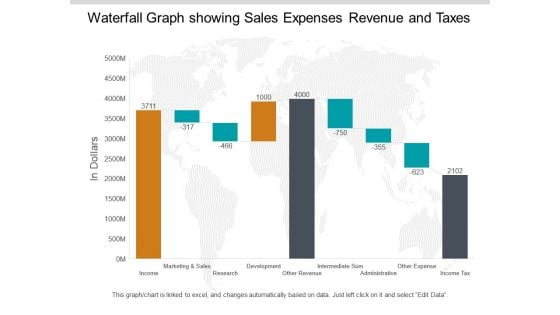
Waterfall Graph Showing Sales Expenses Revenue And Taxes Ppt PowerPoint Presentation Pictures Summary
This is a waterfall graph showing sales expenses revenue and taxes ppt powerpoint presentation pictures summary. This is a three stage process. The stages in this process are profit and loss, balance sheet, income statement, benefit and loss.
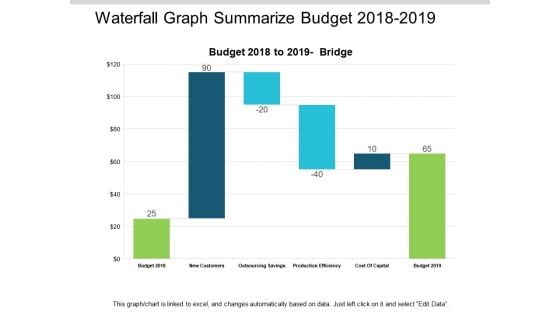
Waterfall Graph Summarize Budget 2018 To 2019 Ppt PowerPoint Presentation Summary Slides
This is a waterfall graph summarize budget 2018 to 2019 ppt powerpoint presentation summary slides. This is a three stage process. The stages in this process are profit and loss, balance sheet, income statement, benefit and loss.
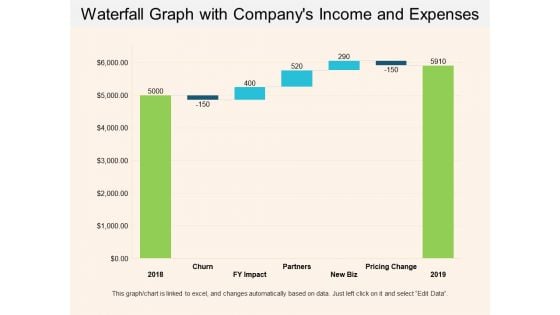
Waterfall Graph With Companys Income And Expenses Ppt PowerPoint Presentation Show Example Introduction
This is a waterfall graph with companys income and expenses ppt powerpoint presentation show example introduction. This is a three stage process. The stages in this process are profit and loss, balance sheet, income statement, benefit and loss.
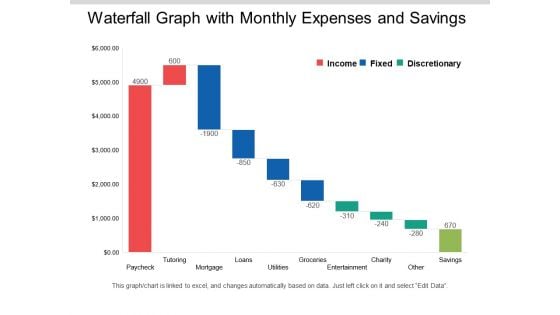
Waterfall Graph With Monthly Expenses And Savings Ppt PowerPoint Presentation Layouts Clipart Images
This is a waterfall graph with monthly expenses and savings ppt powerpoint presentation layouts clipart images. This is a three stage process. The stages in this process are profit and loss, balance sheet, income statement, benefit and loss.
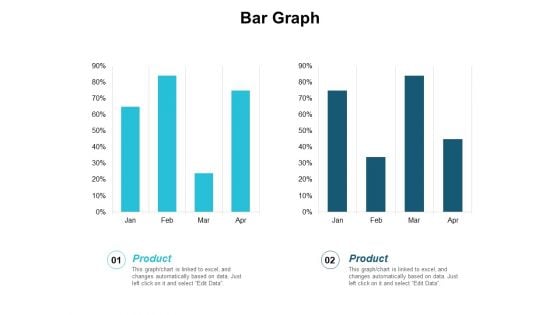
Bar Graph Finance Planning Ppt PowerPoint Presentation Infographic Template Master Slide
This is a bar graph finance planning ppt powerpoint presentation infographic template master slide. This is a two stage process. The stages in this process are finance, analysis, business, investment, marketing.
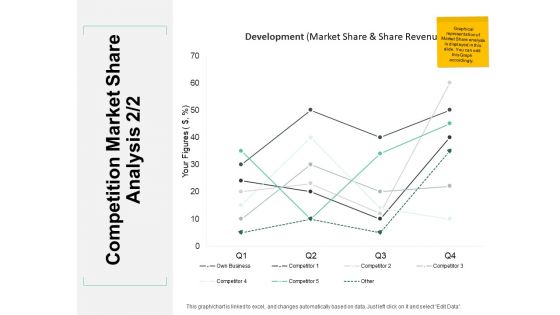
Competition Market Share Analysis Line Graph Ppt PowerPoint Presentation Portfolio Layouts
Presenting this set of slides with name competition market share analysis line graph ppt powerpoint presentation portfolio layouts. The topics discussed in these slides are marketing, business, management, planning, strategy. This is a completely editable PowerPoint presentation and is available for immediate download. Download now and impress your audience.
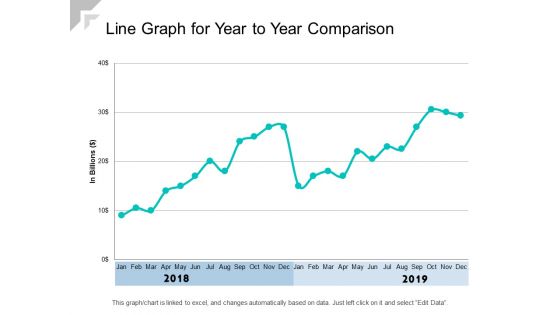
Line Graph For Year To Year Comparison Ppt PowerPoint Presentation Show Graphics Example
Presenting this set of slides with name line graph for year to year comparison ppt powerpoint presentation show graphics example. The topics discussed in these slides are revenue trend, bar chart, financial. This is a completely editable PowerPoint presentation and is available for immediate download. Download now and impress your audience.
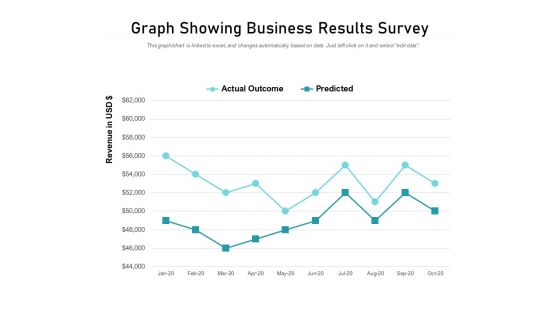
Graph Showing Business Results Survey Ppt PowerPoint Presentation Summary Slide Portrait
Presenting this set of slides with name graph showing business results survey ppt powerpoint presentation summary slide portrait. The topics discussed in these slides are actual outcomes, predicted. This is a completely editable PowerPoint presentation and is available for immediate download. Download now and impress your audience.
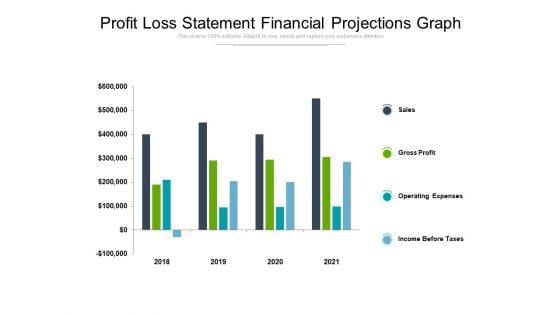
Profit Loss Statement Financial Projections Graph Ppt PowerPoint Presentation Summary Slides
Presenting this set of slides with name profit loss statement financial projections graph ppt powerpoint presentation summary slides. The topics discussed in these slides are sales, gross profit, operating expenses, income before taxes. This is a completely editable PowerPoint presentation and is available for immediate download. Download now and impress your audience.
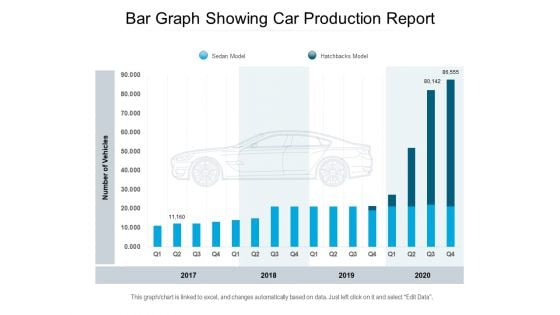
Bar Graph Showing Car Production Report Ppt PowerPoint Presentation Outline Master Slide PDF
Presenting this set of slides with name bar graph showing car production report ppt powerpoint presentation outline master slide pdf. The topics discussed in these slides are sedan model, hatchbacks model, 2017 to 2020. This is a completely editable PowerPoint presentation and is available for immediate download. Download now and impress your audience.
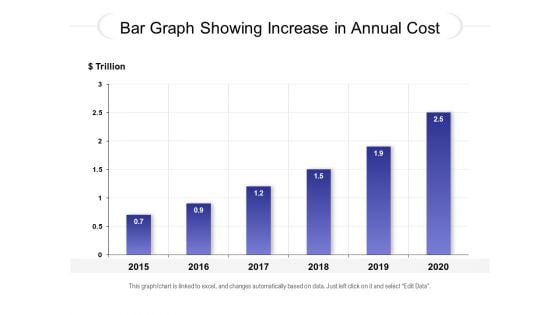
Bar Graph Showing Increase In Annual Cost Ppt PowerPoint Presentation Infographic Template Inspiration PDF
Presenting this set of slides with name bar graph showing increase in annual cost ppt powerpoint presentation infographic template inspiration pdf. The topics discussed in these slides are 2015 to 2020. This is a completely editable PowerPoint presentation and is available for immediate download. Download now and impress your audience.
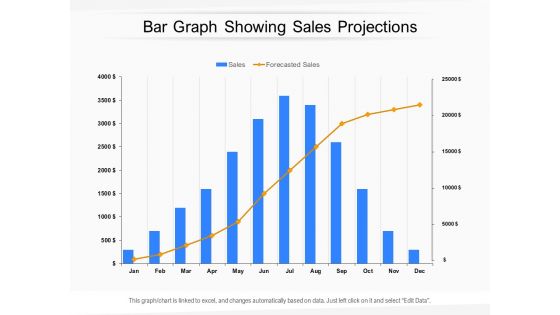
Bar Graph Showing Sales Projections Ppt PowerPoint Presentation Styles Graphics Download PDF
Presenting this set of slides with name bar graph showing sales projections ppt powerpoint presentation styles graphics download pdf. The topics discussed in these slides are Sales, Forecasted Sales. This is a completely editable PowerPoint presentation and is available for immediate download. Download now and impress your audience.
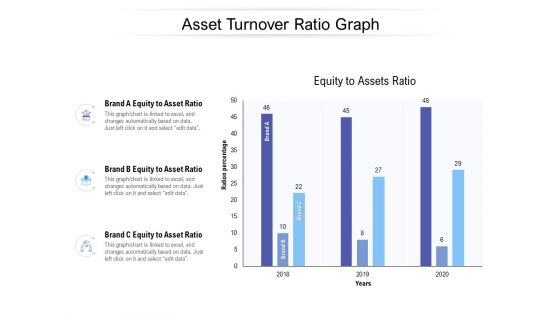
Asset Turnover Ratio Graph Ppt PowerPoint Presentation Outline Graphics Template PDF
Presenting this set of slides with name asset turnover ratio graph ppt powerpoint presentation outline graphics template pdf. The topics discussed in these slides are brand a equity to asset ratio, brand b equity to asset ratio, brand c equity to asset ratio. This is a completely editable PowerPoint presentation and is available for immediate download. Download now and impress your audience.
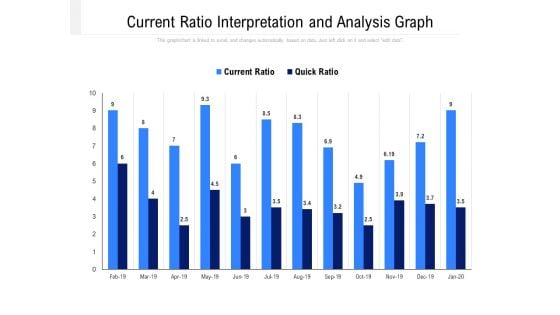
Current Ratio Interpretation And Analysis Graph Ppt PowerPoint Presentation Outline Inspiration PDF
Presenting this set of slides with name current ratio interpretation and analysis graph ppt powerpoint presentation outline inspiration pdf. The topics discussed in these slides are current ration, quick ration. This is a completely editable PowerPoint presentation and is available for immediate download. Download now and impress your audience.
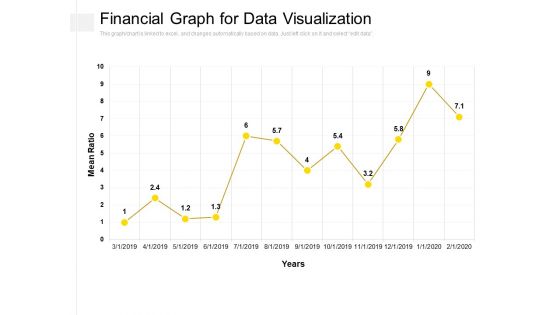
Financial Graph For Data Visualization Ppt PowerPoint Presentation Slides Picture PDF
Presenting this set of slides with name financial graph for data visualization ppt powerpoint presentation slides picture pdf. The topics discussed in these slides are mean ration, year. This is a completely editable PowerPoint presentation and is available for immediate download. Download now and impress your audience.
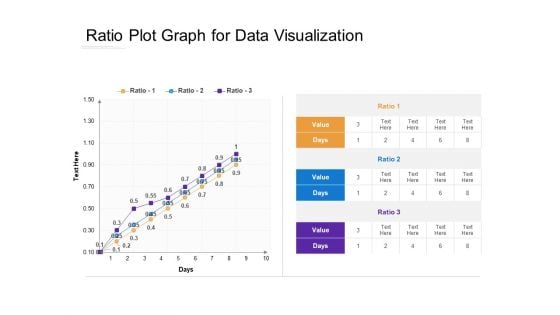
Ratio Plot Graph For Data Visualization Ppt PowerPoint Presentation Ideas Outfit PDF
Presenting this set of slides with name ratio plot graph for data visualization ppt powerpoint presentation ideas outfit pdf. The topics discussed in these slides are ratio, value, days. This is a completely editable PowerPoint presentation and is available for immediate download. Download now and impress your audience.
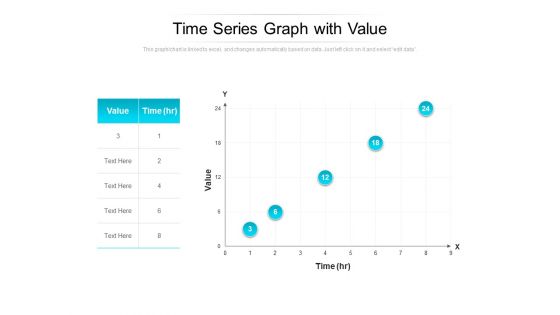
Time Series Graph With Value Ppt PowerPoint Presentation Pictures Graphics Example PDF
Presenting this set of slides with name time series graph with value ppt powerpoint presentation pictures graphics example pdf. The topics discussed in these slides are value, time. This is a completely editable PowerPoint presentation and is available for immediate download. Download now and impress your audience.
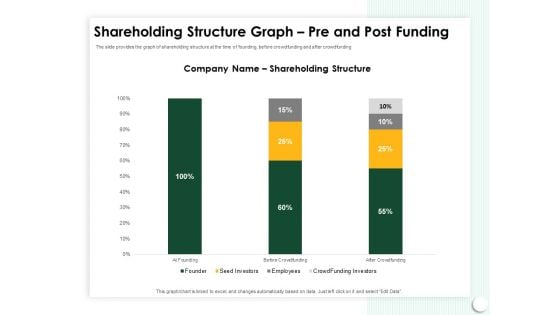
Startup Presentation For Collaborative Capital Funding Shareholding Structure Graph Pre And Post Funding Background PDF
Presenting this set of slides with name startup presentation for collaborative capital funding shareholding structure graph pre and post funding background pdf. The topics discussed in these slides are employee, shareholding structure, seed investors, crowd funding investors. This is a completely editable PowerPoint presentation and is available for immediate download. Download now and impress your audience.
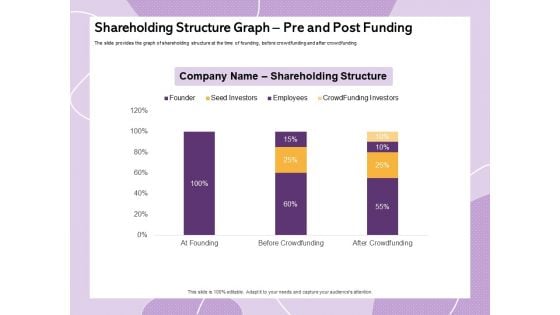
Investor Presentation For Society Funding Shareholding Structure Graph Pre And Post Funding Elements PDF
Presenting this set of slides with name investor presentation for society funding shareholding structure graph pre and post funding elements pdf. The topics discussed in these slides are before funding, after funding, value shares, investor. This is a completely editable PowerPoint presentation and is available for immediate download. Download now and impress your audience.
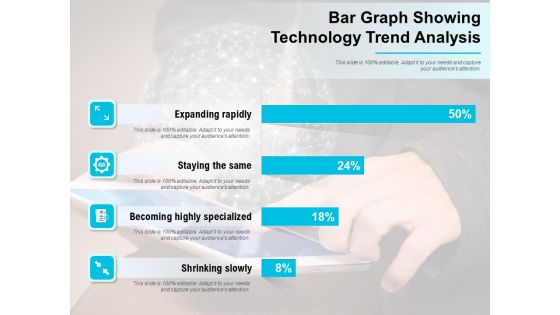
Bar Graph Showing Technology Trend Analysis Ppt PowerPoint Presentation File Mockup PDF
Presenting this set of slides with name bar graph showing technology trend analysis ppt powerpoint presentation file mockup pdf. The topics discussed in these slides are expanding rapidly, shrinking slowly. This is a completely editable PowerPoint presentation and is available for immediate download. Download now and impress your audience.
Bar Graph Showing Imported And Domestic Film Profit Ppt PowerPoint Presentation Icon Model PDF
Presenting this set of slides with name bar graph showing imported and domestic film profit ppt powerpoint presentation icon model pdf. The topics discussed in these slides are imported films, domestic films. This is a completely editable PowerPoint presentation and is available for immediate download. Download now and impress your audience.
Bar Graph Showing Profit Analysis Ppt PowerPoint Presentation Icon Deck PDF
Presenting this set of slides with name bar graph showing profit analysis ppt powerpoint presentation icon deck pdf. The topics discussed in these slides are gross revenue, income. This is a completely editable PowerPoint presentation and is available for immediate download. Download now and impress your audience.
Gross And Net Revenue Comparison Shown By Graph Ppt PowerPoint Presentation File Icons PDF
Presenting this set of slides with name gross and net revenue comparison shown by graph ppt powerpoint presentation file icons pdf. The topics discussed in these slides are gross profit, net profit. This is a completely editable PowerPoint presentation and is available for immediate download. Download now and impress your audience.
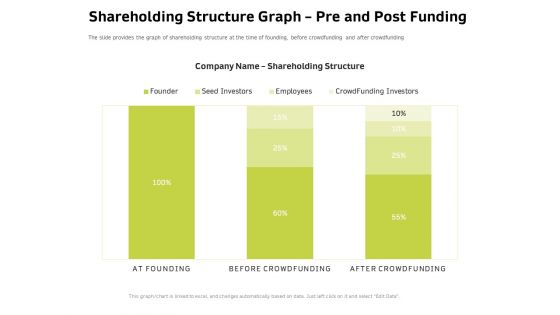
Customer Relationship Management In Freehold Property Shareholding Structure Graph Pre And Post Funding Elements PDF
Presenting this set of slides with name customer relationship management in freehold property shareholding structure graph pre and post funding elements pdf. The topics discussed in these slides are employee, shareholding structure, seed investors, crowd funding investors. This is a completely editable PowerPoint presentation and is available for immediate download. Download now and impress your audience.
Bar Graph Showing Of Business Income And Expenditure Ppt PowerPoint Presentation Icon Show PDF
Presenting this set of slides with name bar graph showing of business income and expenditure ppt powerpoint presentation icon show pdf. The topics discussed in these slides are expenses, revenue. This is a completely editable PowerPoint presentation and is available for immediate download. Download now and impress your audience.


 Continue with Email

 Home
Home


