Graph
Clock Face And Graph Business PowerPoint Themes And PowerPoint Slides 0411
Microsoft PowerPoint Theme and Slide with clock face and graph Fall back on our Clock Face And Graph Business PowerPoint Themes And PowerPoint Slides 0411 at anytime. They are always ready and able to answer your call.
Arrow Graph Going Up Success PowerPoint Themes And PowerPoint Slides 0511
Microsoft PowerPoint Theme and Slide with arrow graph going up on a blue Slide Preach the value of good business ethics. Our Arrow Graph Going Up Success PowerPoint Themes And PowerPoint Slides 0511 will keep the faith.
Arrow Graph Going Up Global PowerPoint Themes And PowerPoint Slides 0511
Microsoft PowerPoint Theme and Slide with arrow graph going up Instruct your team with our Arrow Graph Going Up Global PowerPoint Themes And PowerPoint Slides 0511. Make sure your presentation gets the attention it deserves.
Profit Graph With Green Arrow Business PowerPoint Themes And PowerPoint Slides 0811
Microsoft PowerPoint Theme and Slide with profit graph with green arrows Our Profit Graph With Green Arrow Business PowerPoint Themes And PowerPoint Slides 0811 are fashioned for your thoughts. Your ideas will create a new fad.
Man Run Up On Graph Business PowerPoint Themes And PowerPoint Slides 0511
Microsoft PowerPoint Slide and Theme with man moving up on graph chart business growth success finances diagram improvement Refresh equations with our Man Run Up On Graph Business PowerPoint Themes And PowerPoint Slides 0511. Strenthen old bonds with your thoughts.
Business Graph With Check Metaphor PowerPoint Themes And PowerPoint Slides 0511
Microsoft PowerPoint Theme and Slide with a combination of a check mark and financial graph Bake the cake with our Business Graph With Check Metaphor PowerPoint Themes And PowerPoint Slides 0511. Give them all a big slab of it.

Dices On Financial Graph Business PowerPoint Themes And PowerPoint Slides 0511
Microsoft PowerPoint Theme and Slide with dices on financial graph Our Dices On Financial Graph Business PowerPoint Themes And PowerPoint Slides 0511 will entice the audience. They will make a beeline for you.
Graph Growth Of Dollars Finance PowerPoint Themes And PowerPoint Slides 0711
Microsoft PowerPoint Theme and Slide with graph representing growth sign of money Invite praises with our Graph Growth Of Dollars Finance PowerPoint Themes And PowerPoint Slides 0711. Make sure your presentation gets the attention it deserves.
Man Drawing A Graph Marketing PowerPoint Themes And PowerPoint Slides 0511
Microsoft PowerPoint Theme and Slide with business man drawing a growth graph Fight your battles with our Man Drawing A Graph Marketing PowerPoint Themes And PowerPoint Slides 0511. You will come out on top.

Success Graph With Dollar Business PowerPoint Themes And PowerPoint Slides 0511
Microsoft PowerPoint Theme and Slide with business graph from dollar coins with arrow showing profits Get complimentary benefits with our Success Graph With Dollar Business PowerPoint Themes And PowerPoint Slides 0511. Recieve extra appreciation at no extra cost.
Person Standing On Graph Success PowerPoint Themes And PowerPoint Slides 0711
Microsoft PowerPoint Theme and Slide with number one bar graph Taste success with our Person Standing On Graph Success PowerPoint Themes And PowerPoint Slides 0711. You will come out on top.
Growth Graph With Arrow Business PowerPoint Themes And PowerPoint Slides 0611
Microsoft PowerPoint Theme and Slide with growth graph with red arrow pointing upwards Your ideas deserve more exposure. Our Growth Graph With Arrow Business PowerPoint Themes And PowerPoint Slides 0611 will ensure due coverage.
Man With A Graph Business PowerPoint Themes And PowerPoint Slides 0611
Microsoft PowerPoint Theme and Slide with successful business man with a graph Facilitate change with our Man With A Graph Business PowerPoint Themes And PowerPoint Slides 0611. Gain audience acceptance faster.
Yellow And Blue Graph Business PowerPoint Themes And PowerPoint Slides 0611
Microsoft PowerPoint Theme and Slide with business graph with arrow Our Yellow And Blue Graph Business PowerPoint Themes And PowerPoint Slides 0611 help you go against the clock. They provide the basic aids.
Dollar Graph With Target Finance PowerPoint Templates And PowerPoint Backgrounds 1211
Microsoft PowerPoint Template and Background with dollar graph and target represents success Be accredited by the connoisseurs. Our Dollar Graph With Target Finance PowerPoint Templates And PowerPoint Backgrounds 1211 certify their approval.

Bar Graph With Success Business PowerPoint Templates And PowerPoint Themes 0312
Microsoft Powerpoint Templates and Background with business graph success Bet a quid on our Bar Graph With Success Business PowerPoint Templates And PowerPoint Themes 0312. You will end up a 49er.
Bar Graph With Arrow Success PowerPoint Templates And PowerPoint Themes 0412
Microsoft Powerpoint Templates and Background with graph of business Solve problems with our Bar Graph With Arrow Success PowerPoint Templates And PowerPoint Themes 0412. Download without worries with our money back guaranteee.
Colored Bar Graph With Success PowerPoint Templates And PowerPoint Themes 0412
Microsoft Powerpoint Templates and Background with business graph success Resolve the feud with our Colored Bar Graph With Success PowerPoint Templates And PowerPoint Themes 0412. Take all different approaches into consideration.

Stock Photo 3d Ecg Graph And Red Heart For Heart Health Image Graphics For PowerPoint Slide
This exclusive power point image has been designed with graphic of heart in the centre of graph. This graph is can be used as ECG for heart beat. This template is suitable for medical and heart issues related presentations.

Stock Photo 3d Heart Beat Graph For Heart Health Image Graphics For PowerPoint Slide
This exclusive power point image has been designed with graphic of heart in the centre of graph. This graph may be used as ECG for heart beat. This template is suitable for medical and heart issues related presentations.
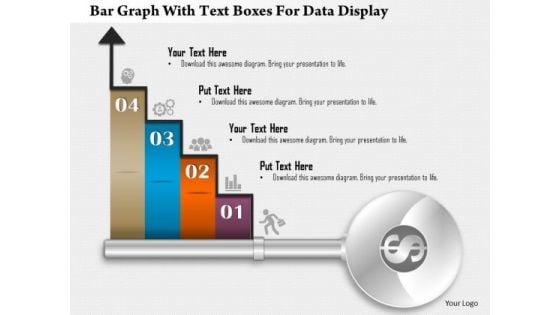
Business Diagram Bar Graph With Text Boxes For Data Display Presentation Template
Our above business diagram displays bar graph. It contains four steps on bar graph with icons. Use this diagram to display four stages of business growth. Download this Power Point slide to build quality presentation for your viewers.
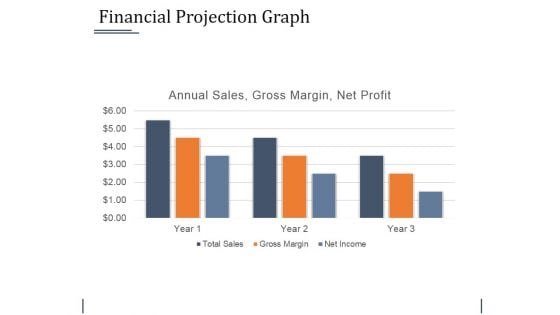
Financial Projection Graph Template 1 Ppt PowerPoint Presentation Professional Example Introduction
This is a financial projection graph template 1 ppt powerpoint presentation professional example introduction. This is a three stage process. The stages in this process are business, bar graph, finance, marketing, strategy, analysis.
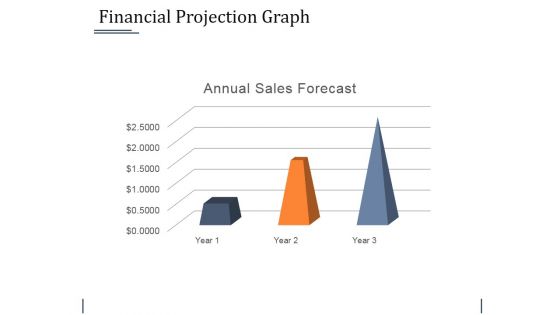
Financial Projection Graph Template 2 Ppt PowerPoint Presentation Infographic Template Gallery
This is a financial projection graph template 2 ppt powerpoint presentation infographic template gallery. This is a three stage process. The stages in this process are business, bar graph, finance, marketing, strategy, analysis.
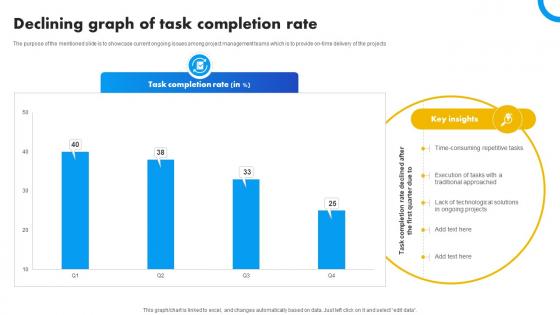
Declining Graph Of Task Completion Rate Strategies For Success In Digital
The purpose of the mentioned slide is to showcase current ongoing issues among project management teams which is to provide on-time delivery of the projects. From laying roadmaps to briefing everything in detail, our templates are perfect for you. You can set the stage with your presentation slides. All you have to do is download these easy-to-edit and customizable templates. Declining Graph Of Task Completion Rate Strategies For Success In Digital will help you deliver an outstanding performance that everyone would remember and praise you for. Do download this presentation today. The purpose of the mentioned slide is to showcase current ongoing issues among project management teams which is to provide on-time delivery of the projects.
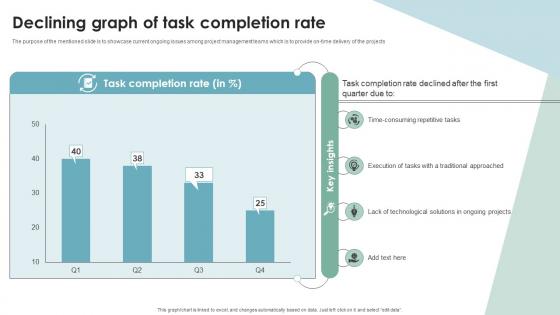
Declining Graph Of Task Completion Rate Digital Transformation In Project Management
The purpose of the mentioned slide is to showcase current ongoing issues among project management teams which is to provide on-time delivery of the projects. From laying roadmaps to briefing everything in detail, our templates are perfect for you. You can set the stage with your presentation slides. All you have to do is download these easy-to-edit and customizable templates. Declining Graph Of Task Completion Rate Digital Transformation In Project Management will help you deliver an outstanding performance that everyone would remember and praise you for. Do download this presentation today. The purpose of the mentioned slide is to showcase current ongoing issues among project management teams which is to provide on-time delivery of the projects

Empowering The Future Statistical Graph Showcasing Smart Meter Market Growth IoT SS V
This slide showcases information about the global market size of smart meters. It includes key reasons such as government initiatives to promote energy conversation, smart city initiatives, accurate billing process, etc. The Empowering The Future Statistical Graph Showcasing Smart Meter Market Growth IoT SS V is a compilation of the most recent design trends as a series of slides. It is suitable for any subject or industry presentation, containing attractive visuals and photo spots for businesses to clearly express their messages. This template contains a variety of slides for the user to input data, such as structures to contrast two elements, bullet points, and slides for written information. Slidegeeks is prepared to create an impression. This slide showcases information about the global market size of smart meters. It includes key reasons such as government initiatives to promote energy conversation, smart city initiatives, accurate billing process, etc.
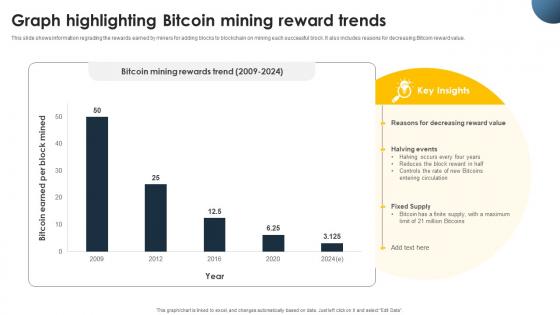
Complete Beginners Guide Graph Highlighting Bitcoin Mining Reward Trends Fin SS V
This slide shows information regrading the rewards earned by miners for adding blocks to blockchain on mining each successful block. It also includes reasons for decreasing Bitcoin reward value. Coming up with a presentation necessitates that the majority of the effort goes into the content and the message you intend to convey. The visuals of a PowerPoint presentation can only be effective if it supplements and supports the story that is being told. Keeping this in mind our experts created Complete Beginners Guide Graph Highlighting Bitcoin Mining Reward Trends Fin SS V to reduce the time that goes into designing the presentation. This way, you can concentrate on the message while our designers take care of providing you with the right template for the situation. This slide shows information regrading the rewards earned by miners for adding blocks to blockchain on mining each successful block. It also includes reasons for decreasing Bitcoin reward value.
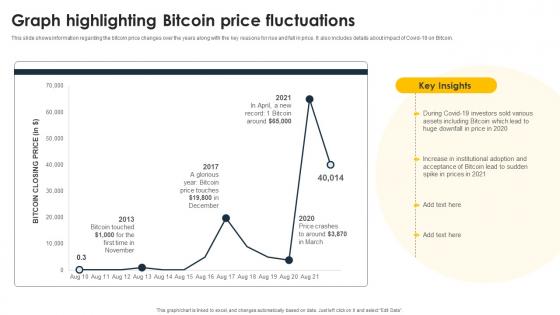
Complete Beginners Guide To Graph Highlighting Bitcoin Price Fluctuations Fin SS V
This slide shows information regarding the bitcoin price changes over the years along with the key reasons for rise and fall in price. It also includes details about impact of Covid-19 on Bitcoin. Present like a pro with Complete Beginners Guide To Graph Highlighting Bitcoin Price Fluctuations Fin SS V. Create beautiful presentations together with your team, using our easy-to-use presentation slides. Share your ideas in real-time and make changes on the fly by downloading our templates. So whether you are in the office, on the go, or in a remote location, you can stay in sync with your team and present your ideas with confidence. With Slidegeeks presentation got a whole lot easier. Grab these presentations today. This slide shows information regarding the bitcoin price changes over the years along with the key reasons for rise and fall in price. It also includes details about impact of Covid-19 on Bitcoin.
Graph Highlighting Bitcoin Price Everything About Bitcoin PPT Presentation Fin SS V
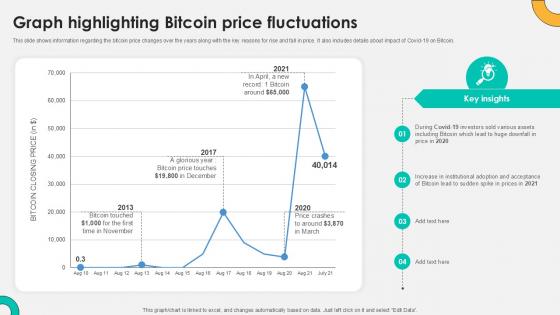
This slide shows information regarding the bitcoin price changes over the years along with the key reasons for rise and fall in price. It also includes details about impact of Covid-19 on Bitcoin. The best PPT templates are a great way to save time, energy, and resources. Slidegeeks have 100 percent editable powerpoint slides making them incredibly versatile. With these quality presentation templates, you can create a captivating and memorable presentation by combining visually appealing slides and effectively communicating your message. Download Graph Highlighting Bitcoin Price Everything About Bitcoin PPT Presentation Fin SS V from Slidegeeks and deliver a wonderful presentation. This slide shows information regarding the bitcoin price changes over the years along with the key reasons for rise and fall in price. It also includes details about impact of Covid-19 on Bitcoin.
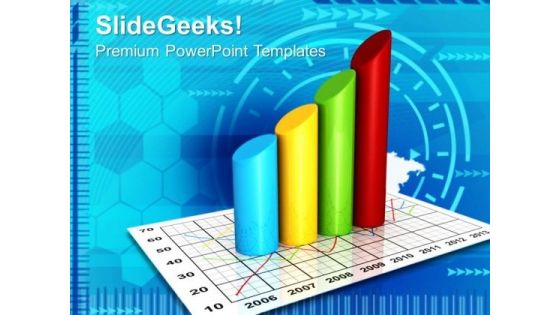
Graph Of Products Sale Business PowerPoint Templates And PowerPoint Themes 0912
Graph Of Products Sale Business PowerPoint Templates And PowerPoint Themes Presentations-Microsoft Powerpoint Templates and Background with graph of products sale-Graph Of Products Sale Business PowerPoint Templates And PowerPoint Themes PresentationsThis PPT can be used for presentations relating to-Graph of products sale, business, cylinders, success, finance, shapes Be bold and dramatic with our Graph Of Products Sale Business PowerPoint Templates And PowerPoint Themes 0912. State the facts with elan.
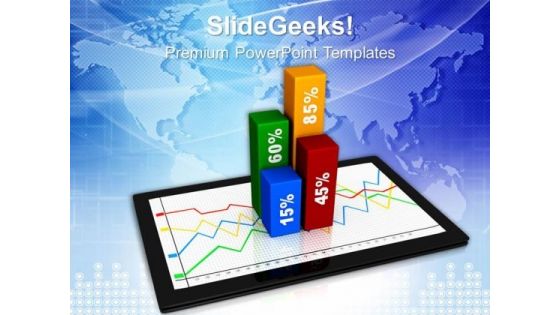
Graph On Ipad Business Growth PowerPoint Templates And PowerPoint Themes 1012
Graph On Ipad Business Growth PowerPoint Templates And PowerPoint Themes 1012-Microsoft Powerpoint Templates and Background with ipad showing success graph-Graph On Ipad Business Growth PowerPoint Templates And PowerPoint Themes 1012-This PowerPoint template can be used for presentations relating to-Ipad showing success graph, business, success, technology, finance, marketing Remove confusionswith our Graph On Ipad Business Growth PowerPoint Templates And PowerPoint Themes 1012. You'll deliver your best presentation yet.
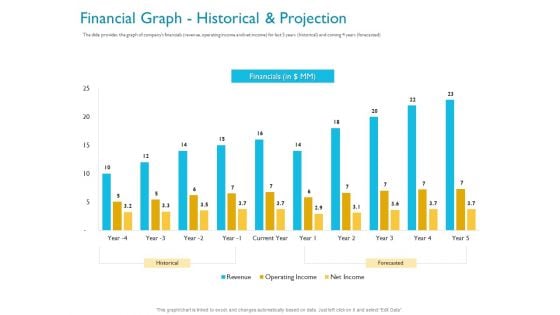
Investor Funding Deck For Hybrid Financing Financial Graph Historical And Projection Ppt Layouts Slides PDF
The slide provides the graph of companys financials revenue, operating income and net income for last 5 years historical and coming 4 years forecasted. Deliver and pitch your topic in the best possible manner with this investor funding deck for hybrid financing financial graph historical and projection ppt layouts slides pdf. Use them to share invaluable insights on historical, forecasted, net income, operating income, financial and impress your audience. This template can be altered and modified as per your expectations. So, grab it now.
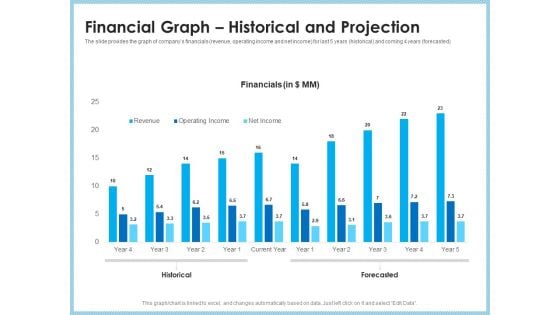
Investment Pitch To Generating Capital From Mezzanine Credit Financial Graph Historical And Projection Microsoft PDF
The slide provides the graph of companys financials revenue, operating income and net income for last 5 years historical and coming 4 years forecasted. Deliver and pitch your topic in the best possible manner with this investment pitch to generating capital from mezzanine credit financial graph historical and projection microsoft pdf. Use them to share invaluable insights on revenue, operating income, net income, current year, historical, forecasted and impress your audience. This template can be altered and modified as per your expectations. So, grab it now.
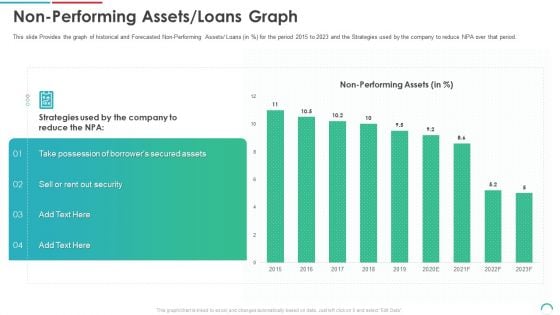
Post Initial Public Offering Equity Financing Pitch Non Performing Assets Loans Graph Infographics PDF
This slide Provides the graph of historical and Forecasted Non-Performing Assets Loans in percent for the period 2015 to 2023 and the Strategies used by the company to reduce NPA over that period. Deliver an awe inspiring pitch with this creative post initial public offering equity financing pitch non performing assets loans graph infographics pdf bundle. Topics like secured assets, performing assets, 2015 to 2023 can be discussed with this completely editable template. It is available for immediate download depending on the needs and requirements of the user.
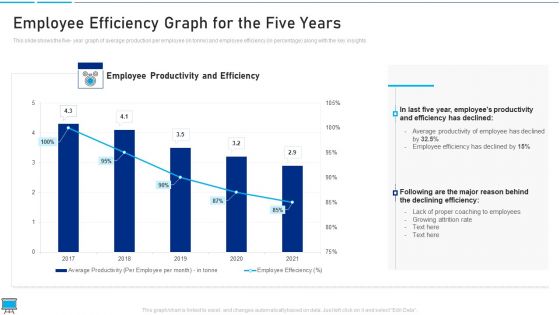
Performance Training Action Plan And Extensive Strategies Employee Efficiency Graph For The Five Years Guidelines PDF
This slide shows the five year graph of average production per employee in tonne and employee efficiency in percentage along with the key insights Deliver and pitch your topic in the best possible manner with this performance training action plan and extensive strategies employee efficiency graph for the five years guidelines pdf Use them to share invaluable insights on declining efficiency, proper coaching to employees, employee efficiency and impress your audience. This template can be altered and modified as per your expectations. So, grab it now.
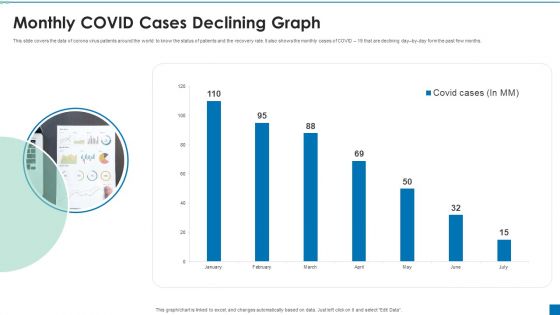
Monthly COVID Cases Declining Graph Ppt PowerPoint Presentation Ideas Slide Portrait PDF
This slide covers the data of corona virus patients around the world to know the status of patients and the recovery rate. It also shows the monthly cases of COVID 19 that are declining day by day form the past few months.Showcasing this set of slides titled Monthly COVID Cases Declining Graph Ppt PowerPoint Presentation Ideas Slide Portrait PDF. The topics addressed in these templates are Monthly Covid Cases, Declining Graph. All the content presented in this PPT design is completely editable. Download it and make adjustments in color, background, font etc. as per your unique business setting.
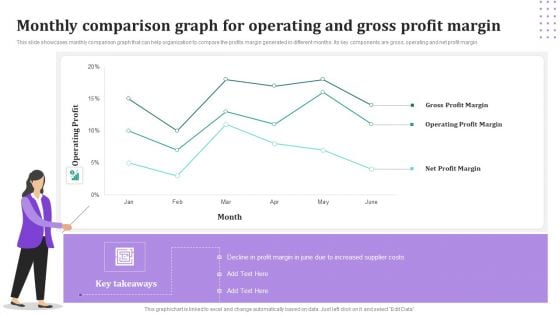
Monthly Comparison Graph For Operating And Gross Profit Margin Pictures PDF
This slide showcases monthly comparison graph that can help organization to compare the profits margin generated in different months. Its key components are gross, operating and net profit margin. Showcasing this set of slides titled Monthly Comparison Graph For Operating And Gross Profit Margin Pictures PDF. The topics addressed in these templates are Gross Profit Margin, Operating Profit Margin, Net Profit Margin. All the content presented in this PPT design is completely editable. Download it and make adjustments in color, background, font etc. as per your unique business setting.
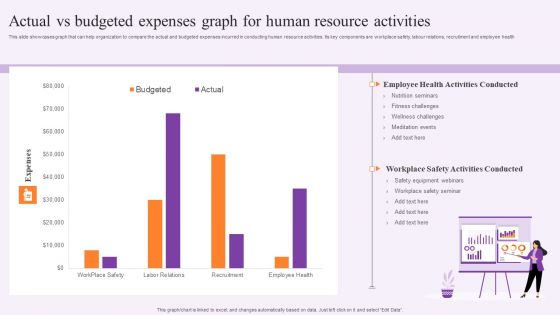
Actual Vs Budgeted Expenses Graph For Human Resource Activities Guidelines PDF
This slide showcases graph that can help organization to compare the actual and budgeted expenses incurred in conducting human resource activities. Its key components are workplace safety, labour relations, recruitment and employee health. Showcasing this set of slides titled Actual Vs Budgeted Expenses Graph For Human Resource Activities Guidelines PDF. The topics addressed in these templates are Safety Equipment Webinars, Employee, Expenses. All the content presented in this PPT design is completely editable. Download it and make adjustments in color, background, font etc. as per your unique business setting.
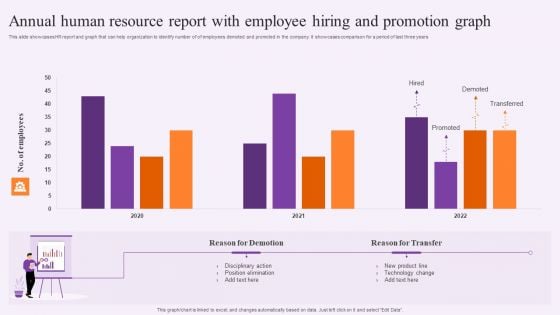
Annual Human Resource Report With Employee Hiring And Promotion Graph Mockup PDF
This slide showcases HR report and graph that can help organization to identify number of of employees demoted and promoted in the company. It showcases comparison for a period of last three years. Pitch your topic with ease and precision using this Annual Human Resource Report With Employee Hiring And Promotion Graph Mockup PDF. This layout presents information on Technology, Product, Employees. It is also available for immediate download and adjustment. So, changes can be made in the color, design, graphics or any other component to create a unique layout.
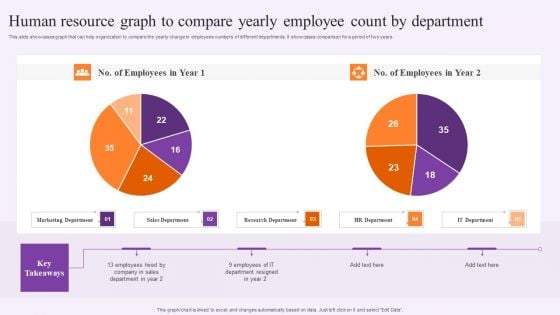
Human Resource Graph To Compare Yearly Employee Count By Department Professional PDF
This slide showcases graph that can help organization to compare the yearly change in employees numbers of different departments. It showcases comparison for a period of two years. Showcasing this set of slides titled Human Resource Graph To Compare Yearly Employee Count By Department Professional PDF. The topics addressed in these templates are Marketing Department, Sales Department, Research Department. All the content presented in this PPT design is completely editable. Download it and make adjustments in color, background, font etc. as per your unique business setting.
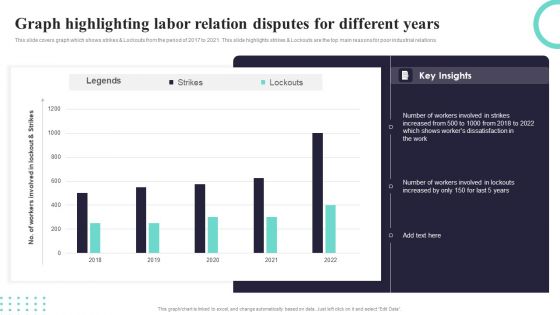
Graph Highlighting Labor Relation Disputes For Different Years Ppt PowerPoint Presentation Gallery Sample PDF
This slide covers graph which shows strikes and Lockouts from the period of 2017 to 2021. This slide highlights strikes and Lockouts are the top main reasons for poor industrial relations. Showcasing this set of slides titled Graph Highlighting Labor Relation Disputes For Different Years Ppt PowerPoint Presentation Gallery Sample PDF. The topics addressed in these templates are Legends, Strikes, Lockouts. All the content presented in this PPT design is completely editable. Download it and make adjustments in color, background, font etc. as per your unique business setting.

Business Revenue Bar Graph With Business Operational Expenditure Details Summary PDF
This slide represents business revenue bar graph with OPEX details which can be referred by companies to earn more revenue by controlling expenditures. It also provides information about marketing and sales, research and development, administration, total revenue, etc. Pitch your topic with ease and precision using this Business Revenue Bar Graph With Business Operational Expenditure Details Summary PDF. This layout presents information on Cost Of Marketing, Sales, Highest Amount. It is also available for immediate download and adjustment. So, changes can be made in the color, design, graphics or any other component to create a unique layout.
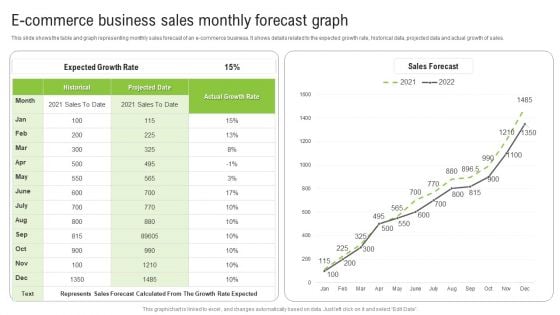
E Commerce Business Sales Monthly Forecast Graph Ppt Infographics Show PDF
This slide shows the table and graph representing monthly sales forecast of an e-commerce business. It shows details related to the expected growth rate, historical data, projected data and actual growth of sales. Pitch your topic with ease and precision using this E Commerce Business Sales Monthly Forecast Graph Ppt Infographics Show PDF. This layout presents information on Expected Growth Rate, Historical, Actual Growth Rate. It is also available for immediate download and adjustment. So, changes can be made in the color, design, graphics or any other component to create a unique layout.
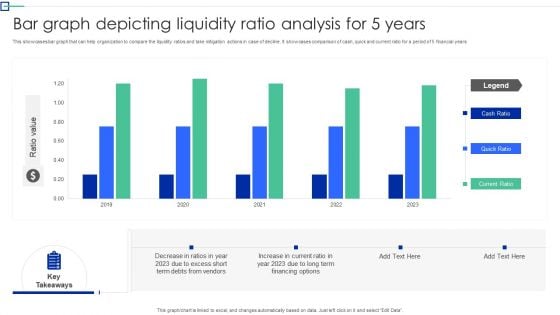
Bar Graph Depicting Liquidity Ratio Analysis For 5 Years Graphics PDF
This showcases bar graph that can help organization to compare the liquidity ratios and take mitigation actions in case of decline. It showcases comparison of cash, quick and current ratio for a period of 5 financial years. Showcasing this set of slides titled Bar Graph Depicting Liquidity Ratio Analysis For 5 Years Graphics PDF. The topics addressed in these templates are Organization To Compare, The Liquidity Ratios, Mitigation Action Decline. All the content presented in this PPT design is completely editable. Download it and make adjustments in color, background, font etc. as per your unique business setting.
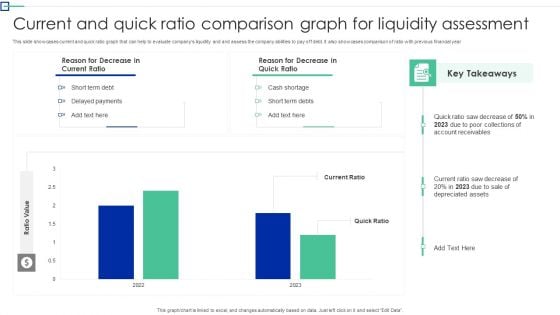
Current And Quick Ratio Comparison Graph For Liquidity Assessment Structure PDF
This slide showcases current and quick ratio graph that can help to evaluate companys liquidity and and assess the company abilities to pay off debt. It also showcases comparison of ratio with previous financial year. Showcasing this set of slides titled Current And Quick Ratio Comparison Graph For Liquidity Assessment Structure PDF. The topics addressed in these templates are Short Term Debt, Delayed Payments, Cash Shortage. All the content presented in this PPT design is completely editable. Download it and make adjustments in color, background, font etc. as per your unique business setting.
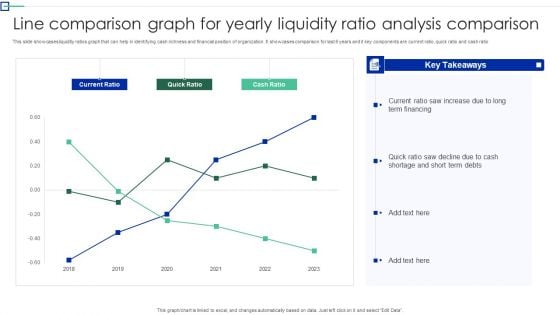
Line Comparison Graph For Yearly Liquidity Ratio Analysis Comparison Topics PDF
This slide showcases liquidity ratios graph that can help in identifying cash richness and financial position of organization. It showcases comparison for last 6 years and it key components are current ratio, quick ratio and cash ratio. Showcasing this set of slides titled Line Comparison Graph For Yearly Liquidity Ratio Analysis Comparison Topics PDF. The topics addressed in these templates are Term Financing, Cash Shortage, Cash Ratio. All the content presented in this PPT design is completely editable. Download it and make adjustments in color, background, font etc. as per your unique business setting.
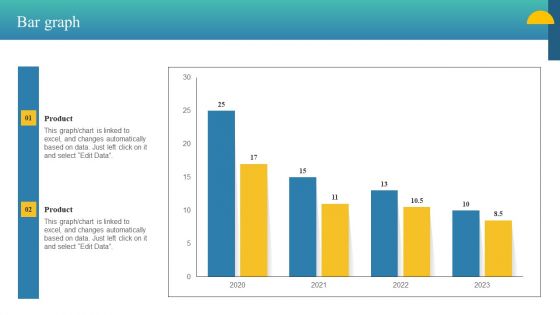
Charity Fundraising Marketing Plan Bar Graph Ppt PowerPoint Presentation File Example Introduction PDF
Find highly impressive Charity Fundraising Marketing Plan Bar Graph Ppt PowerPoint Presentation File Example Introduction PDF on Slidegeeks to deliver a meaningful presentation. You can save an ample amount of time using these presentation templates. No need to worry to prepare everything from scratch because Slidegeeks experts have already done a huge research and work for you. You need to download Charity Fundraising Marketing Plan Bar Graph Ppt PowerPoint Presentation File Example Introduction PDF for your upcoming presentation. All the presentation templates are 100 percent editable and you can change the color and personalize the content accordingly. Download now.
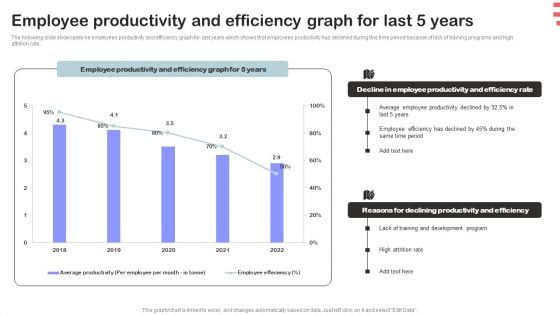
Corporate Training Program Employee Productivity And Efficiency Graph For Last 5 Years Elements PDF
The following slide showcases he employees productivity and efficiency graph for last years which shows that employees productivity has declined during this time period because of lack of training programs and high attrition rate. Make sure to capture your audiences attention in your business displays with our gratis customizable Corporate Training Program Employee Productivity And Efficiency Graph For Last 5 Years Elements PDF. These are great for business strategies, office conferences, capital raising or task suggestions. If you desire to acquire more customers for your tech business and ensure they stay satisfied, create your own sales presentation with these plain slides.
Increase Graph And Dollar Sales PowerPoint Templates And PowerPoint Themes 0612
Increase Graph And Dollar Sales PowerPoint Templates And PowerPoint Themes PPT Slides-Microsoft Powerpoint Templates and Background with graph dollar Award yourself with our Increase Graph And Dollar Sales PowerPoint Templates And PowerPoint Themes 0612. You deserve to deal with the best.
Increase Bar Graph Dollar Business PowerPoint Templates And PowerPoint Themes 0612
Increase Bar Graph Dollar Business PowerPoint Templates And PowerPoint Themes Business PPT Templates-Graph dollar, arrow, background, business, success, marketing Our Increase Bar Graph Dollar Business PowerPoint Templates And PowerPoint Themes 0612 have a chrismatic effect. The audience will attest to your brilliance.
Increase Graph And Red Dollar Success PowerPoint Templates And PowerPoint Themes 0612
Increase Graph And Red Dollar Success PowerPoint Templates And PowerPoint Themes Business PPT Templates-Graph with arrow, finance, sales, arrows, success, business Look like an expert with our Increase Graph And Red Dollar Success PowerPoint Templates And PowerPoint Themes 0612. Just download, type and present.
Tablet With Bar Graph Business PowerPoint Templates And PowerPoint Themes 0612
Tablet With Bar Graph Business PowerPoint Templates And PowerPoint Themes 0612-Microsoft Powerpoint Templates and Background with tablets with a bar graph Lock horns with our Tablet With Bar Graph Business PowerPoint Templates And PowerPoint Themes 0612. You will be at the top of your game.
Bar Graph And Red Arrow Growth Business PowerPoint Templates And PowerPoint Themes 0712
Bar Graph And Red Arrow Growth Business PowerPoint Templates And PowerPoint Themes 0712-Microsoft Powerpoint Templates and Background with bar graph with arrow Our Bar Graph And Red Arrow Growth Business PowerPoint Templates And PowerPoint Themes 0712 ensure approval. Your ideas will fit the bill.
Bar Graph Progress Chart Business PowerPoint Templates And PowerPoint Themes 0712
Bar Graph Progress Chart Business PowerPoint Templates And PowerPoint Themes 0712-Microsoft Powerpoint Templates and Background with bar graph with arrow Our Bar Graph Progress Chart Business PowerPoint Templates And PowerPoint Themes 0712 are like an excellent buffet. An array of delicious dishes to choose from.

Golden Bar Graph With Globe Business PowerPoint Templates And PowerPoint Themes 0712
Golden Bar Graph With Globe Business PowerPoint Templates And PowerPoint Themes Power Point-Microsoft Powerpoint Templates and Background with golden bar graph with globe Dress up your presentations with our Golden Bar Graph With Globe Business PowerPoint Templates And PowerPoint Themes 0712. You will come out on top.
Bar Graph Growth With Earth PowerPoint Templates And PowerPoint Themes 0712
Bar Graph Growth With Earth PowerPoint Templates And PowerPoint Themes 0712-Microsoft Powerpoint Templates and Background with bar graph with global Encourage teams with our Bar Graph Growth With Earth PowerPoint Templates And PowerPoint Themes 0712. Download without worries with our money back guaranteee.
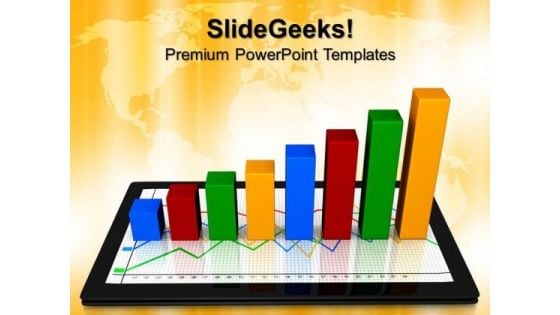
Computer Tablet With Graph Business PowerPoint Templates And PowerPoint Themes 0712
Computer Tablet With Graph Business PowerPoint Templates And PowerPoint Themes 0712-Microsoft Powerpoint Templates and Background with tablets with a business graph Command teams with our Computer Tablet With Graph Business PowerPoint Templates And PowerPoint Themes 0712. Download without worries with our money back guaranteee.
Bar Graph Red Arrow Business PowerPoint Templates And PowerPoint Themes 0712
Bar Graph Red Arrow Business PowerPoint Templates And PowerPoint Themes Business Power Points-Microsoft Powerpoint Templates and Background with bar graph with arrow Our Bar Graph Red Arrow Business PowerPoint Templates And PowerPoint Themes 0712 capture the essence of your thoughts. They stay faithful to the theme.
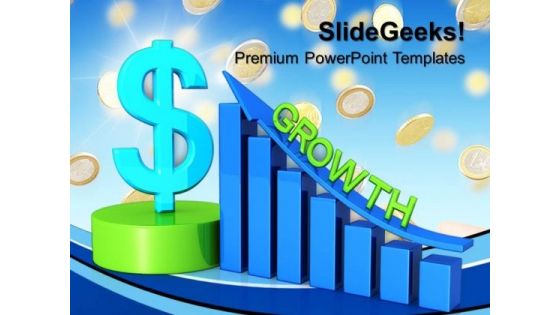
Business Dollar Graph Growth Success PowerPoint Templates And PowerPoint Themes 0712
Business Dollar Graph Growth Success PowerPoint Templates And PowerPoint Themes Business Power Points-Microsoft Powerpoint Templates and Background with dollars graph Consumer connect with our Business Dollar Graph Growth Success PowerPoint Templates And PowerPoint Themes 0712. Enhance customer connectivity of your thoughts.
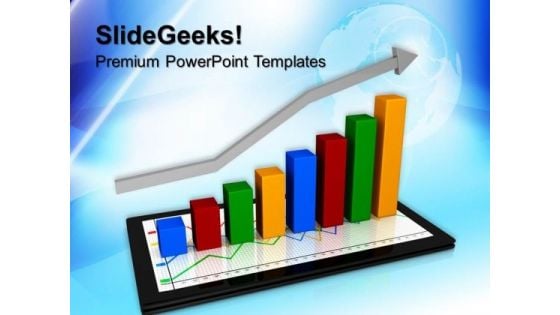
Computer Tablet With Graph Arrow Business PowerPoint Templates And PowerPoint Themes 0712
Computer Tablet With Graph Arrow Business PowerPoint Templates And PowerPoint Themes Business Power Points-Microsoft Powerpoint Templates and Background with tablets with a business graph Make your audience feel exclusive with our Computer Tablet With Graph Arrow Business PowerPoint Templates And PowerPoint Themes 0712. Give them special attention with your thoughts.


 Continue with Email

 Home
Home


