Graph

White And Yellow Bar Graph Business Shapes PowerPoint Templates And PowerPoint Themes 1012
White And Yellow Bar Graph Business Shapes PowerPoint Templates And PowerPoint Themes 1012-Use this Above PowerPoint Template Displaying the Bar Graph in Circular Manner. It indicates beefing up, boost, buildup, crop, cultivation, enlargement, evolution, gain, heightening, hike, improvement, increase. Original thinking is the need of the hour. We provide the means to project your views.-White And Yellow Bar Graph Business Shapes PowerPoint Templates And PowerPoint Themes 1012-This PowerPoint template can be used for presentations relating to-Bar graph showing the growth, business, finance, success, marketing, shapes The environment deserves constant attention. Keep an eye through our White And Yellow Bar Graph Business Shapes PowerPoint Templates And PowerPoint Themes 1012.
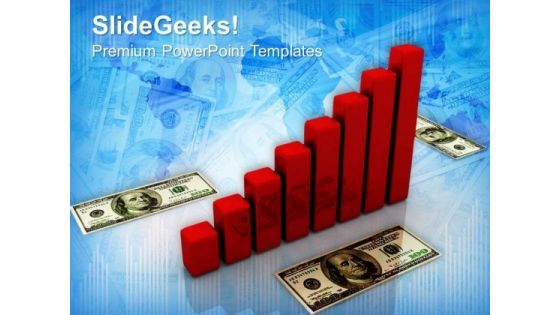
Bar Graph With Dollar Marketing PowerPoint Templates And PowerPoint Themes 1012
Bar Graph with Dollar Marketing PowerPoint Templates And PowerPoint Themes 1012-Emphatically define your message with our above template which contains a graphic of bar graph with dollar notes. This image clearly defines the concept of business statistics and financial reviews. Our stunning image makes your presentations professional showing that you care about even the smallest details. Create captivating presentations to deliver comparative and weighted arguments.-Bar Graph with Dollar Marketing PowerPoint Templates And PowerPoint Themes 1012-This PowerPoint template can be used for presentations relating to-Business graph and dollar, money, finance, success, business, marketing Your career will soar away. Our Bar Graph With Dollar Marketing PowerPoint Templates And PowerPoint Themes 1012 will give it wings.
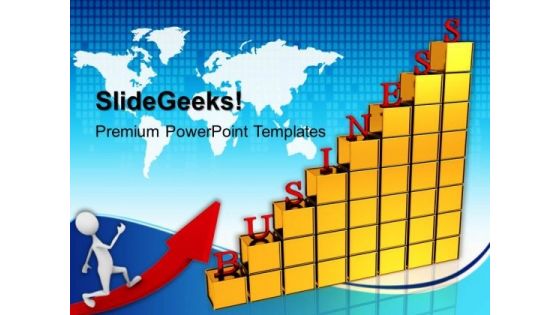
A Corporate Business Growth Graph PowerPoint Templates And PowerPoint Themes 1012
A Corporate Business Growth Graph PowerPoint Templates And PowerPoint Themes 1012-This PowerPoint Template shows the Bar Graph with increasing percentage which signifies the Financial or Business Growth. The Template signifies business concept. It signifies teamwork and team leader. Use this template for Global Business. The structure of our templates allows you to effectively highlight the key issues concerning the growth of your business.-A Corporate Business Growth Graph PowerPoint Templates And PowerPoint Themes 1012-This PowerPoint template can be used for presentations relating to-Business bar graph chart, technology, finance, arrows, business, success Our A Corporate Business Growth Graph PowerPoint Templates And PowerPoint Themes 1012 encourage an ethical approach. Exhort your team to stay above board.
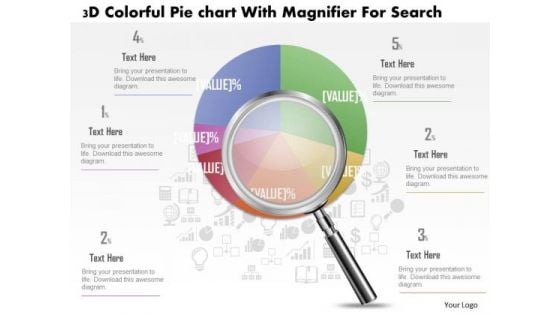
Business Diagram 3d Colorful Pie Graph With Magnifier Data Search PowerPoint Slide
This business slide displays 3d colorful pie graph with magnifier. This diagram is a data visualization tool that gives you a simple way to present statistical information. This slide helps your audience examine and interpret the data you present.
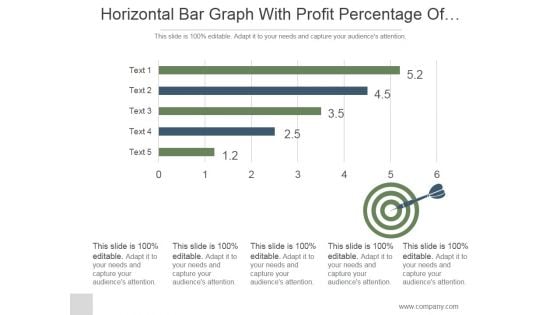
Horizontal Bar Graph With Profit Percentage Of Company Ppt PowerPoint Presentation Shapes
This is a horizontal bar graph with profit percentage of company ppt powerpoint presentation shapes. This is a five stage process. The stages in this process are business, strategy, marketing, analysis, slide bar, target.
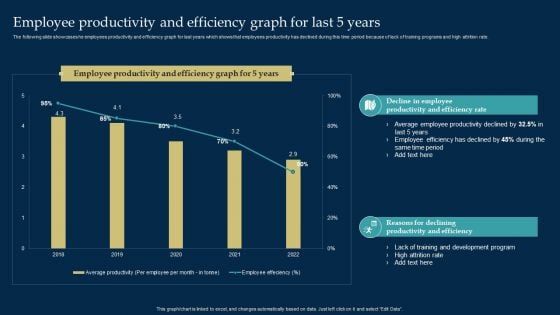
Employee Training And Development Strategy Employee Productivity And Efficiency Graph For Last 5 Years Graphics PDF
The following slide showcases he employees productivity and efficiency graph for last years which shows that employees productivity has declined during this time period because of lack of training programs and high attrition rate. Do you know about Slidesgeeks Employee Training And Development Strategy Employee Productivity And Efficiency Graph For Last 5 Years Graphics PDF These are perfect for delivering any kind od presentation. Using it, create PowerPoint presentations that communicate your ideas and engage audiences. Save time and effort by using our pre designed presentation templates that are perfect for a wide range of topic. Our vast selection of designs covers a range of styles, from creative to business, and are all highly customizable and easy to edit. Download as a PowerPoint template or use them as Google Slides themes.
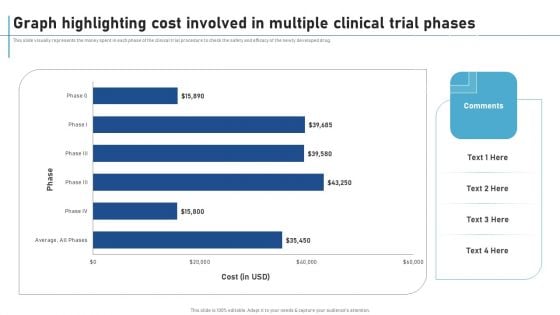
Graph Highlighting Cost Involved In Multiple Clinical Trial Phases New Clinical Drug Trial Process Mockup PDF
This slide visually represents the money spent in each phase of the clinical trial procedure to check the safety and efficacy of the newly developed drug. Find highly impressive Graph Highlighting Cost Involved In Multiple Clinical Trial Phases New Clinical Drug Trial Process Mockup PDF on Slidegeeks to deliver a meaningful presentation. You can save an ample amount of time using these presentation templates. No need to worry to prepare everything from scratch because Slidegeeks experts have already done a huge research and work for you. You need to download Graph Highlighting Cost Involved In Multiple Clinical Trial Phases New Clinical Drug Trial Process Mockup PDF for your upcoming presentation. All the presentation templates are 100 percent editable and you can change the color and personalize the content accordingly. Download now.
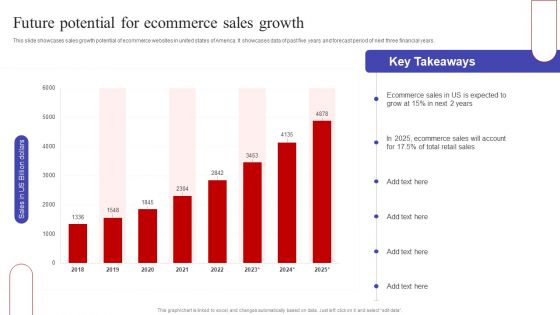
Future Potential For Ecommerce Sales Growth Ppt PowerPoint Presentation Diagram Graph Charts PDF
This slide showcases sales growth potential of ecommerce websites in united states of America. It showcases data of past five years and forecast period of next three financial years. Here you can discover an assortment of the finest PowerPoint and Google Slides templates. With these templates, you can create presentations for a variety of purposes while simultaneously providing your audience with an eye catching visual experience. Download Future Potential For Ecommerce Sales Growth Ppt PowerPoint Presentation Diagram Graph Charts PDF to deliver an impeccable presentation. These templates will make your job of preparing presentations much quicker, yet still, maintain a high level of quality. Slidegeeks has experienced researchers who prepare these templates and write high quality content for you. Later on, you can personalize the content by editing the Future Potential For Ecommerce Sales Growth Ppt PowerPoint Presentation Diagram Graph Charts PDF.
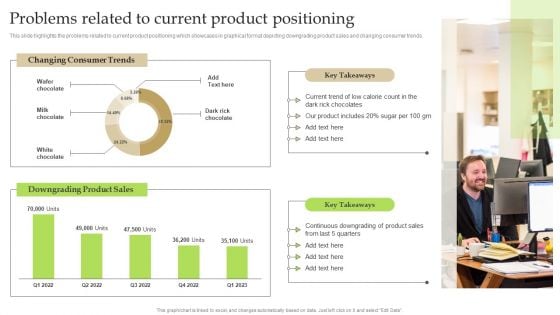
Problems Related To Current Product Positioning Ppt PowerPoint Presentation Diagram Graph Charts PDF
This slide highlights the problems related to current product positioning which showcases in graphical format depicting downgrading product sales and changing consumer trends. Do you have an important presentation coming up Are you looking for something that will make your presentation stand out from the rest Look no further than Problems Related To Current Product Positioning Ppt PowerPoint Presentation Diagram Graph Charts PDF. With our professional designs, you can trust that your presentation will pop and make delivering it a smooth process. And with Slidegeeks, you can trust that your presentation will be unique and memorable. So why wait Grab Problems Related To Current Product Positioning Ppt PowerPoint Presentation Diagram Graph Charts PDF today and make your presentation stand out from the rest
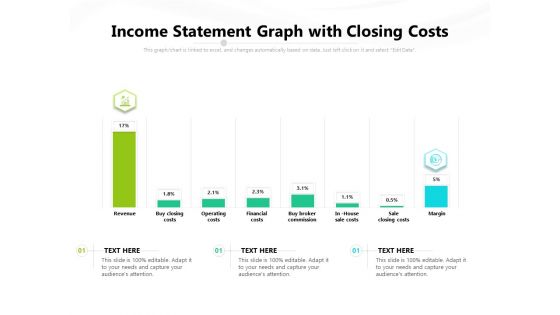
Income Statement Graph With Closing Costs Ppt PowerPoint Presentation Gallery Example Topics PDF
Presenting this set of slides with name income statement graph with closing costs ppt powerpoint presentation gallery example topics pdf. The topics discussed in these slides are revenue, buy closing costs, operating costs, financial costs, buy broker commission, in house sale costs, sale closing costs, margin. This is a completely editable PowerPoint presentation and is available for immediate download. Download now and impress your audience.
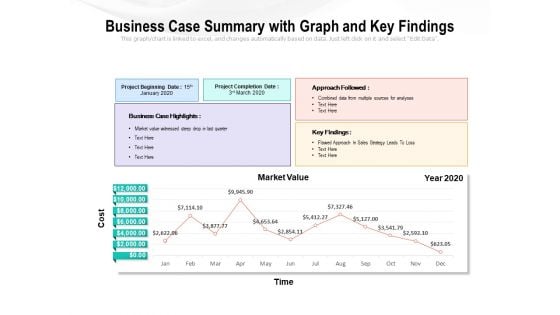
Business Case Summary With Graph And Key Findings Ppt PowerPoint Presentation Outline Design Templates PDF
Pitch your topic with ease and precision using this business case summary with graph and key findings ppt powerpoint presentation outline design templates pdf. This layout presents information on business case highlights, market value, time, approach followed, key findings, year 2020, cost. It is also available for immediate download and adjustment. So, changes can be made in the color, design, graphics or any other component to create a unique layout.
Downturn Graph Showing Decrease In Income Over The Years Ppt PowerPoint Presentation Icon File Formats PDF
Showcasing this set of slides titled downturn graph showing decrease in income over the years ppt powerpoint presentation icon file formats pdf. The topics addressed in these templates are middle class share of total income, middle class share of income, union membership rate, 2013 to 2020. All the content presented in this PPT design is completely editable. Download it and make adjustments in color, background, font etc. as per your unique business setting.
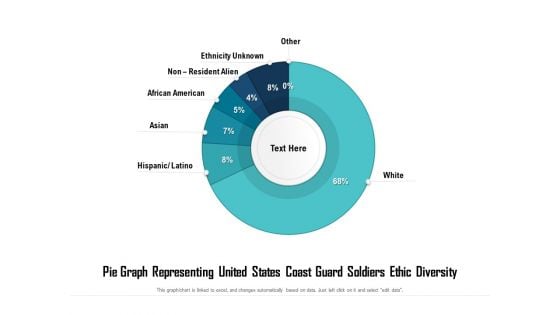
Pie Graph Representing United States Coast Guard Soldiers Ethic Diversity Ppt PowerPoint Presentation Layouts Backgrounds PDF
Pitch your topic with ease and precision using this pie graph representing united states coast guard soldiers ethic diversity ppt powerpoint presentation layouts backgrounds pdf. This layout presents information on hispanic, latino, asian, african american, ethnicity unknown, non resident alien. It is also available for immediate download and adjustment. So, changes can be made in the color, design, graphics or any other component to create a unique layout.
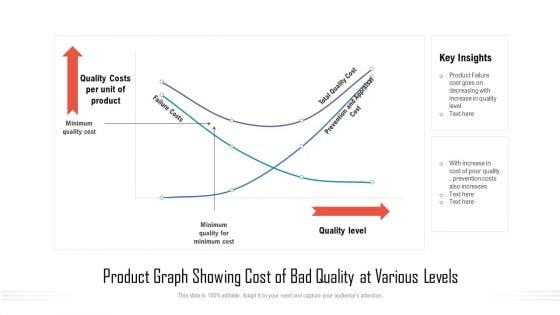
Product Graph Showing Cost Of Bad Quality At Various Levels Ppt PowerPoint Styles Model PDF
Pitch your topic with ease and precision using this product graph showing cost of bad quality at various levels ppt powerpoint styles model pdf. This layout presents information on minimum quality cost, minimum quality for minimum cost, total quality cost. It is also available for immediate download and adjustment. So, changes can be made in the color, design, graphics or any other component to create a unique layout.
Expenses And Income Comparison Graph With Budget Summary Ppt PowerPoint Presentation Icon Inspiration PDF
This slide illustrates budget summary of expenditure of a company. it includes income and expenditure comparative data and expenditure chart etc.Pitch your topic with ease and precision using this Expenses And Income Comparison Graph With Budget Summary Ppt PowerPoint Presentation Icon Inspiration PDF. This layout presents information on Budget Summary, Expenditure Comparative, Actual Income. It is also available for immediate download and adjustment. So, changes can be made in the color, design, graphics or any other component to create a unique layout.
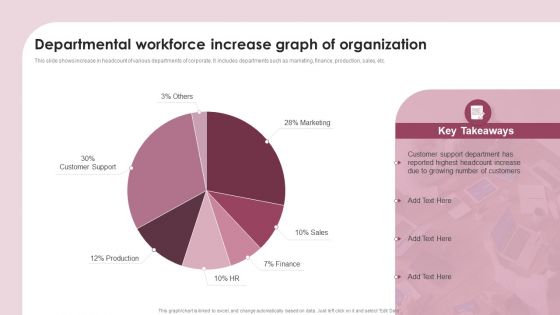
Departmental Workforce Increase Graph Of Organization Ppt Infographics Graphics Pictures PDF
This slide shows increase in headcount of various departments of corporate. It includes departments such as marketing, finance, production, sales, etc. Showcasing this set of slides titled Departmental Workforce Increase Graph Of Organization Ppt Infographics Graphics Pictures PDF. The topics addressed in these templates are Customer Support Department, Number Customers, Highest Headcount. All the content presented in this PPT design is completely editable. Download it and make adjustments in color, background, font etc. as per your unique business setting.
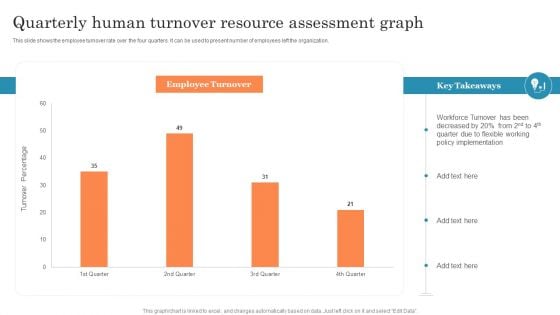
Quarterly Human Turnover Resource Assessment Graph Ppt PowerPoint Presentation Styles Infographic Template PDF
This slide shows the employee turnover rate over the four quarters. It can be used to present number of employees left the organization. Showcasing this set of slides titled Quarterly Human Turnover Resource Assessment Graph Ppt PowerPoint Presentation Styles Infographic Template PDF. The topics addressed in these templates are Flexible Working, Policy Implementation, Turnover Been. All the content presented in this PPT design is completely editable. Download it and make adjustments in color, background, font etc. as per your unique business setting.
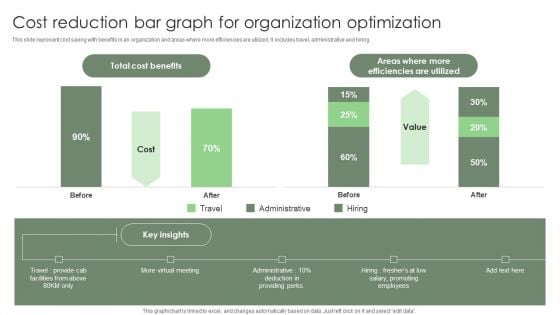
Cost Reduction Bar Graph For Organization Optimization Ppt Inspiration Vector PDF
This slide represent cost saving with benefits in an organization and areas where more efficiencies are utilized. It includes travel, administrative and hiring. Pitch your topic with ease and precision using this Cost Reduction Bar Graph For Organization Optimization Ppt Inspiration Vector PDF. This layout presents information on Total Cost Benefits, Promoting Employees, Providing Perks. It is also available for immediate download and adjustment. So, changes can be made in the color, design, graphics or any other component to create a unique layout.
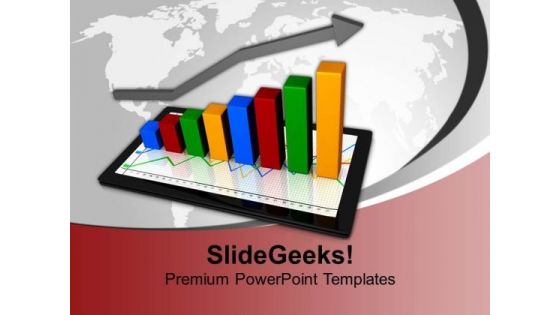
Computer Tablet With Graph Business PowerPoint Templates And PowerPoint Themes 1012
Computer Tablet With Graph Business PowerPoint Templates And PowerPoint Themes 1012-Develop competitive advantage with our above template which contains a diagram of computer tablet with bra graph showing success and growth. It portrays the concept of account, balance, business, data, economy, finance, graph, growth, information, investment, market, profit, report, research, statistics and success. Adjust the above image in your PPT presentations to visually support your content in your Business and Financial PPT slideshows. Present your views using our innovative slides and be assured of leaving a lasting impression.-Computer Tablet With Graph Business PowerPoint Templates And PowerPoint Themes 1012-This PowerPoint template can be used for presentations relating to-Computer Tablet With Graph, Arrows, Finance, Business, Marketing, Symbol Our Computer Tablet With Graph Business PowerPoint Templates And PowerPoint Themes 1012 will keep the faith. They will show allegiance to your thoughts.
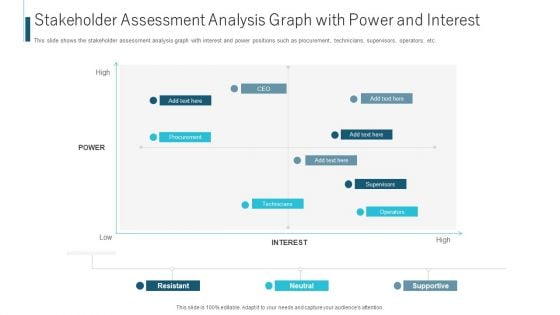
Stakeholder Assessment Analysis Graph With Power And Interest Ppt Gallery Skills PDF
This slide shows the stakeholder assessment analysis graph with interest and power positions such as procurement, technicians, supervisors, operators, etc. This is a stakeholder assessment analysis graph with power and interest ppt gallery skills pdf. template with various stages. Focus and dispense information on four stages using this creative set, that comes with editable features. It contains large content boxes to add your information on topics like technicians, procurement, supervisors, operators. You can also showcase facts, figures, and other relevant content using this PPT layout. Grab it now.
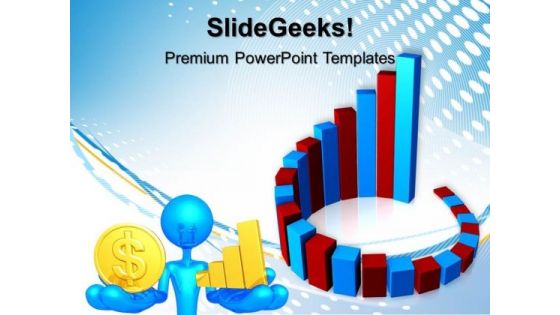
Render Of Circular Bar Graph Progress PowerPoint Templates And PowerPoint Themes 1012
Render Of Circular Bar Graph Progress PowerPoint Templates And PowerPoint Themes 1012-Microsoft Powerpoint Templates and Background with circular progress bars- Circular Bar Graph Progress PowerPoint Templates And PowerPoint Themes 1012-This PowerPoint template can be used for presentations relating to-Circular progress bars, business, success, finance, marketing, shapes Make unique presentations with our Render Of Circular Bar Graph Progress PowerPoint Templates And PowerPoint Themes 1012. You'll always stay ahead of the game.
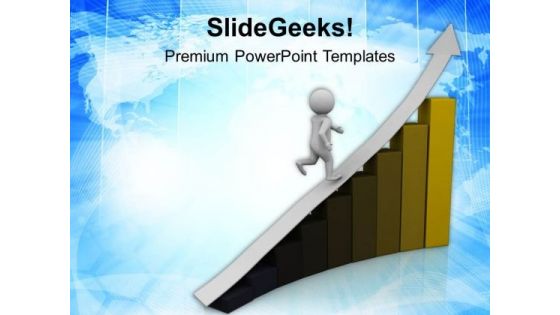
Bar Graph For Business Growth PowerPoint Templates Ppt Backgrounds For Slides 0413
Get the doers into action. Activate them with our Bar Graph For Business Growth PowerPoint Templates PPT Backgrounds For Slides 0413. Put your money on our Bar Graph For Business Growth PowerPoint Templates PPT Backgrounds For Slides 0413. Your ideas will rake in the dollars. Integrate teams with our Bar Graph For Business Growth PowerPoint Templates Ppt Backgrounds For Slides 0413. Download without worries with our money back guaranteee.
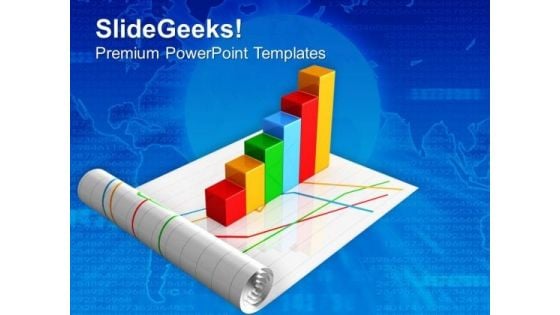
Bar Graph Finance Marketing Result PowerPoint Templates Ppt Backgrounds For Slides 0413
Document the process on our Bar Graph Finance Marketing Result PowerPoint Templates PPT Backgrounds For Slides 0413. Make a record of every detail. Satiate desires with our Bar Graph Finance Marketing Result PowerPoint Templates PPT Backgrounds For Slides 0413. Give them all they want and more. Assist yourself with our Bar Graph Finance Marketing Result PowerPoint Templates Ppt Backgrounds For Slides 0413. Download without worries with our money back guaranteee.
Bar Graph For Finance Growth PowerPoint Templates Ppt Backgrounds For Slides 0413
Be the doer with our Bar Graph For Finance Growth PowerPoint Templates PPT Backgrounds For Slides 0413. Put your thoughts into practice. Your ideas will do the trick. Wave the wand with our Bar Graph For Finance Growth PowerPoint Templates PPT Backgrounds For Slides 0413. Educate them on the actions required. Go through the drill with our Bar Graph For Finance Growth PowerPoint Templates Ppt Backgrounds For Slides 0413.
Pie Chart For Business Graph PowerPoint Templates Ppt Backgrounds For Slides 0413
Drive your passion with our Pie Chart For Business Graph PowerPoint Templates PPT Backgrounds For Slides 0413. Steer yourself to achieve your aims. Drink from the fountain of our Pie Chart For Business Graph PowerPoint Templates PPT Backgrounds For Slides 0413. Refresh your audience with your bubbling ideas. Clip the wings of failure with our Pie Chart For Business Graph PowerPoint Templates Ppt Backgrounds For Slides 0413. You will come out on top.
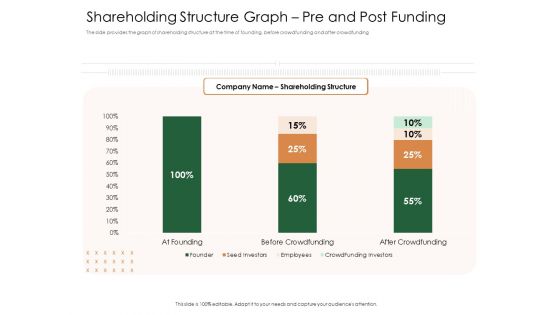
Substitute Financing Pitch Deck Shareholding Structure Graph Pre And Post Funding Rules PDF
The slide provides the graph of shareholding structure at the time of founding, before crowdfunding and after crowdfunding. Deliver an awe inspiring pitch with this creative substitute financing pitch deck shareholding structure graph pre and post funding rules pdf bundle. Topics like shareholding structure graph pre and post funding can be discussed with this completely editable template. It is available for immediate download depending on the needs and requirements of the user.

Clock Face And Graph Business PowerPoint Templates And PowerPoint Backgrounds 0411
Microsoft PowerPoint Template and Background with clock face and graph Encourage your community to take action. Get them to back the cause you champion.

Bar Graph With Global Success PowerPoint Templates And PowerPoint Themes 0412
Microsoft Powerpoint Templates and Background with success Crush doubts with our Bar Graph With Global Success PowerPoint Templates And PowerPoint Themes 0412. You will come out on top.
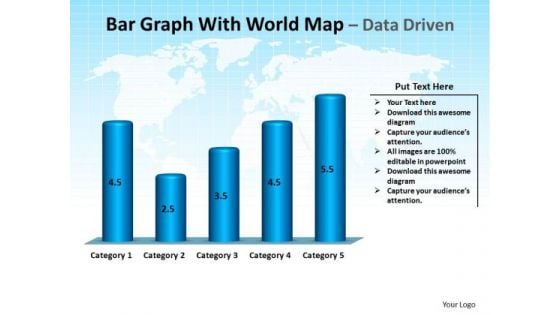
Business Success PowerPoint Templates Business Bar Graph With World Map Ppt Slides
Business Success PowerPoint Templates Business bar graph with world map PPT Slides-This PowerPoint Template is a illustration of bar garph with world map on blue background -Business Success PowerPoint Templates Business bar graph with world map PPT Slides-This ppt can be used for concepts relating to-animated, business, finance, sales, marketing, accounting, future, education, america, Antarctica, arrow, Asia, charts, statistics, budget, investment, abstract, australia, background, bar, blue, calculation, company and continents. Load up with our Business Success PowerPoint Templates Business Bar Graph With World Map Ppt Slides with our Business Success PowerPoint Templates Business Bar Graph With World Map Ppt Slides. You will be at the top of your game.

Man Climbing On Success Bar Graph PowerPoint Templates Ppt Backgrounds For Slides 0713
Rake in the dough with Lick the cream with our Man Climbing On Success Bar Graph PowerPoint Templates Ppt Backgrounds For Slides 0713. Be assured of additional benefits.
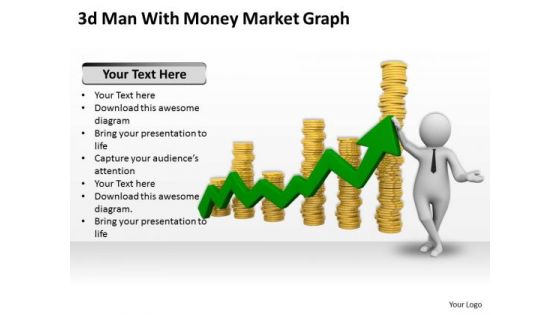
Business Strategy And Policy 3d Man With Money Market Graph Characters
Connect The Dots With Our business strategy and policy 3d man with money market graph characters Powerpoint Templates. Watch The Whole Picture Clearly Emerge.
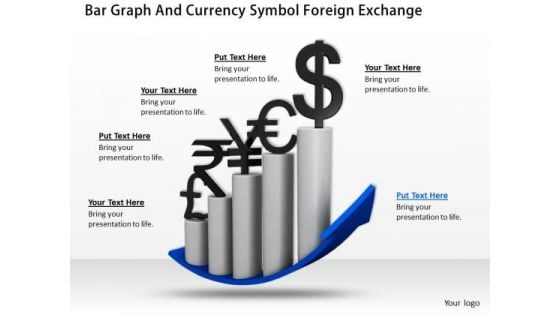
Business Strategy Plan Bar Graph And Currency Symbol Foreign Exchange Clipart
Plan For All Contingencies With Our Business Strategy Plan Bar Graph And Currency Symbol Foreign Exchange Clipart Powerpoint Templates. Douse The Fire Before It Catches.
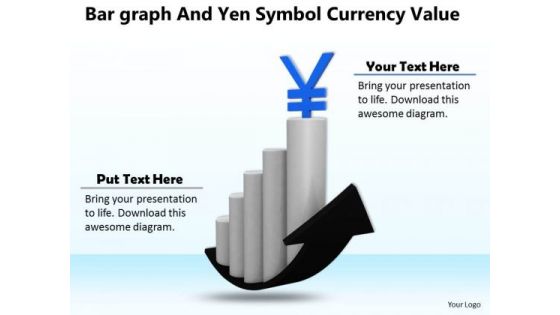
Business Strategy Plan Bar Graph And Yen Symbol Currency Value Clipart
Good Camaraderie Is A Key To Teamwork. Our Business Strategy Plan Bar Graph And Yen Symbol Currency Value Clipart Powerpoint Templates Can Be A Cementing Force.
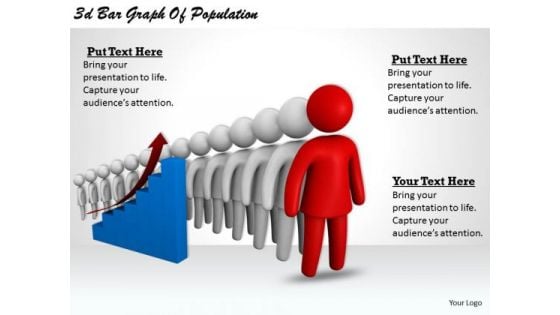
Business Strategy And Policy 3d Bar Graph Of Population Character Models
Put In A Dollop Of Our business strategy and policy 3d bar graph of population character models Powerpoint Templates. Give Your Thoughts A Distinctive Flavor.
Business Strategy And Policy 3d Confused Man Front Of Bar Graph Character Models
Doll Up Your Thoughts With Our business strategy and policy 3d confused man front of bar graph character models Powerpoint Templates. They Will Make A Pretty Picture.
Business Strategy Consultants Build New Bar Graph For Marketing 3d Character Modeling
Our business strategy consultants build new bar graph for marketing 3d character modeling Powerpoint Templates Abhor Doodling. They Never Let The Interest Flag.
Modern Marketing Concepts 3d Man Bar Graph With Laptop Business Statement
Plan For All Contingencies With Our modern marketing concepts 3d man bar graph with laptop business statement Powerpoint Templates. Douse The Fire Before It Catches.
Stock Photo Business Strategy Review Growth Ladders On Bar Graph Icons
Our Stock Photo Business Strategy Review Growth Ladders On Bar Graph Icons Powerpoint Templates Allow You To Do It With Ease. Just Like Picking The Low Hanging Fruit.
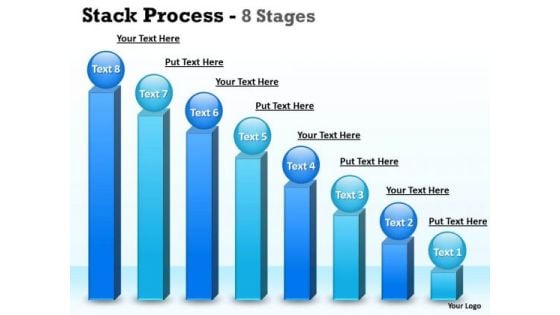
Business Cycle Diagram Eight Stages Stack Diagram Business Bar Graph Strategy Diagram
Get Out Of The Dock With Our Business Cycle Diagram Eight Stages Stack Diagram Business Bar Graph Strategy Diagram Powerpoint Templates. Your Mind Will Be Set Free.
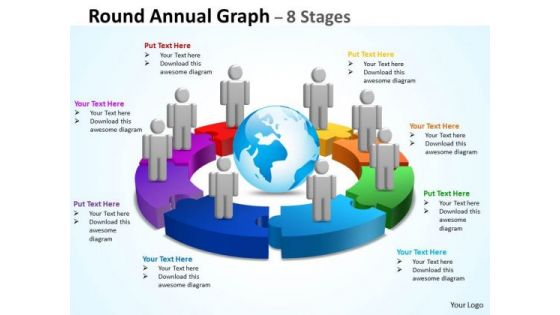
Business Diagram Round Annual Graph 8 Stages Business Finance Strategy Development
Our Business Diagram Round Annual Graph 8 Stages Business Finance Strategy Development Powerpoint Templates Team Are A Dogged Lot. They Keep At It Till They Get It Right.
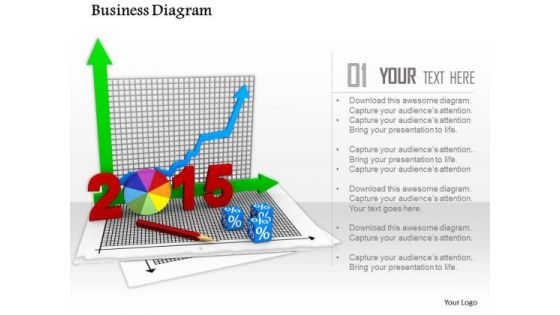
Stock Photo Bar And Pie Graph For Year 2015 PowerPoint Slide
Get Out Of The Dock With Our stock photo bar and pie graph for year 2015 powerpoint slide Powerpoint Templates. Your Mind Will Be Set Free.
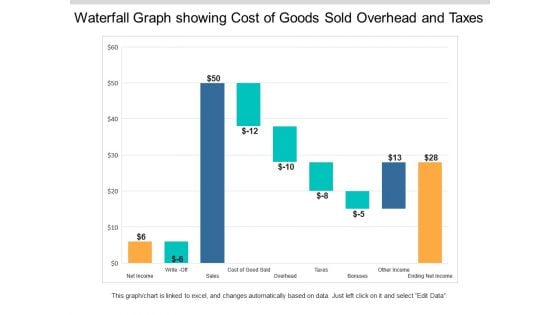
Waterfall Graph Showing Cost Of Goods Sold Overhead And Taxes Ppt PowerPoint Presentation Styles Example Topics
This is a waterfall graph showing cost of goods sold overhead and taxes ppt powerpoint presentation styles example topics. This is a three stage process. The stages in this process are profit and loss, balance sheet, income statement, benefit and loss.
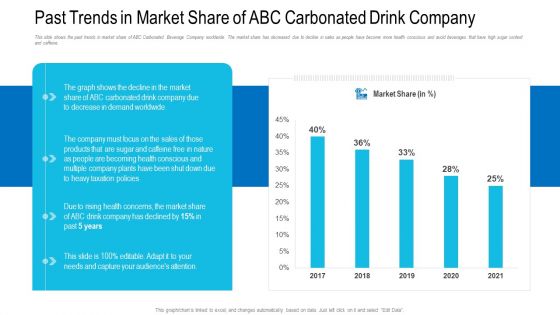
Past Trends In Market Share Of ABC Carbonated Drink Company Ppt Diagram Graph Charts PDF
This slide shows the past trends in market share of ABC Carbonated Beverage Company worldwide. The market share has decreased due to decline in sales as people have become more health conscious and avoid beverages that have high sugar content and caffeine. Deliver an awe inspiring pitch with this creative past trends in market share of abc carbonated drink company ppt diagram graph charts pdf bundle. Topics like past trends in market share of abc carbonated drink company can be discussed with this completely editable template. It is available for immediate download depending on the needs and requirements of the user.
Bar Graph Representing Accomplishment Metrics For Customer Service Team Icons PDF
This slide shows the graphical representation of success metrics that helps to measure the customer service team which includes customer lifetime value, customer churn, net promoter score, revenues churn, customer experience score, customer renewals, etc. Showcasing this set of slides titled bar graph representing accomplishment metrics for customer service team icons pdf. The topics addressed in these templates are importance level, least important. All the content presented in this PPT design is completely editable. Download it and make adjustments in color, background, font etc. as per your unique business setting.
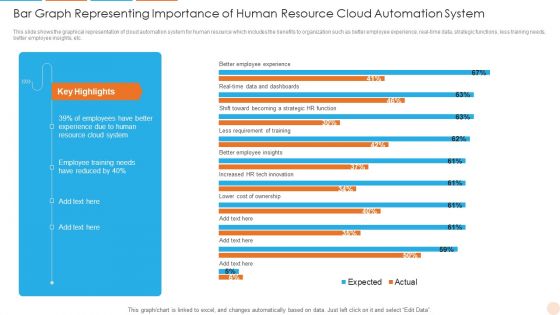
Bar Graph Representing Importance Of Human Resource Cloud Automation System Background PDF
This slide shows the graphical representation of cloud automation system for human resource which includes the benefits to organization such as better employee experience, real time data, strategic functions, less training needs, better employee insights, etc. Showcasing this set of slides titled Bar Graph Representing Importance Of Human Resource Cloud Automation System Background PDF. The topics addressed in these templates are System, Resource, Reduced. All the content presented in this PPT design is completely editable. Download it and make adjustments in color, background, font etc. as per your unique business setting.
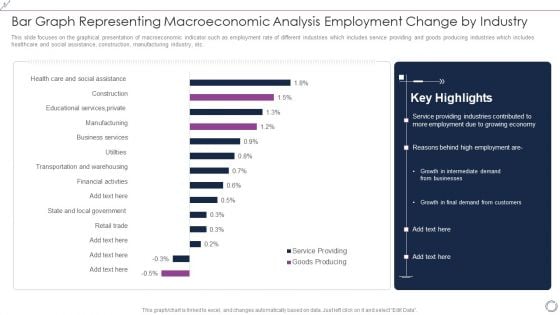
Bar Graph Representing Macroeconomic Analysis Employment Change By Industry Background PDF
This slide focuses on the graphical presentation of macroeconomic indicator such as employment rate of different industries which includes service providing and goods producing industries which includes healthcare and social assistance, construction, manufacturing industry, etc. Pitch your topic with ease and precision using this Bar Graph Representing Macroeconomic Analysis Employment Change By Industry Background PDF. This layout presents information on Goods Producing, Service Providing, Financial, Business. It is also available for immediate download and adjustment. So, changes can be made in the color, design, graphics or any other component to create a unique layout.
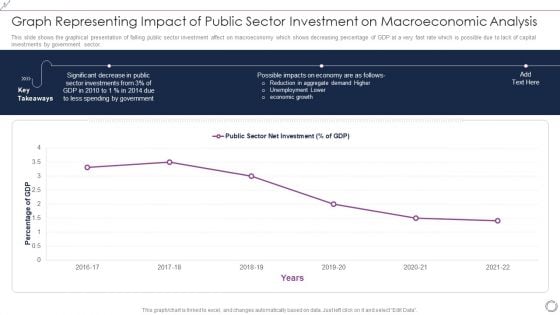
Graph Representing Impact Of Public Sector Investment On Macroeconomic Analysis Themes PDF
This slide shows the graphical presentation of falling public sector investment affect on macroeconomy which shows decreasing percentage of GDP at a very fast rate which is possible due to lack of capital investments by government sector. Showcasing this set of slides titled Graph Representing Impact Of Public Sector Investment On Macroeconomic Analysis Themes PDF. The topics addressed in these templates are Percentage GDP, 2016 to 2022, Public Sector Net Investment. All the content presented in this PPT design is completely editable. Download it and make adjustments in color, background, font etc. as per your unique business setting.
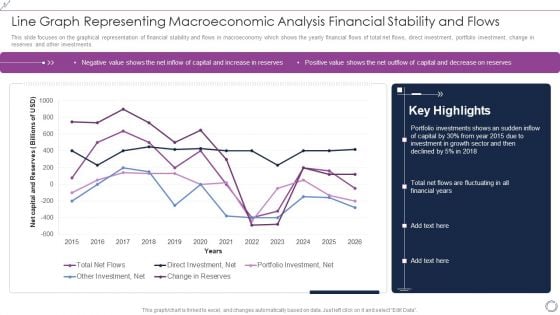
Line Graph Representing Macroeconomic Analysis Financial Stability And Flows Rules PDF
This slide focuses on the graphical representation of financial stability and flows in macroeconomy which shows the yearly financial flows of total net flows, direct investment, portfolio investment, change in reserves and other investments. Showcasing this set of slides titled Line Graph Representing Macroeconomic Analysis Financial Stability And Flows Rules PDF. The topics addressed in these templates are Total Net Flows, Direct Investment, Net, Portfolio Investment, Net. All the content presented in this PPT design is completely editable. Download it and make adjustments in color, background, font etc. as per your unique business setting.
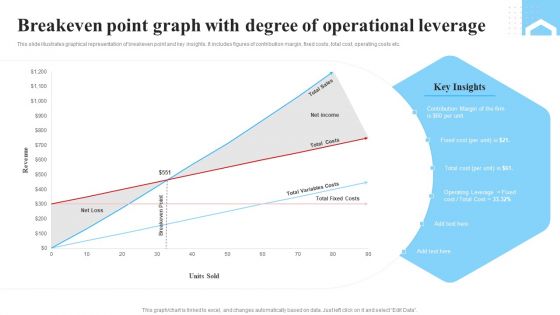
Breakeven Point Graph With Degree Of Operational Leverage Ppt Layouts Graphics Pictures PDF
This slide illustrates graphical representation of breakeven point and key insights. It includes figures of contribution margin, fixed costs, total cost, operating costs etc. Showcasing this set of slides titled Breakeven Point Graph With Degree Of Operational Leverage Ppt Layouts Graphics Pictures PDF. The topics addressed in these templates are Total Sales, Net income, Total Costs, Total Variables Costs. All the content presented in this PPT design is completely editable. Download it and make adjustments in color, background, font etc. as per your unique business setting.

6 Year Revenue Declining Graph Ppt PowerPoint Presentation Outline Sample PDF
This slide shows the revenues of the company over the last years to have a clear idea of organization growth and financial status . It includes the 6 year 2017 to 2022 revenue earned by the company.Showcasing this set of slides titled 6 Year Revenue Declining Graph Ppt PowerPoint Presentation Outline Sample PDF. The topics addressed in these templates are Revenue Company, Highest Comparison, Conditions Restrictions. All the content presented in this PPT design is completely editable. Download it and make adjustments in color, background, font etc. as per your unique business setting.
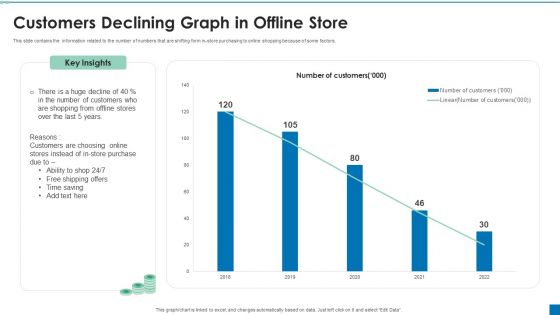
Customers Declining Graph In Offline Store Ppt PowerPoint Presentation Professional Clipart PDF
This slide contains the information related to the number of numbers that are shifting form in-store purchasing to online shopping because of some factors. Pitch your topic with ease and precision using this Customers Declining Graph In Offline Store Ppt PowerPoint Presentation Professional Clipart PDF. This layout presents information on Customers Choosing, Store Purchase, Time Saving. It is also available for immediate download and adjustment. So, changes can be made in the color, design, graphics or any other component to create a unique layout.
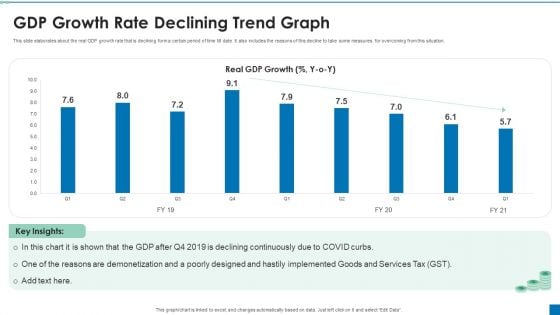
GDP Growth Rate Declining Trend Graph Ppt PowerPoint Presentation Slides Professional PDF
This slide elaborates about the real GDP growth rate that is declining form a certain period of time till date. It also includes the reasons of this decline to take some measures for overcoming from this situation. Showcasing this set of slides titled GDP Growth Rate Declining Trend Graph Ppt PowerPoint Presentation Slides Professional PDF. The topics addressed in these templates are Declining Continuously, Poorly Designed, Reasons Demonetization. All the content presented in this PPT design is completely editable. Download it and make adjustments in color, background, font etc. as per your unique business setting.
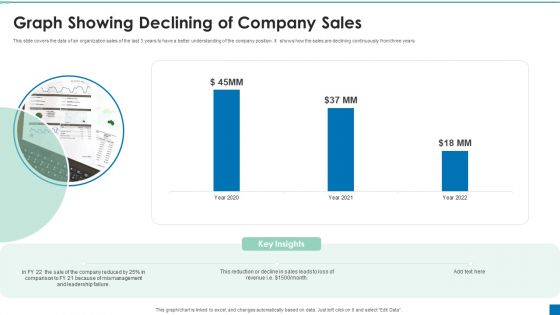
Graph Showing Declining Of Company Sales Ppt PowerPoint Presentation Portfolio Graphics Example PDF
This slide covers the data of an organization sales of the last 3 years to have a better understanding of the company position. It shows how the sales are declining continuously from three years.Pitch your topic with ease and precision using this Graph Showing Declining Of Company Sales Ppt PowerPoint Presentation Portfolio Graphics Example PDF. This layout presents information on Reduction Decline, Comparison, Mismanagement. It is also available for immediate download and adjustment. So, changes can be made in the color, design, graphics or any other component to create a unique layout.
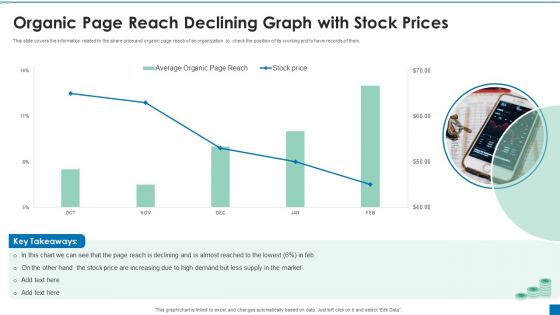
Organic Page Reach Declining Graph With Stock Prices Ppt PowerPoint Presentation Ideas Styles PDF
This slide covers the information related to the share price and organic page reach of an organization to check the position of its working and to have records of them.Pitch your topic with ease and precision using this Organic Page Reach Declining Graph With Stock Prices Ppt PowerPoint Presentation Ideas Styles PDF. This layout presents information on Increasing High, Reach Declining, Supply Market. It is also available for immediate download and adjustment. So, changes can be made in the color, design, graphics or any other component to create a unique layout.
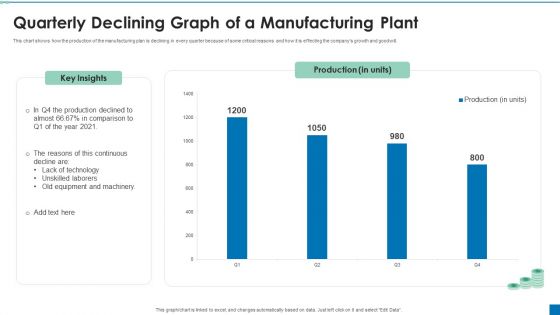
Quarterly Declining Graph Of A Manufacturing Plant Ppt PowerPoint Presentation File Example Topics PDF
This chart shows how the production of the manufacturing plan is declining in every quarter because of some critical reasons and how it is effecting the companys growth and goodwill. Showcasing this set of slides titled Quarterly Declining Graph Of A Manufacturing Plant Ppt PowerPoint Presentation File Example Topics PDF. The topics addressed in these templates are Production Declined, Lack Of Technology, Unskilled Laborers. All the content presented in this PPT design is completely editable. Download it and make adjustments in color, background, font etc. as per your unique business setting.
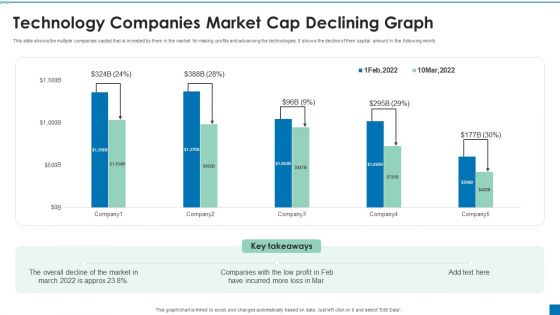
Technology Companies Market Cap Declining Graph Ppt PowerPoint Presentation File Smartart PDF
This slide shows the multiple companies capital that is invested by them in the market for making profits and advancing the technologies. It shows the decline of their capital amount in the following month. Pitch your topic with ease and precision using this Technology Companies Market Cap Declining Graph Ppt PowerPoint Presentation File Smartart PDF. This layout presents information on Overall Decline, Companies Low, Incurred Mor. It is also available for immediate download and adjustment. So, changes can be made in the color, design, graphics or any other component to create a unique layout.
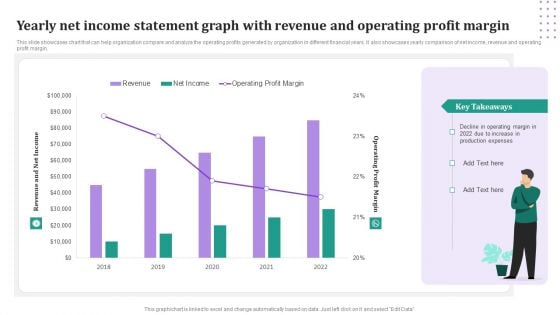
Yearly Net Income Statement Graph With Revenue And Operating Profit Margin Download PDF
This slide showcases chart that can help organization compare and analyze the operating profits generated by organization in different financial years. It also showcases yearly comparison of net income, revenue and operating profit margin. Pitch your topic with ease and precision using this Yearly Net Income Statement Graph With Revenue And Operating Profit Margin Download PDF. This layout presents information on Revenue, Net Income, Operating Profit Margin. It is also available for immediate download and adjustment. So, changes can be made in the color, design, graphics or any other component to create a unique layout.
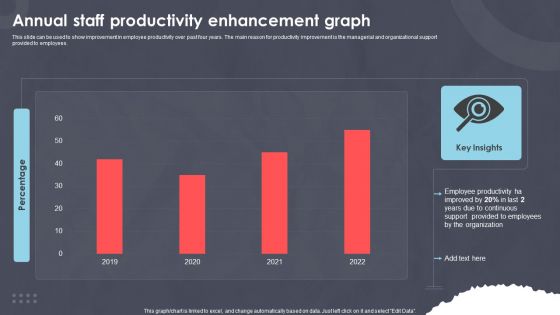
Annual Staff Productivity Enhancement Graph Ppt PowerPoint Presentation Styles Aids PDF
This slide can be used to show improvement in employee productivity over past four years. The main reason for productivity improvement is the managerial and organizational support provided to employees. Pitch your topic with ease and precision using this Annual Staff Productivity Enhancement Graph Ppt PowerPoint Presentation Styles Aids PDF. This layout presents information on Employee Productivity, Improved Last, Due Continuous. It is also available for immediate download and adjustment. So, changes can be made in the color, design, graphics or any other component to create a unique layout.
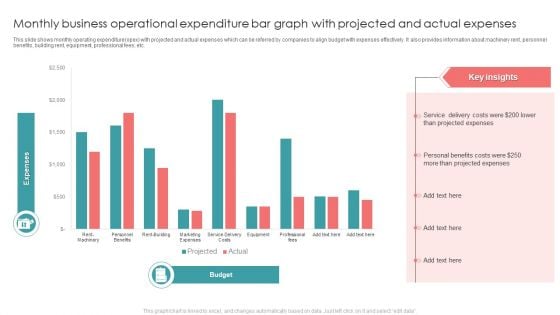
Monthly Business Operational Expenditure Bar Graph With Projected And Actual Expenses Introduction PDF
This slide shows monthly operating expenditure opex with projected and actual expenses which can be referred by companies to align budget with expenses effectively. It also provides information about machinery rent, personnel benefits, building rent, equipment, professional fees, etc. Pitch your topic with ease and precision using this Monthly Business Operational Expenditure Bar Graph With Projected And Actual Expenses Introduction PDF. This layout presents information on Projected Expenses, Costs, Service. It is also available for immediate download and adjustment. So, changes can be made in the color, design, graphics or any other component to create a unique layout.
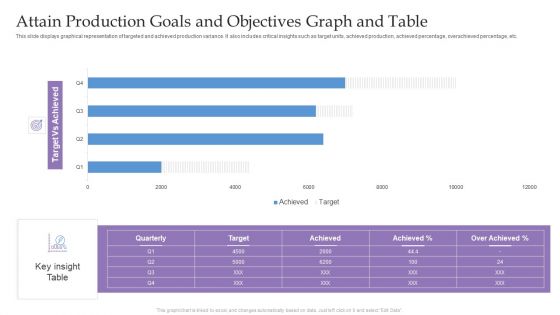
Attain Production Goals And Objectives Graph And Table Ppt Infographic Template Visuals PDF
This slide displays graphical representation of targeted and achieved production variance. It also includes critical insights such as target units, achieved production, achieved percentage, overachieved percentage, etc. Pitch your topic with ease and precision using this Attain Production Goals And Objectives Graph And Table Ppt Infographic Template Visuals PDF. This layout presents information on Target Vs Achieved, Key insight Table, Quarterly. It is also available for immediate download and adjustment. So, changes can be made in the color, design, graphics or any other component to create a unique layout.


 Continue with Email

 Home
Home


