It Project Discovery Phase
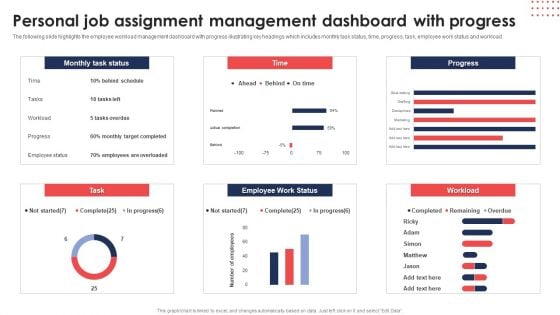
Personal Job Assignment Management Dashboard With Progress Background PDF
The following slide highlights the employee workload management dashboard with progress illustrating key headings which includes monthly task status, time, progress, task, employee work status and workload. Showcasing this set of slides titled Personal Job Assignment Management Dashboard With Progress Background PDF. The topics addressed in these templates are Monthly Task Status, Time, Progress, Employee Work Status. All the content presented in this PPT design is completely editable. Download it and make adjustments in color, background, font etc. as per your unique business setting.
KPI Dashboard For Tracking Corporate Objectives Progress Template PDF
Following slide demonstrates progress tracking dashboard to determine objectives achieved by business. It includes elements such as objectives achieved, unachieved objectives, objectives achievement in progress and all objectives status. Showcasing this set of slides titled KPI Dashboard For Tracking Corporate Objectives Progress Template PDF. The topics addressed in these templates are Objectives Achieved, Unachieved Objectives, Objectives Progress . All the content presented in this PPT design is completely editable. Download it and make adjustments in color, background, font etc. as per your unique business setting.
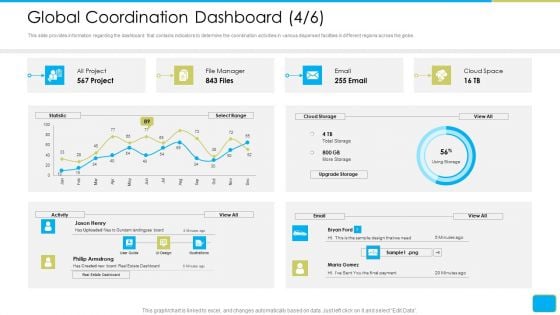
Cross Border Integration In Multinational Corporation Global Coordination Dashboard Cloud Formats PDF
This slide provides information regarding the dashboard that contains indicators to determine the coordination activities in various dispersed facilities in different regions across the globe. Deliver an awe-inspiring pitch with this creative cross border integration in multinational corporation global coordination dashboard cloud formats pdf bundle. Topics like project, cloud space, philip armstrong, cloud storage, upgrade storage can be discussed with this completely editable template. It is available for immediate download depending on the needs and requirements of the user.
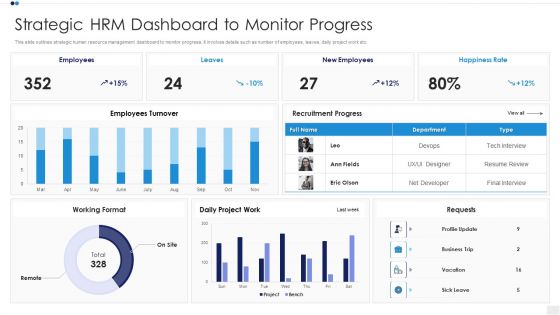
Strategic HRM Dashboard To Monitor Progress Designs PDF
Showcasing this set of slides titled trategic HRM Dashboard To Monitor Progress Designs PDF The topics addressed in these templates are Employees Turnover, Recruitment Progress, Working Format All the content presented in this PPT design is completely editable. Download it and make adjustments in color, background, font etc. as per your unique business setting.
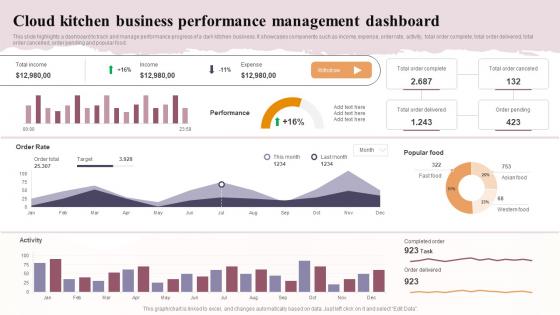
Cloud Kitchen Business Performance Management Dashboard Global Virtual Restaurant Structure Pdf
This slide highlights a dashboard to track and manage performance progress of a dark kitchen business. It showcases components such as income, expense, order rate, activity, total order complete, total order delivered, total order cancelled, order pending and popular food. Crafting an eye-catching presentation has never been more straightforward. Let your presentation shine with this tasteful yet straightforward Cloud Kitchen Business Performance Management Dashboard Global Virtual Restaurant Structure Pdf template. It offers a minimalistic and classy look that is great for making a statement. The colors have been employed intelligently to add a bit of playfulness while still remaining professional. Construct the ideal Cloud Kitchen Business Performance Management Dashboard Global Virtual Restaurant Structure Pdf that effortlessly grabs the attention of your audience. Begin now and be certain to wow your customers. This slide highlights a dashboard to track and manage performance progress of a dark kitchen business. It showcases components such as income, expense, order rate, activity, total order complete, total order delivered, total order cancelled, order pending and popular food.
Horizontal Scaling Technique For Information Team Structure For Data Management System Expansion Icons PDF
This slide represents the team structure for the data repository expansion project. It provides details regarding core and support team members in terms of job role and employee name.Deliver and pitch your topic in the best possible manner with this Horizontal Scaling Technique For Information Team Structure For Data Management System Expansion Icons PDF Use them to share invaluable insights on Documentation Information, Security Engineer, Information Security Engineer and impress your audience. This template can be altered and modified as per your expectations. So, grab it now.
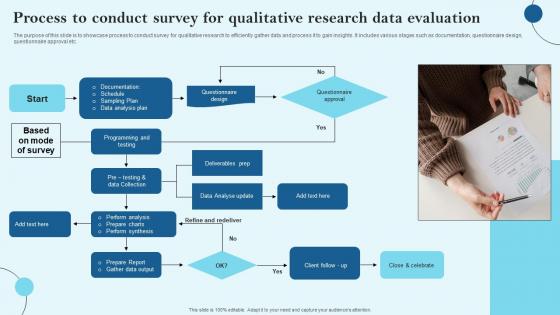
Process To Conduct Survey For Qualitative Research Data Evaluation Diagrams Pdf
The purpose of this slide is to showcase process to conduct survey for qualitative research to efficiently gather data and process it to gain insights. It includes various stages such as documentation, questionnaire design, questionnaire approval etc. Showcasing this set of slides titled Process To Conduct Survey For Qualitative Research Data Evaluation Diagrams Pdf The topics addressed in these templates are Data Analysis Plan, Data Analyse Update, Questionnaire Approval All the content presented in this PPT design is completely editable. Download it and make adjustments in color, background, font etc. as per your unique business setting. The purpose of this slide is to showcase process to conduct survey for qualitative research to efficiently gather data and process it to gain insights. It includes various stages such as documentation, questionnaire design, questionnaire approval etc.
Icon Slide Data Management Company Investor Funding Pitch Deck
Help your business to create an attention-grabbing presentation using our Icon Slide Data Management Company Investor Funding Pitch Deck set of slides. The slide contains innovative icons that can be flexibly edited. Choose this Icon Slide Data Management Company Investor Funding Pitch Deck template to create a satisfactory experience for your customers. Go ahead and click the download button. Our Icon Slide Data Management Company Investor Funding Pitch Deck are topically designed to provide an attractive backdrop to any subject. Use them to look like a presentation pro.

Business Data Analysis Chart For Case Studies PowerPoint Templates
Get Out Of The Dock With Our business data analysis chart for case studies Powerpoint Templates. Your Mind Will Be Set Free.
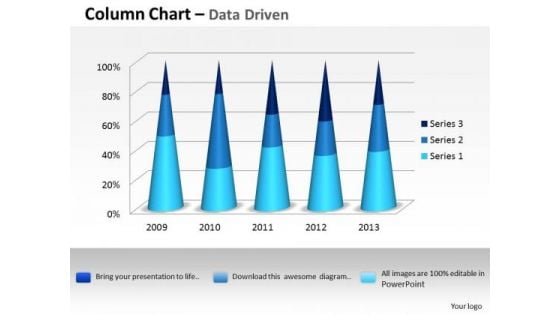
Data Analysis Excel 3d Process Variation Column Chart PowerPoint Templates
Put In A Dollop Of Our data analysis excel 3d process variation column chart Powerpoint Templates. Give Your Thoughts A Distinctive Flavor.
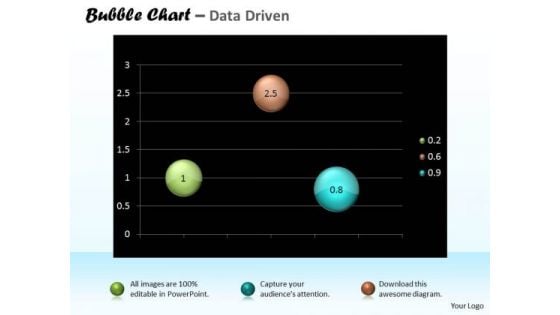
Data Analysis Excel Bubble Chart For Business Tasks PowerPoint Templates
Doll Up Your Thoughts With Our data analysis excel bubble chart for business tasks Powerpoint Templates. They Will Make A Pretty Picture.
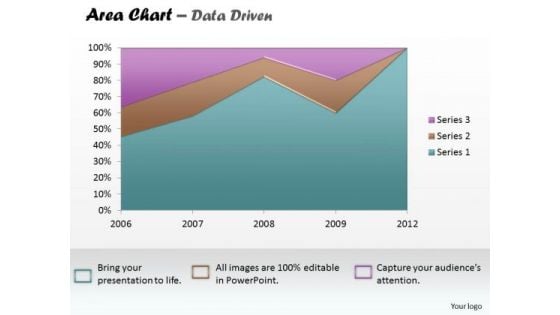
Data Analysis Excel Business Reporting Area Chart PowerPoint Templates
Establish The Dominance Of Your Ideas. Our data analysis excel business reporting area chart Powerpoint Templates Will Put Them On Top.
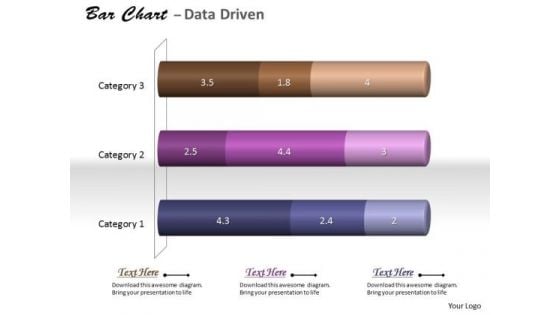
Data Analysis In Excel 3d Classification Of Chart PowerPoint Templates
With Our data analysis in excel 3d classification of chart Powerpoint Templates You Will Be Doubly Sure. They Possess That Stamp Of Authority.
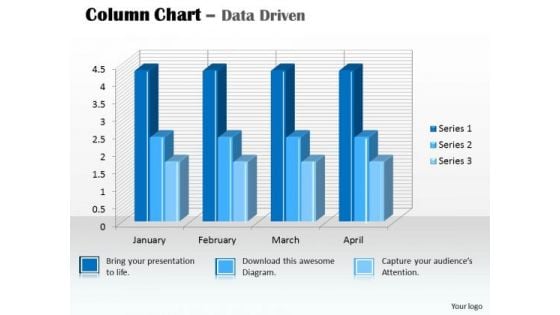
Data Analysis In Excel 3d Column Chart For PowerPoint Templates
Our data analysis in excel 3d column chart for Powerpoint Templates And Your Ideas Make A Great Doubles Pair. Play The Net With Assured Hands.
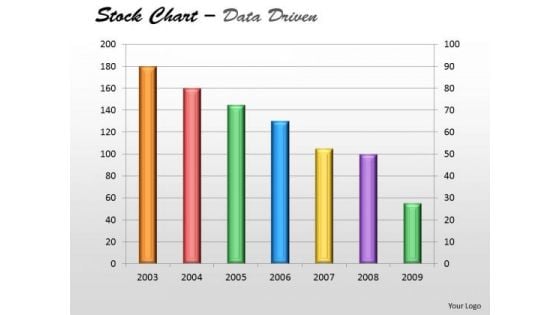
Data Analysis In Excel Of Stock Chart PowerPoint Templates
Plan Your Storyboard With Our data analysis in excel of stock chart Powerpoint Templates . Give An Outline To The Solutions You Have.
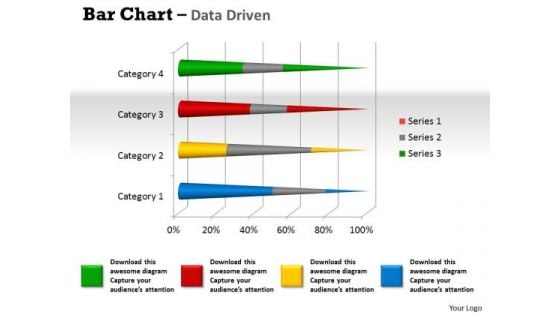
Data Analysis Programs 3d Bar Chart To Dispaly PowerPoint Templates
Lower The Drawbridge With Our data analysis programs 3d bar chart to dispaly Powerpoint Templates . Capture The Minds Of Your Audience.
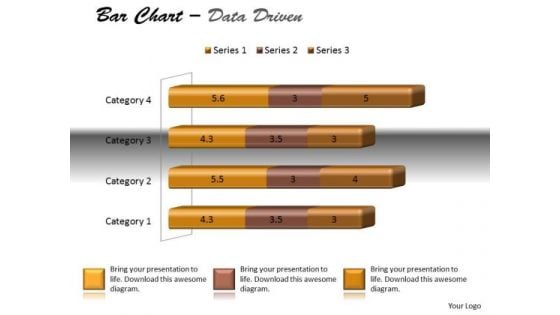
Data Analysis Techniques 3d Bar Chart For Modification PowerPoint Templates
Dreams Generate Thoughts, Thoughts Generate Ideas. Give Them Life With Our data analysis techniques 3d bar chart for modification Powerpoint Templates .
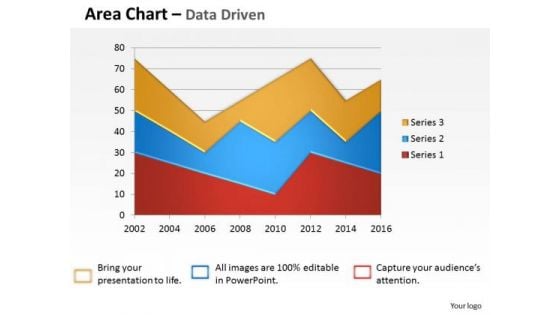
Data Analysis Template Driven Visualization Area Chart PowerPoint Slides Templates
Draw On The Energy Of Our data analysis template driven visualization area chart powerpoint slides Templates . Your Thoughts Will Perk Up.
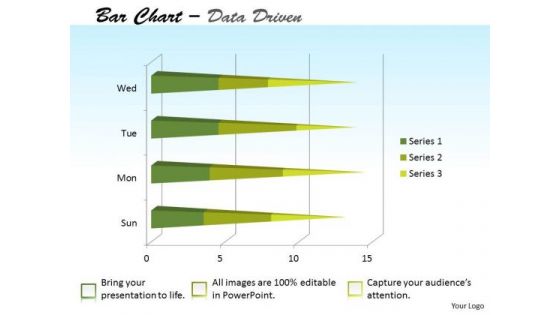
Data Analysis Template Forex Market Bar Chart PowerPoint Templates
Attract A Crowd With Our data analysis template forex market bar chart Powerpoint Templates . They Will Drop It All And Come To Hear You.
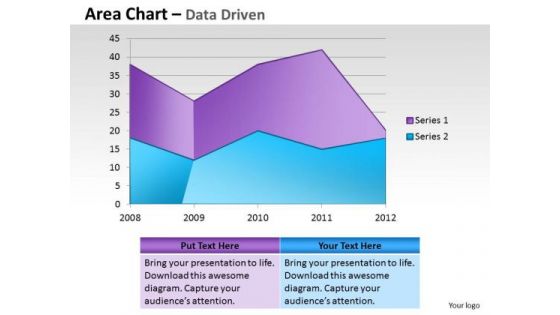
Financial Data Analysis Area Chart For Showing Trends PowerPoint Templates
Document Your Views On Our financial data analysis area chart for showing trends Powerpoint Templates . They Will Create A Strong Impression.
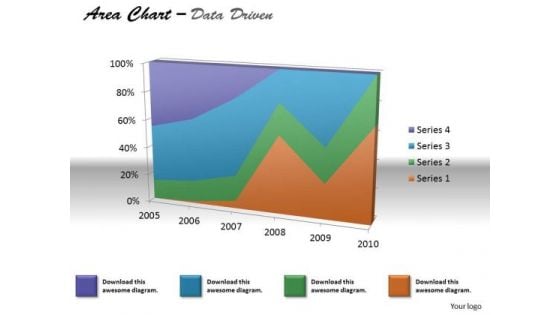
Financial Data Analysis Area Chart For Various Values PowerPoint Templates
Document The Process On Our financial data analysis area chart for various values Powerpoint Templates . Make A Record Of Every Detail.
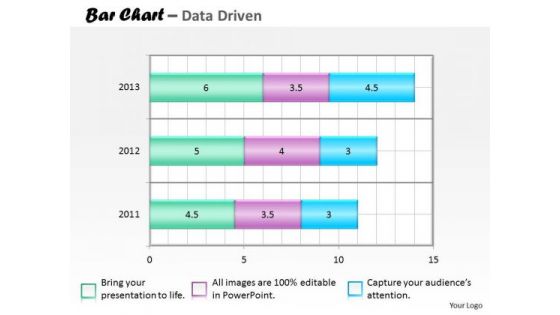
Financial Data Analysis Bar Chart For Collection Of PowerPoint Templates
Our financial data analysis bar chart for collection of Powerpoint Templates Team Are A Dogged Lot. They Keep At It Till They Get It Right.
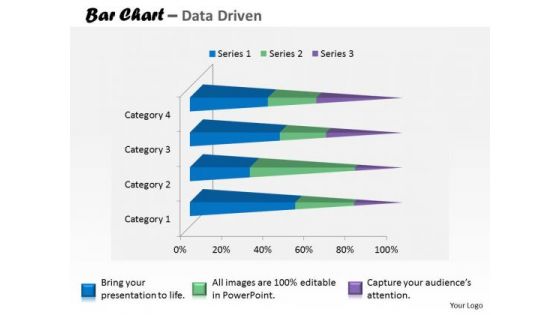
Financial Data Analysis Currency Trading Bar Chart PowerPoint Templates
Put In A Dollop Of Our financial data analysis currency trading bar chart Powerpoint Templates . Give Your Thoughts A Distinctive Flavor.
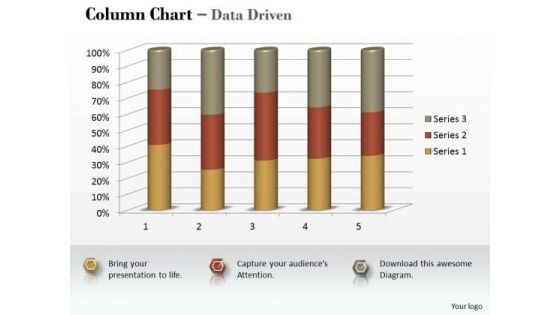
Marketing Data Analysis 3d Statistical Process Column Chart PowerPoint Templates
Be A Donor Of Great Ideas. Display Your Charity On Our marketing data analysis 3d statistical process column chart Powerpoint Templates .

Microsoft Excel Data Analysis Bar Chart To Handle PowerPoint Templates
Our microsoft excel data analysis bar chart to handle Powerpoint Templates And Your Ideas Make A Great Doubles Pair. Play The Net With Assured Hands.
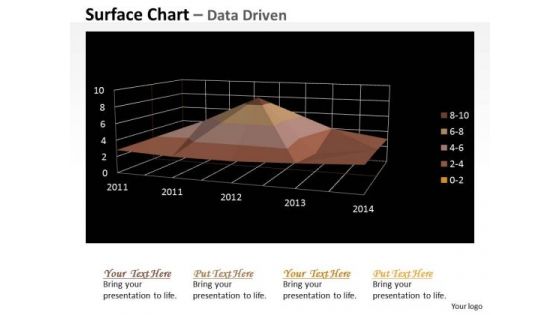
Multivariate Data Analysis Numeric Values Surface Chart PowerPoint Templates
Your Grasp Of Economics Is Well Known. Help Your Audience Comprehend Issues With Our multivariate data analysis numeric values surface chart Powerpoint Templates .
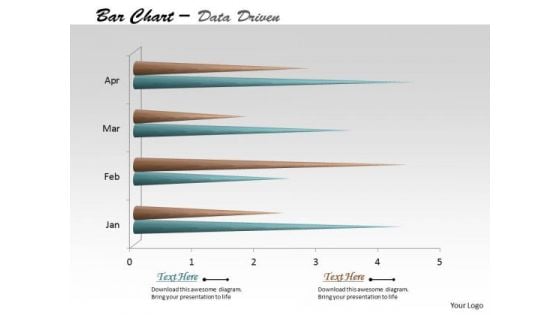
Multivariate Data Analysis Time Based Bar Chart PowerPoint Templates
Edit Your Work With Our multivariate data analysis time based bar chart Powerpoint Templates . They Will Help You Give The Final Form.
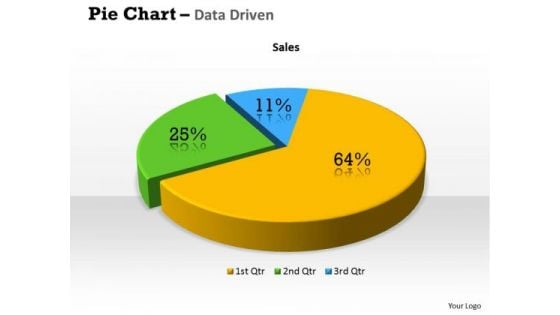
Quantitative Data Analysis 3d Percentage Ratio Pie Chart PowerPoint Templates
Plan Your Storyboard With Our quantitative data analysis 3d percentage ratio pie chart Powerpoint Templates . Give An Outline To The Solutions You Have.
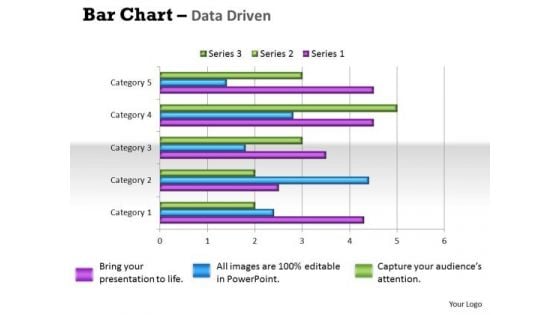
Quantitative Data Analysis Bar Chart For Different Categories PowerPoint Templates
Make Some Dough With Our quantitative data analysis bar chart for different categories Powerpoint Templates . Your Assets Will Rise Significantly.
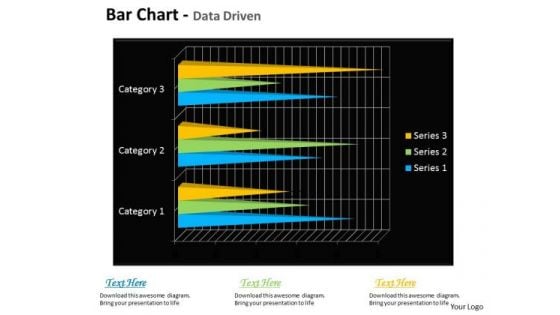
Quantitative Data Analysis Bar Chart For Financial Markets PowerPoint Templates
Draft It Out On Our quantitative data analysis bar chart for financial markets Powerpoint Templates . Give The Final Touches With Your Ideas.
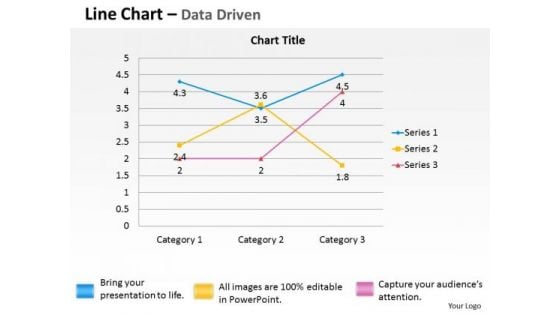
Quantitative Data Analysis Driven Economic Line Chart PowerPoint Slides Templates
Break The Deadlock With Our quantitative data analysis driven economic line chart powerpoint slides Templates . Let The Words Start To Flow.
Tracking Goals Dashboard With Progress Report Rules PDF
This slide showcases the progress report which helps to determine gaps in the objective achievement process and take corrective actions. It also includes objective details such as contributor, due date, and progress percentage. Showcasing this set of slides titled Tracking Goals Dashboard With Progress Report Rules PDF. The topics addressed in these templates are Immediate Action Required, Progress Update Required, Concise Goal Outcome Required. All the content presented in this PPT design is completely editable. Download it and make adjustments in color, background, font etc. as per your unique business setting.
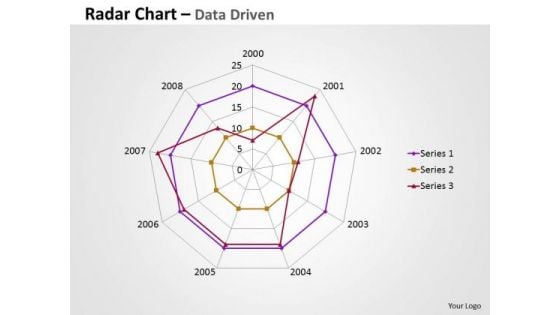
Business Data Analysis Chart Comparing Multiple Entities PowerPoint Templates
Analyze Ailments On Our business data analysis chart comparing multiple entities Powerpoint Templates. Bring Out The Thinking Doctor In You. Dock Your Thoughts With Our Financial Analysis . They Will Launch Them Into Orbit.
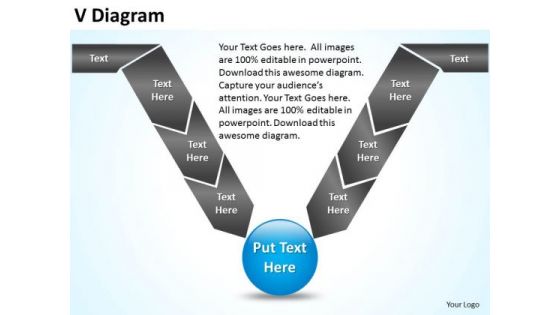
PowerPoint Design Slides Editable V Diagram Ppt Presentation
PowerPoint Design Slides Editable V Diagram PPT Presentation--Acceptance, Architecture,Chart,Cycle,Deployment, Design, Detail, Detailed, Development, Diagram, Engineering, Function, functional, Implement, Implementation, Management, model, Process, Project,Quality, Requirements, Software, Specification, steps, System, Test, Extend an invitation with our PowerPoint Design Slides Editable V Diagram Ppt Presentation. Allow the audience into your thoughts.
Big Data Management In Automobile Industry Ppt Icon Example PDF
This slide explains the big data use cases in the automobile industry and how it would help automobile firms in supply chain management, connected cars, automobile financing, predictive analysis, and design and production. This is a big data management in automobile industry ppt icon example pdf template with various stages. Focus and dispense information on five stages using this creative set, that comes with editable features. It contains large content boxes to add your information on topics like supply chain management, automobile financing, predictive analysis, design, production. You can also showcase facts, figures, and other relevant content using this PPT layout. Grab it now.
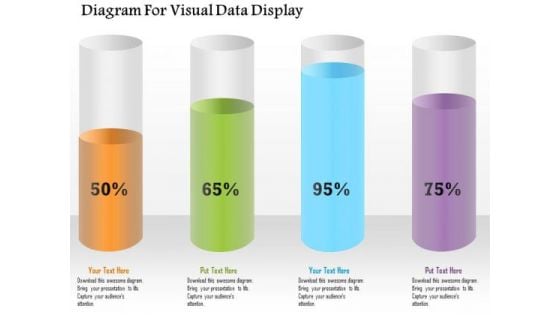
Business Diagram Diagram For Visual Data Display Presentation Template
Four colored cylindrical bars with percentage values are used to design this power point template. This diagram slide helps to display financial data analysis. Use this diagram for your business and finance related presentations.
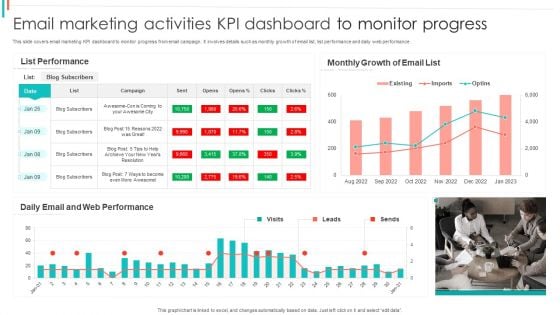
Email Marketing Activities KPI Dashboard To Monitor Progress Pictures PDF
This slide covers email marketing KPI dashboard to monitor progress from email campaign. It involves details such as monthly growth of email list, list performance and daily web performance.Showcasing this set of slides titled Email Marketing Activities KPI Dashboard To Monitor Progress Pictures PDF. The topics addressed in these templates are List Performance, Monthly Growth, Web Performance. All the content presented in this PPT design is completely editable. Download it and make adjustments in color, background, font etc. as per your unique business setting.
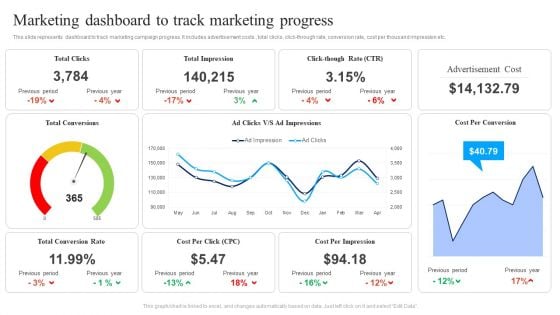
Marketing Dashboard To Track Marketing Progress Ppt Tips PDF
This slide represents dashboard to track marketing campaign progress. It includes advertisement costs , total clicks, click-through rate, conversion rate, cost per thousand impression etc. Pitch your topic with ease and precision using this Marketing Dashboard To Track Marketing Progress Ppt Tips PDF. This layout presents information on Total Clicks, Total Impression, Total Conversion Rate, Cost Per Click. It is also available for immediate download and adjustment. So, changes can be made in the color, design, graphics or any other component to create a unique layout.
Icons Slide For Using Data Mining Tools To Optimize Processes AI SS V
Download our innovative and attention grabbing Icons Slide For Using Data Mining Tools To Optimize Processes AI SS V template. The set of slides exhibit completely customizable icons. These icons can be incorporated into any business presentation. So download it immediately to clearly communicate with your clientele. Our Icons Slide For Using Data Mining Tools To Optimize Processes AI SS V are topically designed to provide an attractive backdrop to any subject. Use them to look like a presentation pro.
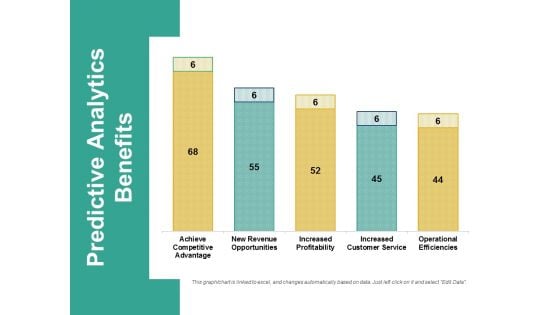
Predictive Analytics Benefits Ppt PowerPoint Presentation Professional Samples
This is a predictive analytics benefits ppt powerpoint presentation professional samples. This is a five stage process. The stages in this process are business, finance, marketing, strategy, analysis.
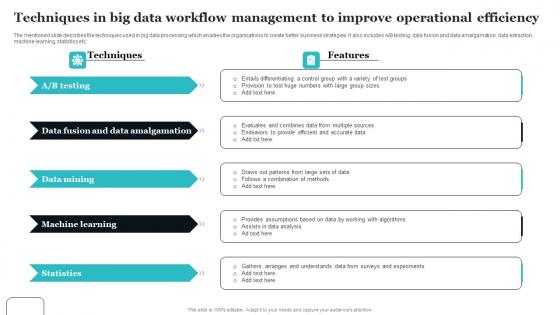
Techniques In Big Data Workflow Management To Improve Operational Efficiency Diagrams Pdf
The mentioned slide describes the techniques used in big data processing which enables the organizations to create better business strategies. It also includes A or B testing, data fusion and data amalgamation, data extraction, machine learning, statistics etc. Pitch your topic with ease and precision using this Techniques In Big Data Workflow Management To Improve Operational Efficiency Diagrams Pdf This layout presents information on Data Fusion, Data Amalgamation, Machine Learning It is also available for immediate download and adjustment. So, changes can be made in the color, design, graphics or any other component to create a unique layout. The mentioned slide describes the techniques used in big data processing which enables the organizations to create better business strategies. It also includes A or B testing, data fusion and data amalgamation, data extraction, machine learning, statistics etc.
30 60 90 Days Sales And Promotion Planning Valuation Icon Summary PDF
The given below slide showcases the required actions to improve companys sales and achieve the set targets. It also includes KPIs such as product, projection, and quality standards etc. Showcasing this set of slides titled 30 60 90 Days Sales And Promotion Planning Valuation Icon Summary PDF. The topics addressed in these templates are Quality Standards, Products, Projection. All the content presented in this PPT design is completely editable. Download it and make adjustments in color, background, font etc. as per your unique business setting.

Gears Process Industrial PowerPoint Templates And PowerPoint Themes 0512
Microsoft Powerpoint Templates and Background with colorful gears-These templates can be used for presentations relating to-Colorful gears, gear wheels, business, design, success, marketing-Gears Process Industrial PowerPoint Templates And PowerPoint Themes 0512 Illustrate the essential elements of the project. Delve into the basic nature with our Gears Process Industrial PowerPoint Templates And PowerPoint Themes 0512.
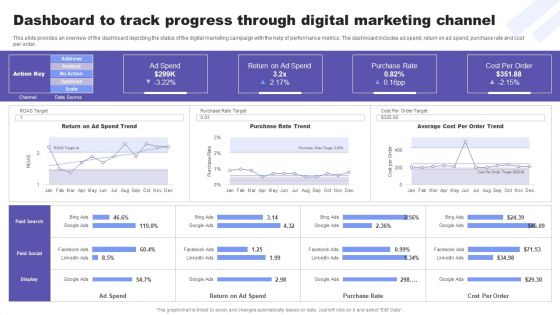
Direct Response Marketing Guide Ultimate Success Dashboard To Track Progress Diagrams PDF
This slide provides an overview of the dashboard depicting the status of the digital marketing campaign with the help of performance metrics. The dashboard includes ad spend, return on ad spend, purchase rate and cost per order. Are you in need of a template that can accommodate all of your creative concepts This one is crafted professionally and can be altered to fit any style. Use it with Google Slides or PowerPoint. Include striking photographs, symbols, depictions, and other visuals. Fill, move around, or remove text boxes as desired. Test out color palettes and font mixtures. Edit and save your work, or work with colleagues. Download Direct Response Marketing Guide Ultimate Success Dashboard To Track Progress Diagrams PDF and observe how to make your presentation outstanding. Give an impeccable presentation to your group and make your presentation unforgettable.
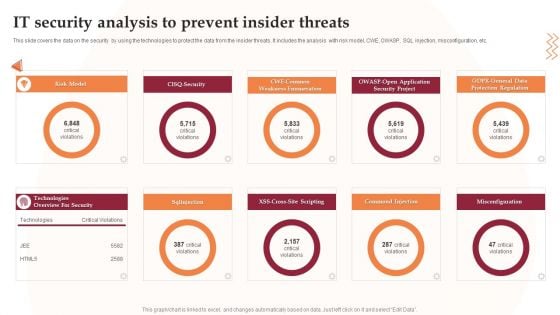
IT Security Analysis To Prevent Insider Threats Infographics PDF
This slide covers the data on the security by using the technologies to protect the data from the insider threats. It includes the analysis with risk model, CWE, OWASP, SQL injection, misconfiguration, etc. Presenting IT Security Analysis To Prevent Insider Threats Infographics PDF to dispense important information. This template comprises nine stages. It also presents valuable insights into the topics including Security Project, Application, Risk Model. This is a completely customizable PowerPoint theme that can be put to use immediately. So, download it and address the topic impactfully.
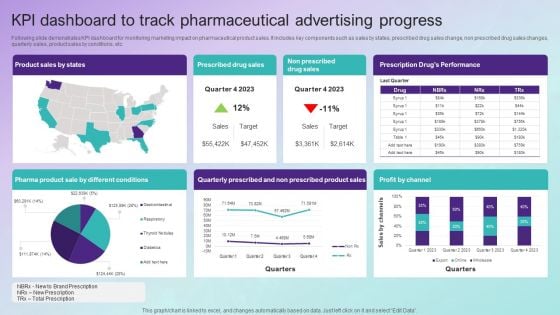
KPI Dashboard To Track Pharmaceutical Advertising Progress Topics PDF
Following slide demonstrates KPI dashboard for monitoring marketing impact on pharmaceutical product sales. It includes key components such as sales by states, prescribed drug sales change, non prescribed drug sales changes, quarterly sales, product sales by conditions, etc. Showcasing this set of slides titled KPI Dashboard To Track Pharmaceutical Advertising Progress Topics PDF. The topics addressed in these templates are Product Sales By States, Prescribed Drug Sales, Non Prescribed Drug Sales, Profit By Channel. All the content presented in this PPT design is completely editable. Download it and make adjustments in color, background, font etc. as per your unique business setting.
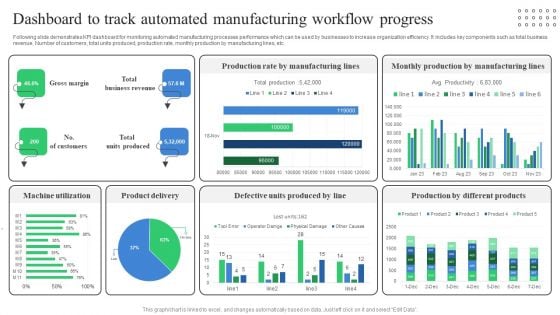
Dashboard To Track Automated Manufacturing Workflow Progress Professional PDF
Following slide demonstrates KPI dashboard for monitoring automated manufacturing processes performance which can be used by businesses to increase organization efficiency. It includes key components such as total business revenue, Number of customers, total units produced, production rate, monthly production by manufacturing lines, etc. Showcasing this set of slides titled Dashboard To Track Automated Manufacturing Workflow Progress Professional PDF. The topics addressed in these templates are Machine Utilization, Product Delivery, Defective Units Produced. All the content presented in this PPT design is completely editable. Download it and make adjustments in color, background, font etc. as per your unique business setting.
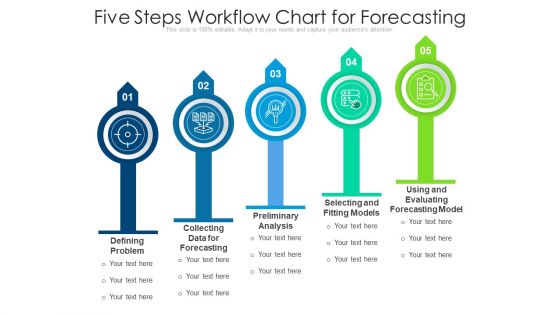
Five Steps Workflow Chart For Forecasting Ppt PowerPoint Presentation Outline Designs Download PDF
Presenting five steps workflow chart for forecasting ppt powerpoint presentation outline designs download pdf to dispense important information. This template comprises five stages. It also presents valuable insights into the topics including collecting data for forecasting, preliminary analysis, selecting and fitting models. This is a completely customizable PowerPoint theme that can be put to use immediately. So, download it and address the topic impactfully.
Various Crowdsourcing Data Applications For Various Industries Icons Pdf
The following slide depicts industry specific crowdsourcing applications. It includes various components of various sectors such as ecommerce, advertising, technology and financial services. Pitch your topic with ease and precision using this Various Crowdsourcing Data Applications For Various Industries Icons Pdf This layout presents information on Ecommerce, Advertising, Technology, Financial Services It is also available for immediate download and adjustment. So, changes can be made in the color, design, graphics or any other component to create a unique layout. The following slide depicts industry specific crowdsourcing applications. It includes various components of various sectors such as ecommerce, advertising, technology and financial services.
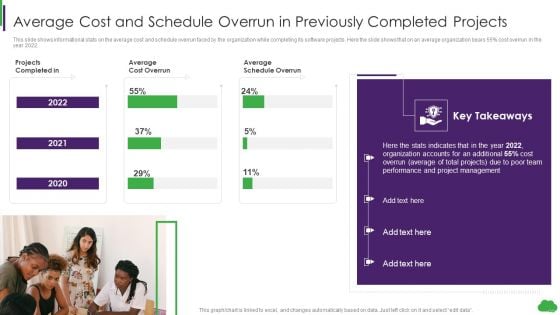
Using Ml And Devops In Product Development Process Average Cost And Schedule Overrun Mockup PDF
This slide shows informational stats on the average cost and schedule overrun faced by the organization while completing its software projects. Here the slide shows that on an average organization bears 55 percent cost overrun in the year 2022. Deliver an awe inspiring pitch with this creative Using Ml And Devops In Product Development Process Average Cost And Schedule Overrun Mockup PDF bundle. Topics like Average Cost, Previously Completed Projects, Schedule Overrun can be discussed with this completely editable template. It is available for immediate download depending on the needs and requirements of the user.
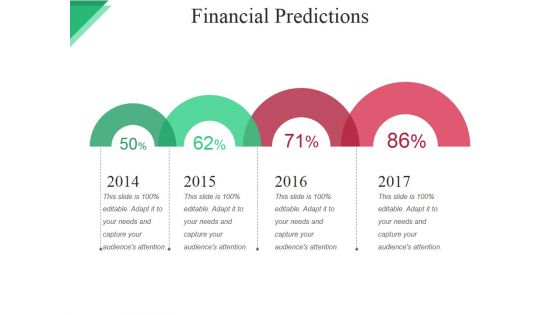
Financial Predictions Ppt PowerPoint Presentation File Clipart Images
This is a financial predictions ppt powerpoint presentation file clipart images. This is a three stage process. The stages in this process are revenue, expense, aggregate net income, monthly breakeven, aggregate breakeven.
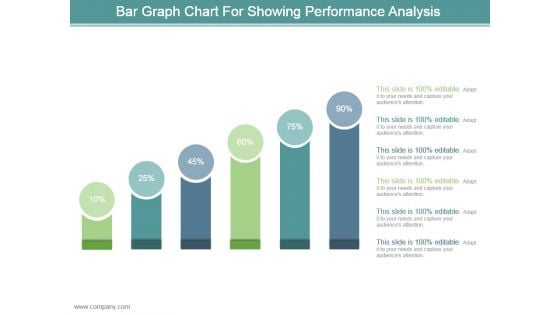
Bar Graph Chart For Showing Performance Analysis Ppt Design
This is a bar graph chart for showing performance analysis ppt design. This is a six stage process. The stages in this process are business, marketing, process, success, presentation.
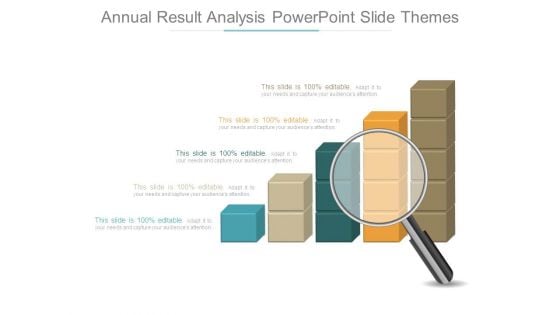
Annual Result Analysis Powerpoint Slide Themes
This is a annual result analysis powerpoint slide themes. This is a five stage process. The stages in this process are business, process, presentation, strategy, analysis.
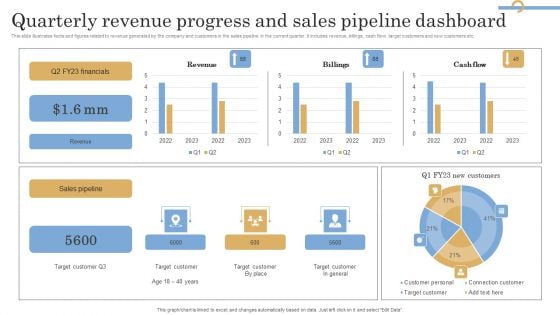
Quarterly Revenue Progress And Sales Pipeline Dashboard Information PDF
This slide illustrates facts and figures related to revenue generated by the company and customers in the sales pipeline in the current quarter. It includes revenue, billings, cash flow, target customers and new customers etc. Showcasing this set of slides titled Quarterly Revenue Progress And Sales Pipeline Dashboard Information PDF. The topics addressed in these templates are Financials, Revenue, Sales Pipeline. All the content presented in this PPT design is completely editable. Download it and make adjustments in color, background, font etc. as per your unique business setting.
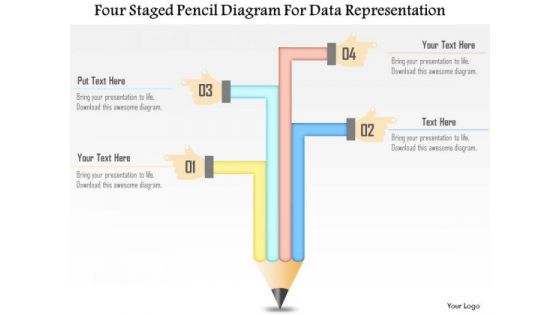
Business Diagram Four Staged Pencil Diagram For Data Representation Presentation Template
This business diagram has been designed with four staged pencil chart. This slide suitable for data representation. You can also use this slide to present four steps of any business process. Use this diagram to present your views in a wonderful manner.

Business Diagram 3d Pie Chart With Arrows For Data Representation PowerPoint Slide
This business slide displays pie chart with timeline graphics. This diagram has been designed with graphic of with four arrows representing yearly data. Use this diagram, in your presentations to display process steps, stages, for business management.
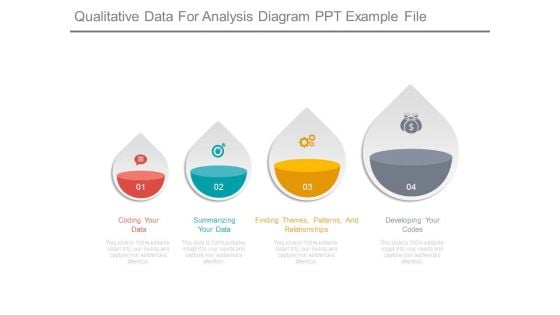
Qualitative Data For Analysis Diagram Ppt Example File
This is a qualitative data for analysis diagram ppt example file. This is a four stage process. The stages in this process are coding your data, summarizing your data, finding themes, patterns, and relationships, developing your codes.
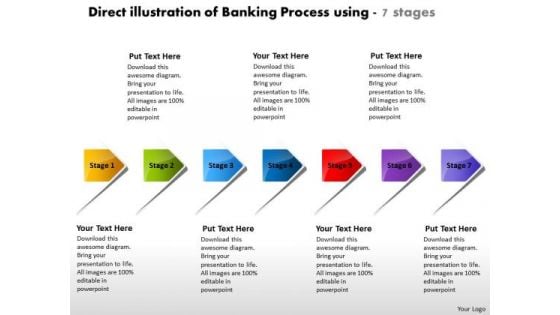
Direct Illustration Of Banking Process Using 7 Stages Electrical Design PowerPoint Slides
We present our direct illustration of banking process using 7 stages electrical design PowerPoint Slides.Use our Business PowerPoint Templates because,The fruits of your labour are beginning to show.Enlighten them on the great plans you have for their enjoyment Use our Shapes PowerPoint Templates because, You have a great plan to put the pieces together, getting all the various contributors to gel for a successful completion. Use our Signs PowerPoint Templates because,our creative template will lay down your views. Use our Arrows PowerPoint Templates because,You can Trigger audience minds with your interesting ideas. Use our Process and Flows PowerPoint Templates because,This diagram helps to reaffirm to your team your faith in maintaining the highest ethical standards.Use these PowerPoint slides for presentations relating to account, arrow, arrows, away, box, business, chart, choice, concept, concepts, consultation, corporate, design, diagram, direction, elements, flow, follow, follows, future, group, grow, increase, lines, many, month, move, past, period, phase, project, report, rise, row, step, success, text, time, timeline, work, year. The prominent colors used in the PowerPoint template are Yellow, Green, Blue. People tell us our direct illustration of banking process using 7 stages electrical design PowerPoint Slides will generate and maintain the level of interest you desire. They will create the impression you want to imprint on your audience. The feedback we get is that our away PowerPoint templates and PPT Slides are Perfect. People tell us our direct illustration of banking process using 7 stages electrical design PowerPoint Slides are Multicolored. Presenters tell us our concept PowerPoint templates and PPT Slides are effectively colour coded to prioritise your plans They automatically highlight the sequence of events you desire. The feedback we get is that our direct illustration of banking process using 7 stages electrical design PowerPoint Slides are Vintage. Professionals tell us our away PowerPoint templates and PPT Slides will make the presenter look like a pro even if they are not computer savvy. If you have doubts about the effort required? Be assured our Direct Illustration Of Banking Process Using 7 Stages Electrical Design PowerPoint Slides will make it fairly easy.
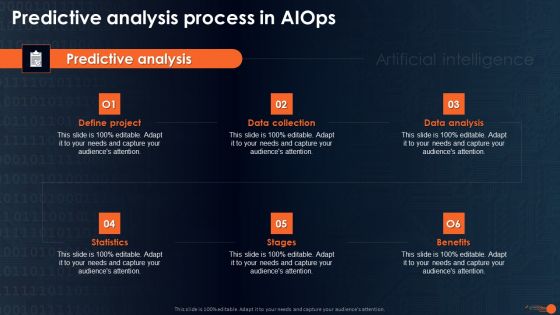
Integrating Aiops To Enhance Process Effectiveness Predictive Analysis Process In Aiops Diagrams PDF
Explore a selection of the finest Integrating Aiops To Enhance Process Effectiveness Predictive Analysis Process In Aiops Diagrams PDF here. With a plethora of professionally designed and pre-made slide templates, you can quickly and easily find the right one for your upcoming presentation. You can use our Integrating Aiops To Enhance Process Effectiveness Predictive Analysis Process In Aiops Diagrams PDF to effectively convey your message to a wider audience. Slidegeeks has done a lot of research before preparing these presentation templates. The content can be personalized and the slides are highly editable. Grab templates today from Slidegeeks.
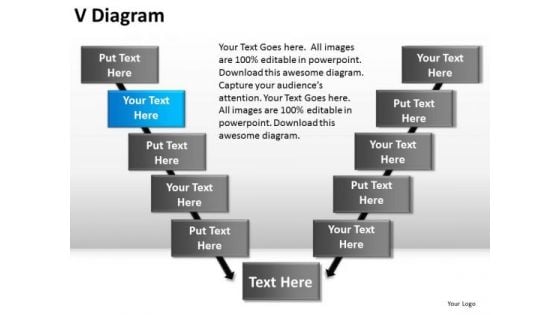
PowerPoint Backgrounds Company V Diagram
PowerPoint Backgrounds Company V Diagram--Acceptance, Architecture,Chart,Cycle,Deployment, Design, Detail, Detailed, Development, Diagram, Engineering, Function, functional, Implement, Implementation, Management, model, Process, Project,Quality, Requirements, Software, Specification, steps, System, Test, Bonds created with our PowerPoint Backgrounds Company V Diagram will never break. They ensure alliances endure.


 Continue with Email

 Home
Home


