It Project Discovery Phase
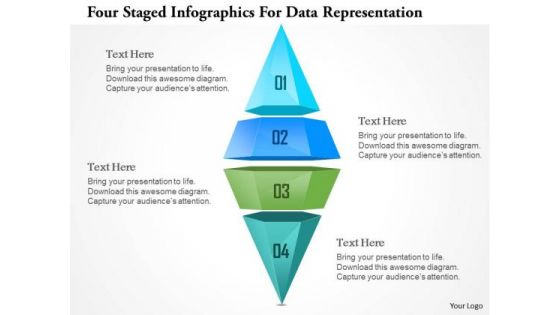
Busines Diagram Four Staged Ingographics For Data Representation Ppt Template
This business diagram has been designed with graphic of four staged info graphics. This info graphic can be used for data representation. Deliver amazing presentations to mesmerize your audience.
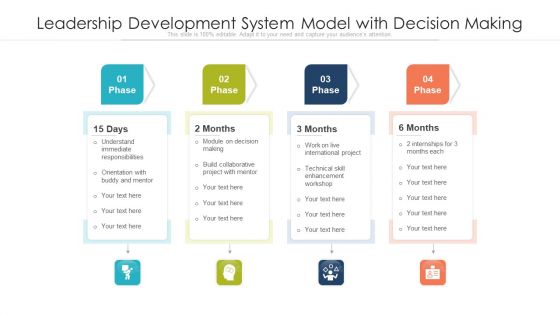
Leadership Development System Model With Decision Making Ppt PowerPoint Presentation File Background PDF
Presenting leadership development system model with decision making ppt powerpoint presentation file background pdf to dispense important information. This template comprises four stages. It also presents valuable insights into the topics including technical skill, international project. This is a completely customizable PowerPoint theme that can be put to use immediately. So, download it and address the topic impactfully.
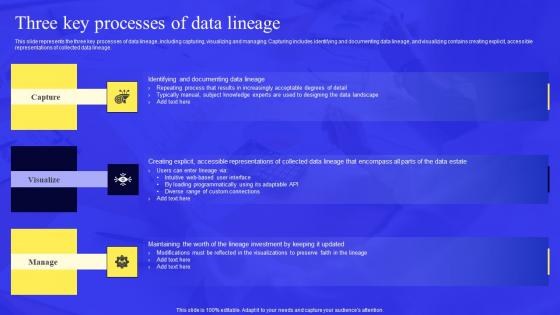
Business Process Data Lineage Three Key Processes Of Data Lineage Pictures Pdf
This slide represents the three key processes of data lineage, including capturing, visualizing and managing. Capturing includes identifying and documenting data lineage, and visualizing contains creating explicit, accessible representations of collected data lineage. If you are looking for a format to display your unique thoughts, then the professionally designed Business Process Data Lineage Three Key Processes Of Data Lineage Pictures Pdf is the one for you. You can use it as a Google Slides template or a PowerPoint template. Incorporate impressive visuals, symbols, images, and other charts. Modify or reorganize the text boxes as you desire. Experiment with shade schemes and font pairings. Alter, share or cooperate with other people on your work. Download Business Process Data Lineage Three Key Processes Of Data Lineage Pictures Pdf and find out how to give a successful presentation. Present a perfect display to your team and make your presentation unforgettable. This slide represents the three key processes of data lineage, including capturing, visualizing and managing. Capturing includes identifying and documenting data lineage, and visualizing contains creating explicit, accessible representations of collected data lineage.
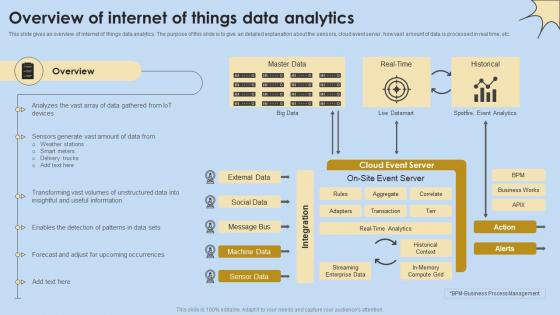
Overview Of Internet Of Things Data Analytics Internet Of Things Analysis Clipart Pdf
This slide gives an overview of internet of things data analytics. The purpose of this slide is to give an detailed explanation about the sensors, cloud event server, how vast amount of data is processed in real time, etc. Retrieve professionally designed Overview Of Internet Of Things Data Analytics Internet Of Things Analysis Clipart Pdf to effectively convey your message and captivate your listeners. Save time by selecting pre-made slideshows that are appropriate for various topics, from business to educational purposes. These themes come in many different styles, from creative to corporate, and all of them are easily adjustable and can be edited quickly. Access them as PowerPoint templates or as Google Slides themes. You do not have to go on a hunt for the perfect presentation because Slidegeeks got you covered from everywhere. This slide gives an overview of internet of things data analytics. The purpose of this slide is to give an detailed explanation about the sensors, cloud event server, how vast amount of data is processed in real time, etc.
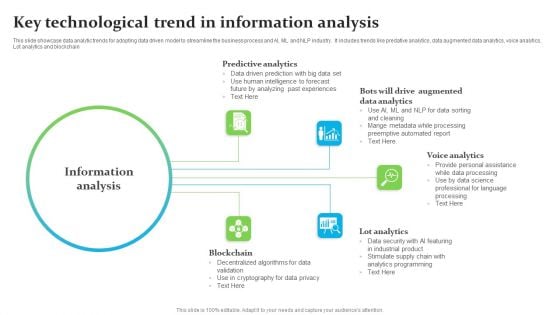
Key Technological Trend In Information Analysis Ppt Ideas Layout PDF
This slide showcase data analytic trends for adopting data driven model to streamline the business process and AI, ML and NLP industry. It includes trends like predative analytics, data augmented data analytics, voice analytics, Lot analytics and blockchain. Presenting Key Technological Trend In Information Analysis Ppt Ideas Layout PDF to dispense important information. This template comprises five stages. It also presents valuable insights into the topics including Predictive Analytics, Voice Analytics, Lot Analytics, Blockchain. This is a completely customizable PowerPoint theme that can be put to use immediately. So, download it and address the topic impactfully.
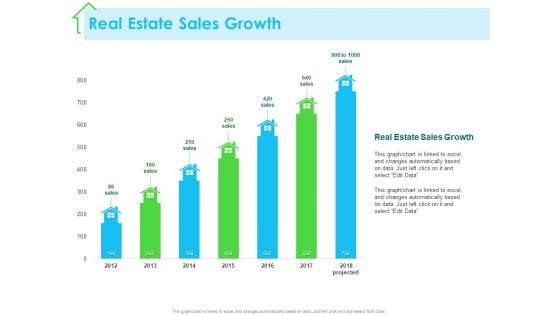
Real Estate Development Real Estate Sales Growth Ppt PowerPoint Presentation Gallery Outline PDF
Presenting this set of slides with name real estate development real estate sales growth ppt powerpoint presentation gallery outline pdf. The topics discussed in these slides are real estate, sales growth, 2012 to 2018, projected. This is a completely editable PowerPoint presentation and is available for immediate download. Download now and impress your audience.
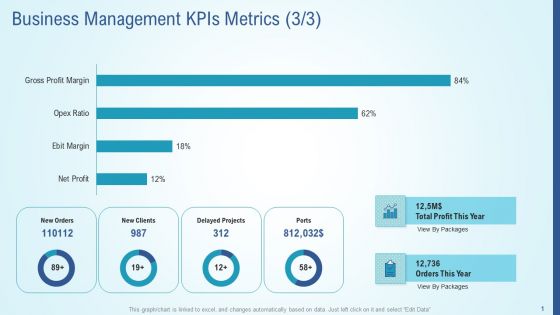
Business Strategy Development Process Business Management Kpis Metrics Clients Introduction PDF
Deliver an awe inspiring pitch with this creative business strategy development process business management kpis metrics clients introduction pdf bundle. Topics like delayed projects, ports, new clients, new orders can be discussed with this completely editable template. It is available for immediate download depending on the needs and requirements of the user.
Partner Engagement Planning Procedure Bifurcation In Internal External Stakeholders Icons PDF
This slide covers the bifurcation of internal and external stakeholders after identification of the potential stakeholders such as social organizations, or anyone interested to have stake in the project. This is a partner engagement planning procedure bifurcation in internal external stakeholders icons pdf template with various stages. Focus and dispense information on three stages using this creative set, that comes with editable features. It contains large content boxes to add your information on topics like external stakeholders, internal shareholders, project. You can also showcase facts, figures, and other relevant content using this PPT layout. Grab it now.
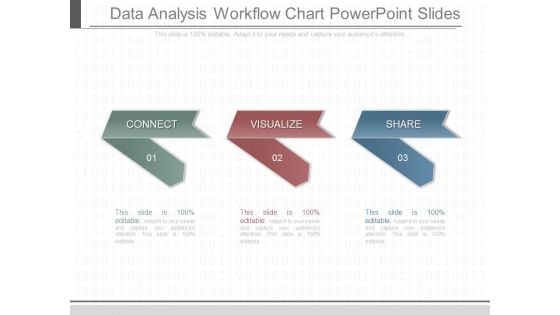
Data Analysis Workflow Chart Powerpoint Slides
This is a data analysis workflow chart powerpoint slides. This is a three stage process. The stages in this process are connect, visualize, share.
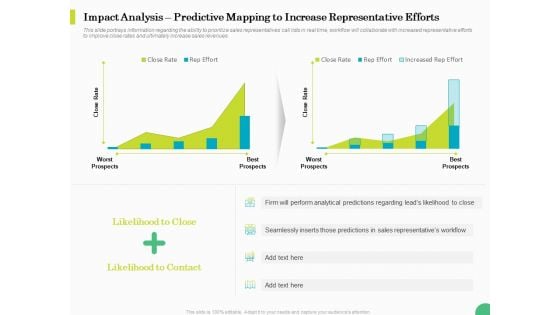
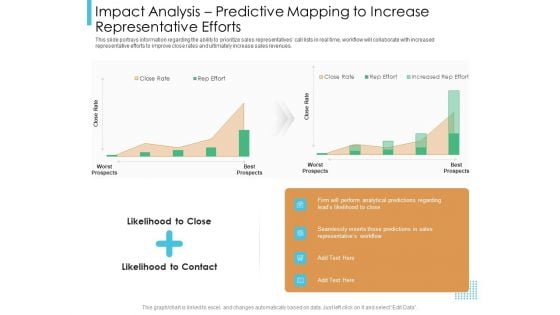
Evaluating Rank Prospects Impact Analysis Predictive Mapping To Increase Representative Efforts Ppt Summary Clipart PDF
This slide portrays information regarding the ability to prioritize sales representatives call lists in real time, workflow will collaborate with increased representative efforts to improve close rates and ultimately increase sales revenues. Deliver and pitch your topic in the best possible manner with this evaluating rank prospects impact analysis predictive mapping to increase representative efforts ppt summary clipart pdf. Use them to share invaluable insights on worst prospects, likelihood to close, likelihood to contact, best prospects and impress your audience. This template can be altered and modified as per your expectations. So, grab it now.
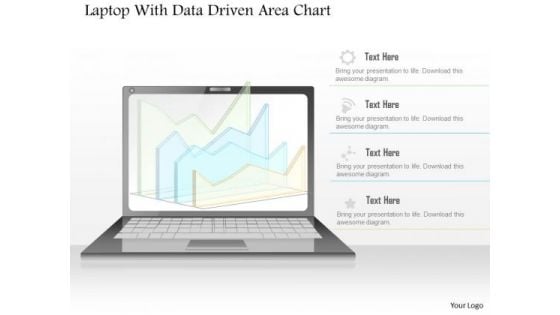
Business Diagram Laptop With Data Driven Area Chart PowerPoint Slide
This diagram has been designed with laptop and data driven area chart. Download this diagram to give your presentations more effective look. It helps in clearly conveying your message to clients and audience.
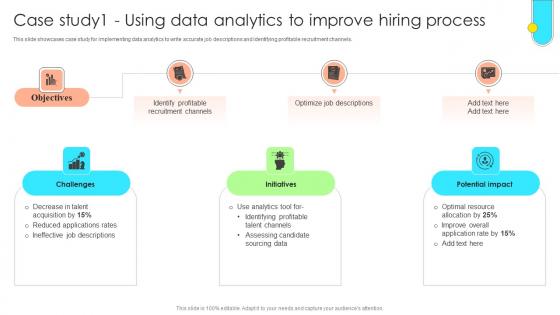
Data Driven Approach To Optimise Case Study1 Using Data Analytics To Improve CRP SS V
This slide showcases case study for implementing data analytics to write accurate job descriptions and identifying profitable recruitment channels. Whether you have daily or monthly meetings, a brilliant presentation is necessary. Data Driven Approach To Optimise Case Study1 Using Data Analytics To Improve CRP SS V can be your best option for delivering a presentation. Represent everything in detail using Data Driven Approach To Optimise Case Study1 Using Data Analytics To Improve CRP SS V and make yourself stand out in meetings. The template is versatile and follows a structure that will cater to your requirements. All the templates prepared by Slidegeeks are easy to download and edit. Our research experts have taken care of the corporate themes as well. So, give it a try and see the results. This slide showcases case study for implementing data analytics to write accurate job descriptions and identifying profitable recruitment channels.
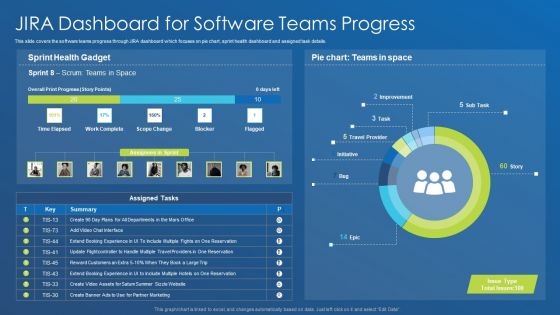
Application Development Best Practice Tools And Templates Jira Dashboard For Software Teams Progress Microsoft PDF
This slide covers the software teams progress through JIRA dashboard which focuses on pie chart, sprint health dashboard and assigned task details. Deliver and pitch your topic in the best possible manner with this application development best practice tools and templates jira dashboard for software teams progress microsoft pdf. Use them to share invaluable insights on improvement, travel provider, initiative, task and impress your audience. This template can be altered and modified as per your expectations. So, grab it now.
Three Months Data Analysis Procedure Roadmap Icons
We present our three months data analysis procedure roadmap icons. This PowerPoint layout is easy to edit so you can change the font size, font type, color, and shape conveniently. In addition to this, the PowerPoint layout is Google Slides compatible, so you can share it with your audience and give them access to edit it. Therefore, download and save this well researched three months data analysis procedure roadmap icons in different formats like PDF, PNG, and JPG to smoothly execute your business plan.
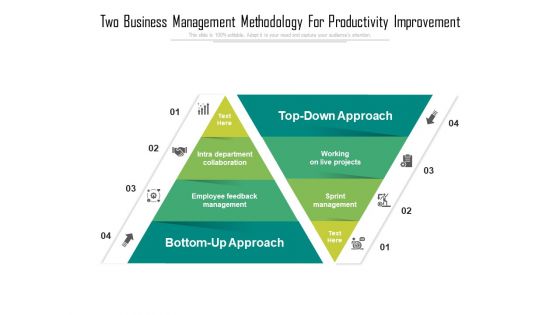
Two Business Management Methodology For Productivity Improvement Ppt PowerPoint Presentation Infographics Graphics Download PDF
Persuade your audience using this two business management methodology for productivity improvement ppt powerpoint presentation infographics graphics download pdf. This PPT design covers four stages, thus making it a great tool to use. It also caters to a variety of topics including top down approach, working on live projects, sprint management, bottom up approach, employee feedback management, intra department collaboration. Download this PPT design now to present a convincing pitch that not only emphasizes the topic but also showcases your presentation skills.
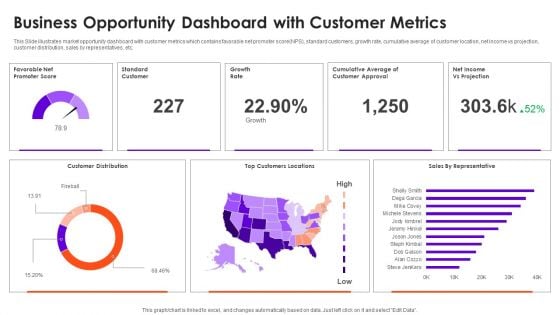
Business Opportunity Dashboard With Customer Metrics Information PDF
This Slide illustrates market opportunity dashboard with customer metrics which contains favorable net promoter score NPS, standard customers, growth rate, cumulative average of customer location, net income vs projection, customer distribution, sales by representatives, etc. Pitch your topic with ease and precision using this Business Opportunity Dashboard With Customer Metrics Information PDF. This layout presents information on Customer Distribution, Growth Rate, Top Customers Locations. It is also available for immediate download and adjustment. So, changes can be made in the color, design, graphics or any other component to create a unique layout.

Digital Marketing Campaign Performance Monitoring Dashboard Pictures PDF
This slide represents the dashboard for measuring and monitoring the performance of digital marketing campaign. It includes information related to the advertisement cost, cost per conversion, no. of clicks, conversion rate, impressions, cost per click, click through rate and cost per thousand impressions of the project.Pitch your topic with ease and precision using this Digital Marketing Campaign Performance Monitoring Dashboard Pictures PDF. This layout presents information on Conversion Rate, Per Conversion, Cost Per Thousand. It is also available for immediate download and adjustment. So, changes can be made in the color, design, graphics or any other component to create a unique layout.
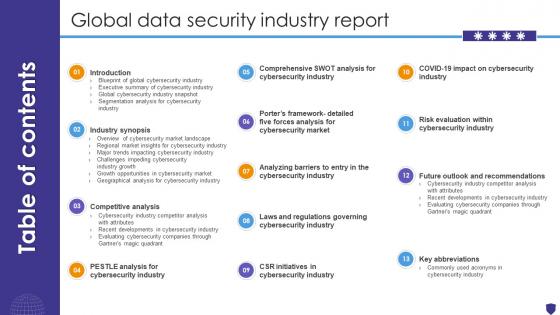
Table Of Contents For Global Data Security Industry Report IR SS V
Retrieve professionally designed Table Of Contents For Global Data Security Industry Report IR SS V to effectively convey your message and captivate your listeners. Save time by selecting pre-made slideshows that are appropriate for various topics, from business to educational purposes. These themes come in many different styles, from creative to corporate, and all of them are easily adjustable and can be edited quickly. Access them as PowerPoint templates or as Google Slides themes. You do not have to go on a hunt for the perfect presentation because Slidegeeks got you covered from everywhere. Our Table Of Contents For Global Data Security Industry Report IR SS V are topically designed to provide an attractive backdrop to any subject. Use them to look like a presentation pro.
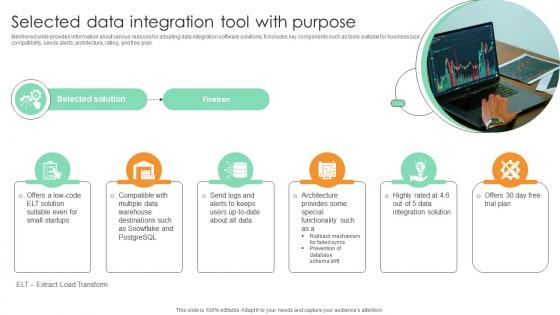
Selected Data Integration Tool With Purpose Comprehensive Guide For Marketing Technology
Mentioned slide provides information about various reasons for adopting data integration software solutions. It includes key components such as tools suitable for business size, compatibility, sends alerts, architecture, rating, and free plan. Are you searching for a Selected Data Integration Tool With Purpose Comprehensive Guide For Marketing Technology that is uncluttered, straightforward, and original Its easy to edit, and you can change the colors to suit your personal or business branding. For a presentation that expresses how much effort you have put in, this template is ideal With all of its features, including tables, diagrams, statistics, and lists, its perfect for a business plan presentation. Make your ideas more appealing with these professional slides. Download Selected Data Integration Tool With Purpose Comprehensive Guide For Marketing Technology from Slidegeeks today. Mentioned slide provides information about various reasons for adopting data integration software solutions. It includes key components such as tools suitable for business size, compatibility, sends alerts, architecture, rating, and free plan.
Data Analytics Vector Icon Ppt PowerPoint Presentation Professional
Presenting this set of slides with name data analytics vector icon ppt powerpoint presentation professional. This is a four stage process. The stages in this process are data visualization icon, research analysis, business focus. This is a completely editable PowerPoint presentation and is available for immediate download. Download now and impress your audience.

Statistical Data Analysis Chart Of Collected Data Formats PDF
Presenting statistical data analysis chart of collected data formats pdf to dispense important information. This template comprises four stages. It also presents valuable insights into the topics including statistical data analysis chart of collected data. This is a completely customizable PowerPoint theme that can be put to use immediately. So, download it and address the topic impactfully.
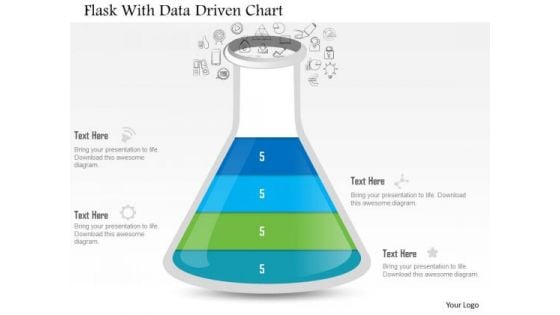
Business Diagram Flask With Data Driven Chart PowerPoint Slide
This data driven diagram has been designed with flask graphics. Download this diagram to give your presentations more effective look. It helps in clearly conveying your message to clients and audience.
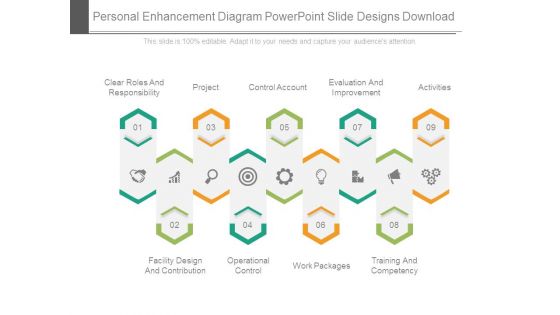
Personal Enhancement Diagram Powerpoint Slide Designs Download
This is a personal enhancement diagram powerpoint slide designs download. This is a nine stage process. The stages in this process are clear roles and responsibility, project, control account, evaluation and improvement, activities, facility design and contribution, operational control, work packages, training and competency.
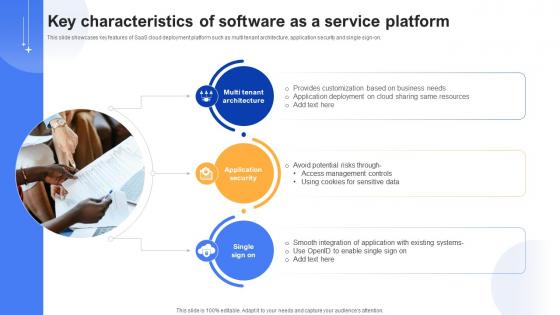
Effective Data Migration Key Characteristics Of Software As A Service Platform
This slide showcases key features of SaaS cloud deployment platform such as multi tenant architecture, application security and single sign-on. Are you searching for a Effective Data Migration Key Characteristics Of Software As A Service Platform that is uncluttered, straightforward, and original Its easy to edit, and you can change the colors to suit your personal or business branding. For a presentation that expresses how much effort you have put in, this template is ideal With all of its features, including tables, diagrams, statistics, and lists, its perfect for a business plan presentation. Make your ideas more appealing with these professional slides. Download Effective Data Migration Key Characteristics Of Software As A Service Platform from Slidegeeks today. This slide showcases key features of SaaS cloud deployment platform such as multi tenant architecture, application security and single sign-on.
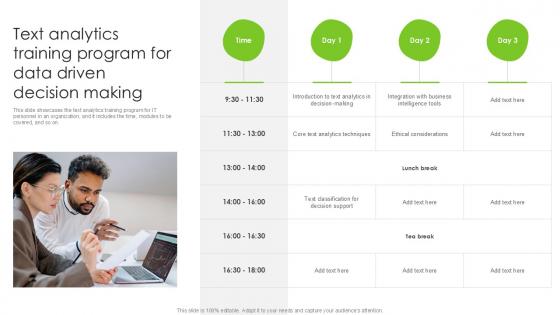
Text Analytics Training Program For Data Driven Decision Making PPT Template SS
This slide showcases the text analytics training program for IT personnel in an organization, and it includes the time, modules to be covered, and so on. Are you searching for a Text Analytics Training Program For Data Driven Decision Making PPT Template SS that is uncluttered, straightforward, and original Its easy to edit, and you can change the colors to suit your personal or business branding. For a presentation that expresses how much effort you have put in, this template is ideal With all of its features, including tables, diagrams, statistics, and lists, its perfect for a business plan presentation. Make your ideas more appealing with these professional slides. Download Text Analytics Training Program For Data Driven Decision Making PPT Template SS from Slidegeeks today. This slide showcases the text analytics training program for IT personnel in an organization, and it includes the time, modules to be covered, and so on.
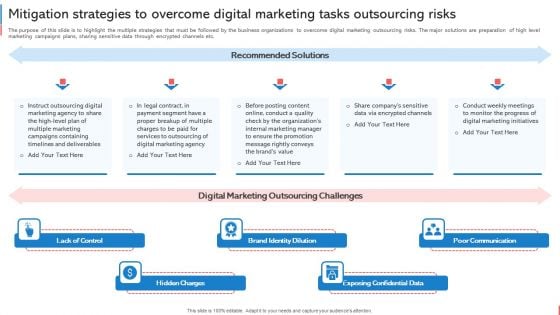
Company Budget Analysis Mitigation Strategies To Overcome Digital Marketing Tasks Microsoft PDF
The purpose of this slide is to highlight the multiple strategies that must be followed by the business organizations to overcome digital marketing outsourcing risks. The major solutions are preparation of high level marketing campaigns plans, sharing sensitive data through encrypted channels etc. If you are looking for a format to display your unique thoughts, then the professionally designed Company Budget Analysis Mitigation Strategies To Overcome Digital Marketing Tasks Microsoft PDF is the one for you. You can use it as a Google Slides template or a PowerPoint template. Incorporate impressive visuals, symbols, images, and other charts. Modify or reorganize the text boxes as you desire. Experiment with shade schemes and font pairings. Alter, share or cooperate with other people on your work. Download Company Budget Analysis Mitigation Strategies To Overcome Digital Marketing Tasks Microsoft PDF and find out how to give a successful presentation. Present a perfect display to your team and make your presentation unforgettable.
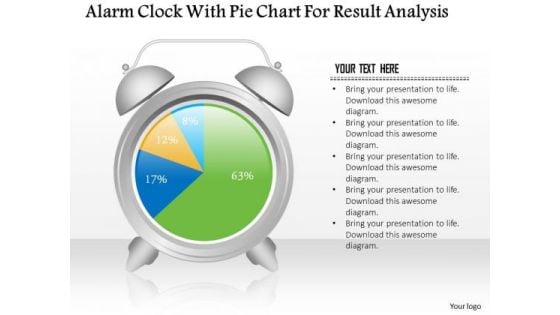
Business Diagram Alarm Clock With Pie Chart For Result Analysis PowerPoint Slide
This business slide displays alarm clock with pie chart. This diagram is a data visualization tool that gives you a simple way to present statistical information. This slide helps your audience examine and interpret the data you present.
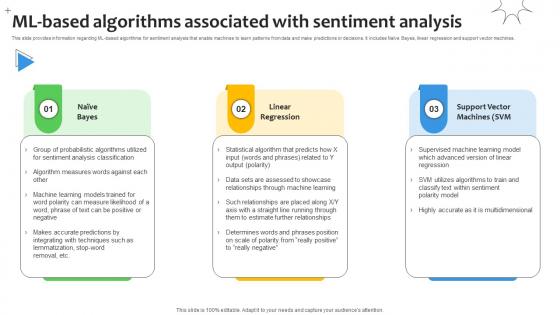
ML Based Algorithms Associated With Sentiment Analysis Demystified Understanding AI SS V
This slide provides information regarding ML-based algorithms for sentiment analysis that enable machines to learn patterns from data and make predictions or decisions. It includes Naive Bayes, linear regression and support vector machines. Do you know about Slidesgeeks ML Based Algorithms Associated With Sentiment Analysis Demystified Understanding AI SS V These are perfect for delivering any kind od presentation. Using it, create PowerPoint presentations that communicate your ideas and engage audiences. Save time and effort by using our pre-designed presentation templates that are perfect for a wide range of topic. Our vast selection of designs covers a range of styles, from creative to business, and are all highly customizable and easy to edit. Download as a PowerPoint template or use them as Google Slides themes. This slide provides information regarding ML-based algorithms for sentiment analysis that enable machines to learn patterns from data and make predictions or decisions. It includes Naive Bayes, linear regression and support vector machines.
Solution Development Process When To Use Vmodel Icons PDF
This slide represents the conditions when we can implement V-model, including consistent product definition, clear and precise prerequisites, and small projects.Deliver and pitch your topic in the best possible manner with this Solution Development Process When To Use Vmodel Icons PDF. Use them to share invaluable insights on Sprint Increment, Verification, Increment Planning and impress your audience. This template can be altered and modified as per your expectations. So, grab it now.
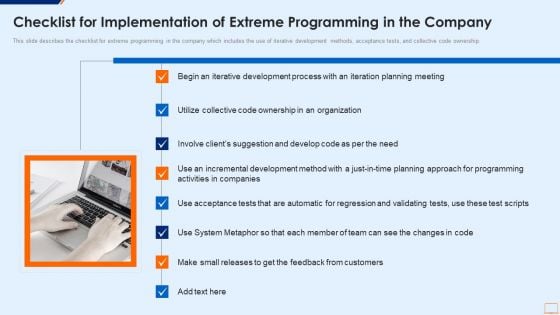
Extreme Programming Methodology IT Checklist For Implementation Of Extreme Diagrams PDF
This slide describes the checklist for extreme programming in the company which includes the use of iterative development methods, acceptance tests, and collective code ownership.This is a extreme programming methodology it checklist for implementation of extreme diagrams pdf template with various stages. Focus and dispense information on one stage using this creative set, that comes with editable features. It contains large content boxes to add your information on topics like requirements of the project, discussing the project, iterations are decided You can also showcase facts, figures, and other relevant content using this PPT layout. Grab it now.
Data And Analytics Ppt PowerPoint Presentation Icon Layouts Cpb
This is a data and analytics ppt powerpoint presentation icon layouts cpb. This is a five stage process. The stages in this process are data and analytics.
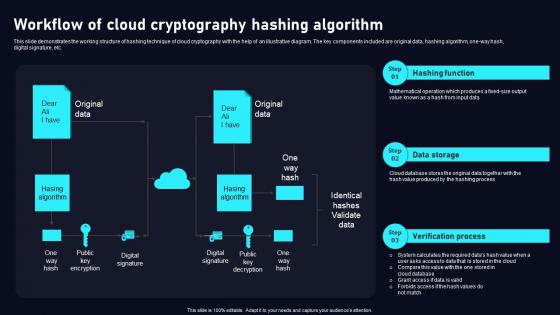
Workflow Of Cloud Cryptography Cloud Data Security Using Cryptography Clipart Pdf
This slide demonstrates the working structure of hashing technique of cloud cryptography with the help of an illustrative diagram. The key components included are original data, hashing algorithm, one way hash, digital signature, etc. Find a pre designed and impeccableWorkflow Of Cloud Cryptography Cloud Data Security Using Cryptography Clipart Pdf. The templates can ace your presentation without additional effort. You can download these easy to edit presentation templates to make your presentation stand out from others. So, what are you waiting for Download the template from Slidegeeks today and give a unique touch to your presentation. This slide demonstrates the working structure of hashing technique of cloud cryptography with the help of an illustrative diagram. The key components included are original data, hashing algorithm, one way hash, digital signature, etc.
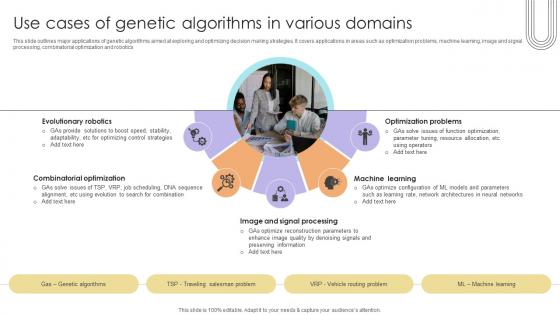
Use Cases Of Genetic Algorithms In Various Domains Data Analytics SS V
This slide outlines major applications of genetic algorithms aimed at exploring and optimizing decision making strategies. It covers applications in areas such as optimization problems, machine learning, image and signal processing, combinatorial optimization and robotics.Are you searching for a Use Cases Of Genetic Algorithms In Various Domains Data Analytics SS V that is uncluttered, straightforward, and original Its easy to edit, and you can change the colors to suit your personal or business branding. For a presentation that expresses how much effort you have put in, this template is ideal With all of its features, including tables, diagrams, statistics, and lists, its perfect for a business plan presentation. Make your ideas more appealing with these professional slides. Download Use Cases Of Genetic Algorithms In Various Domains Data Analytics SS V from Slidegeeks today. This slide outlines major applications of genetic algorithms aimed at exploring and optimizing decision making strategies. It covers applications in areas such as optimization problems, machine learning, image and signal processing, combinatorial optimization and robotics.
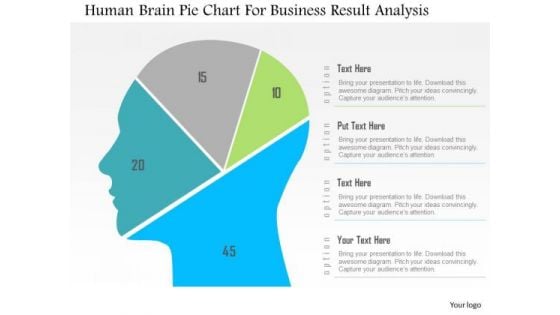
Business Diagram Human Brain Pie Chart For Business Result Analysis PowerPoint Slide
This diagram displays human face graphic divided into sections. This section can be used for data display. Use this diagram to build professional presentations for your viewers.
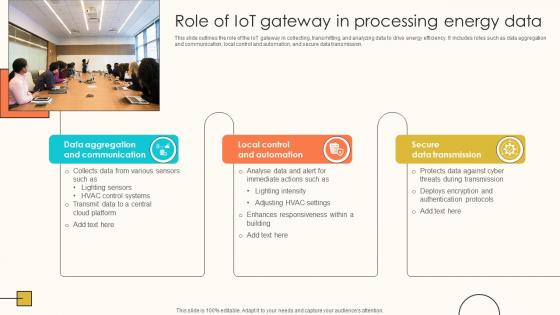
Role Of IoT Gateway In Processing Energy Data Internet Of Things Solutions To Enhance Energy IoT SS V
This slide outlines the role of the IoT gateway in collecting, transmitting, and analyzing data to drive energy efficiency. It includes roles such as data aggregation and communication, local control and automation, and secure data transmission. Do you know about Slidesgeeks Role Of IoT Gateway In Processing Energy Data Internet Of Things Solutions To Enhance Energy IoT SS V These are perfect for delivering any kind od presentation. Using it, create PowerPoint presentations that communicate your ideas and engage audiences. Save time and effort by using our pre-designed presentation templates that are perfect for a wide range of topic. Our vast selection of designs covers a range of styles, from creative to business, and are all highly customizable and easy to edit. Download as a PowerPoint template or use them as Google Slides themes. This slide outlines the role of the IoT gateway in collecting, transmitting, and analyzing data to drive energy efficiency. It includes roles such as data aggregation and communication, local control and automation, and secure data transmission.
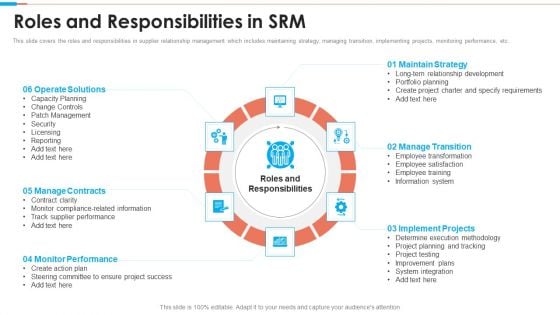
Tactical Approach To Vendor Relationship Roles And Responsibilities In Srm Topics PDF
This slide covers the roles and responsibilities in supplier relationship management which includes maintaining strategy, managing transition, implementing projects, monitoring performance, etc.Presenting Tactical Approach To Vendor Relationship Roles And Responsibilities In Srm Topics PDF to provide visual cues and insights. Share and navigate important information on six stages that need your due attention. This template can be used to pitch topics like Manage Transition, Implement Projects, Maintain Strategy In addtion, this PPT design contains high resolution images, graphics, etc, that are easily editable and available for immediate download.
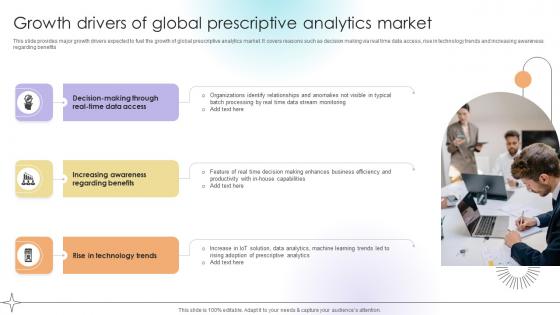
Growth Drivers Of Global Prescriptive Analytics Market Data Analytics SS V
This slide provides major growth drivers expected to fuel the growth of global prescriptive analytics market. It covers reasons such as decision making via real time data access, rise in technology trends and increasing awareness regarding benefits.Do you know about Slidesgeeks Growth Drivers Of Global Prescriptive Analytics Market Data Analytics SS V These are perfect for delivering any kind od presentation. Using it, create PowerPoint presentations that communicate your ideas and engage audiences. Save time and effort by using our pre-designed presentation templates that are perfect for a wide range of topic. Our vast selection of designs covers a range of styles, from creative to business, and are all highly customizable and easy to edit. Download as a PowerPoint template or use them as Google Slides themes. This slide provides major growth drivers expected to fuel the growth of global prescriptive analytics market. It covers reasons such as decision making via real time data access, rise in technology trends and increasing awareness regarding benefits.
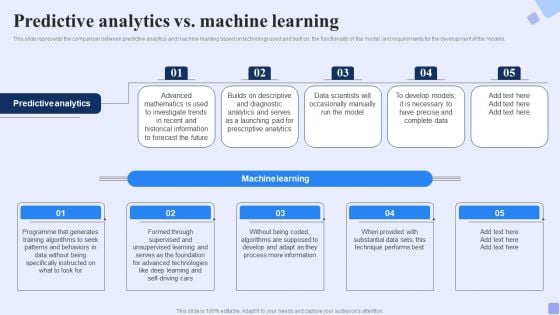
Predictive Analytics Vs Machine Learning Forward Looking Analysis IT Rules PDF
This slide represents the comparison between predictive analytics and machine learning based on technology used and built on, the functionality of the model, and requirements for the development of the models.Retrieve professionally designed Predictive Analytics Vs Machine Learning Forward Looking Analysis IT Rules PDF to effectively convey your message and captivate your listeners. Save time by selecting pre-made slideshows that are appropriate for various topics, from business to educational purposes. These themes come in many different styles, from creative to corporate, and all of them are easily adjustable and can be edited quickly. Access them as PowerPoint templates or as Google Slides themes. You do not have to go on a hunt for the perfect presentation because Slidegeeks got you covered from everywhere.
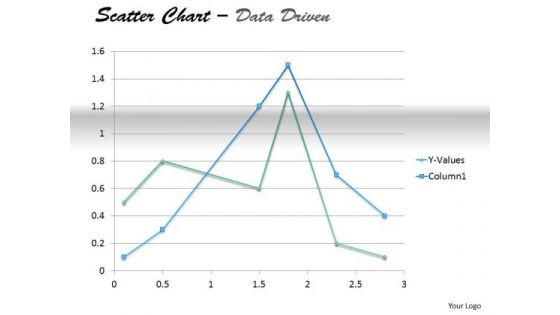
Examples Of Data Analysis Market Driven Present In Scatter Chart PowerPoint Slides Templates
Your Thoughts Will Take To Our examples of data analysis market driven present in scatter chart powerpoint slides Templates Like A Duck To Water. They Develop A Binding Affinity.
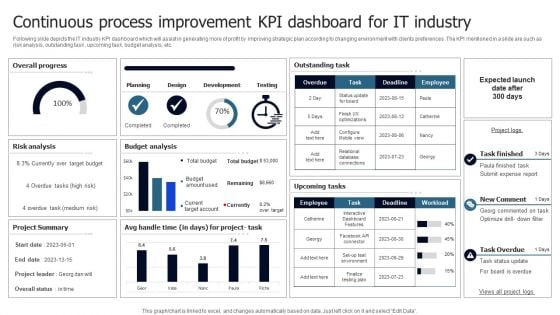
Continuous Process Improvement KPI Dashboard For IT Industry Clipart PDF
Following slide depicts the IT industry KPI dashboard which will assist in generating more of profit by improving strategic plan according to changing environment with clients preferences .The KPI mentioned in a slide are such as risk analysis, outstanding task , upcoming task, budget analysis, etc. Pitch your topic with ease and precision using this Continuous Process Improvement KPI Dashboard For IT Industry Clipart PDF. This layout presents information on Overall Progress, Risk Analysis, Budget Analysis. It is also available for immediate download and adjustment. So, changes can be made in the color, design, graphics or any other component to create a unique layout.
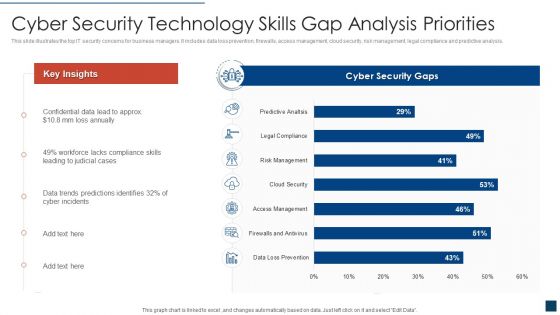
Cyber Security Technology Skills Gap Analysis Priorities Clipart PDF
This slide illustrates the top IT security concerns for business managers. It includes data loss prevention, firewalls, access management, cloud security, risk management, legal compliance and predictive analysis. Showcasing this set of slides titled cyber security technology skills gap analysis priorities clipart pdf. The topics addressed in these templates are cyber security technology skills gap analysis priorities. All the content presented in this PPT design is completely editable. Download it and make adjustments in color, background, font etc. as per your unique business setting.
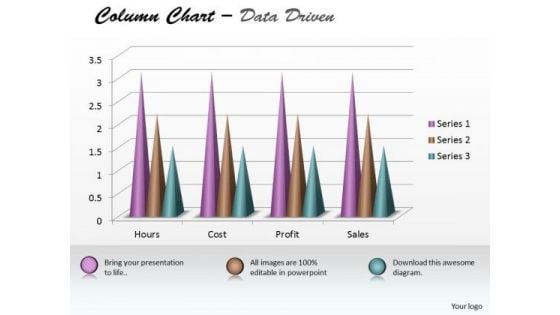
Excel Data Analysis Data Tools Data Methods Statistical Tool Survey Chart PowerPoint Templates
Analyze Ailments On Our excel data analysis data tools data methods statistical tool survey chart Powerpoint Templates . Bring Out The Thinking Doctor In You. Dock Your Thoughts With Our Excel Data Analysis . They Will Launch Them Into Orbit.
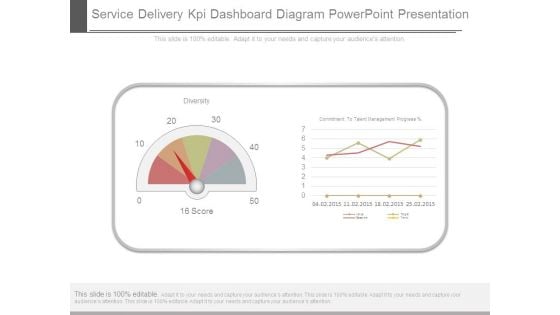
Service Delivery Kpi Dashboard Diagram Powerpoint Presentation
This is a service delivery kpi dashboard diagram powerpoint presentation. This is a two stage process. The stages in this process are diversity, commitment to talent management progress.
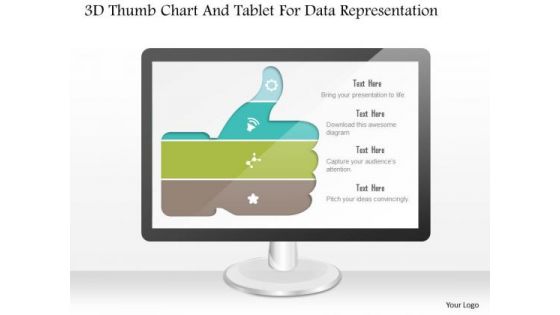
Business Diagram 3d Thumb Chart And Tablet For Data Representation PowerPoint Slide
This business diagram displays graphic of 3d thumb up chart with icons on computer screen. This business slide contains the concept of business data representation. Use this diagram to build professional presentations for your viewers.
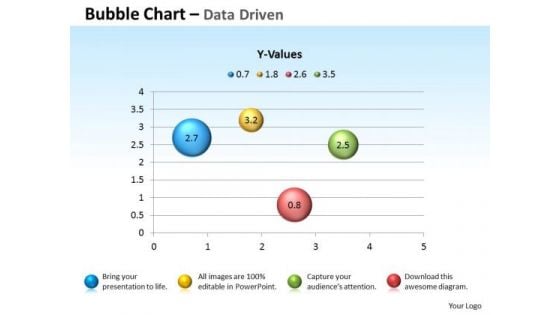
Excel Data Analysis Data Tools Data Methods Statistical Chart For Process PowerPoint Templates
Blend Your Views With Our excel data analysis data tools data methods statistical chart for process Powerpoint Templates . They Are Made For Each Other.
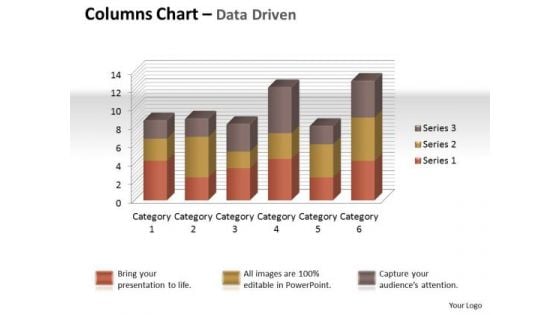
Excel Data Analysis Data Tools Data Methods Statistical Tool Chart PowerPoint Templates
Give Your Thoughts Some Durability. Coat Them With Our excel data analysis data tools data methods statistical tool chart Powerpoint Templates .
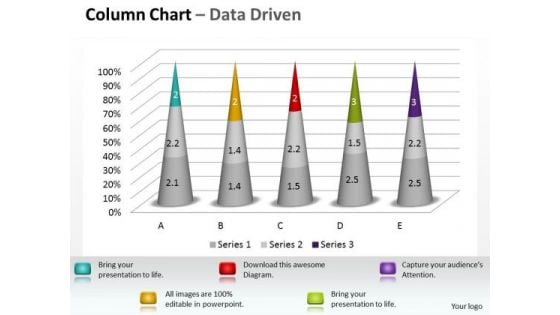
Excel Data Analysis Data Tools Data Methods Statistical Tool Survey 3d Chart PowerPoint Templates
Dumbfound Them With Our excel data analysis data tools data methods statistical tool survey 3d chart Powerpoint Templates . Your Audience Will Be Astounded With Your Ideas.
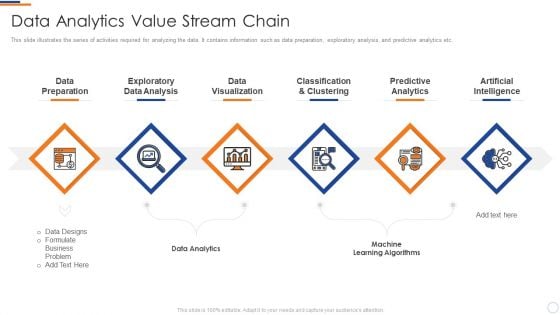
Business Intelligence And Big Transformation Toolkit Data Analytics Value Stream Chain Guidelines PDF
This slide illustrates the series of activities required for analyzing the data. It contains information such as data preparation, exploratory analysis, and predictive analytics etc. This is a business intelligence and big transformation toolkit data analytics value stream chain guidelines pdf template with various stages. Focus and dispense information on six stages using this creative set, that comes with editable features. It contains large content boxes to add your information on topics like data preparation, exploratory data analysis, data visualization, classification and clustering, predictive analytics. You can also showcase facts, figures, and other relevant content using this PPT layout. Grab it now.
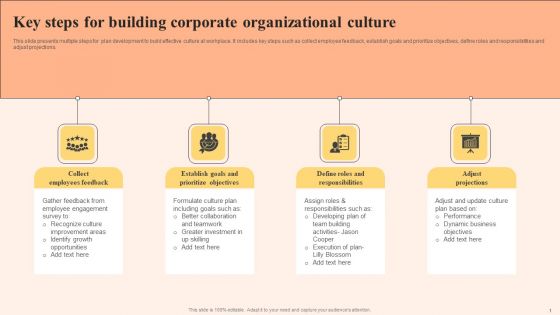
Key Steps For Building Corporate Organizational Culture Background PDF
This slide presents multiple steps for plan development to build effective culture at workplace. It includes key steps such as collect employee feedback, establish goals and prioritize objectives, define roles and responsibilities and adjust projections. Presenting Key Steps For Building Corporate Organizational Culture Background PDF to dispense important information. This template comprises four stages. It also presents valuable insights into the topics including Collect Employees Feedback, Define Roles Responsibilities, Adjust Projections. This is a completely customizable PowerPoint theme that can be put to use immediately. So, download it and address the topic impactfully.
Lead Scoring Model Impact Analysis Predictive Mapping To Increase Representative Efforts Ppt Model Display PDF
Deliver and pitch your topic in the best possible manner with this lead scoring model impact analysis predictive mapping to increase representative efforts ppt model display pdf. Use them to share invaluable insights on workflow, sales, perform, analytical and impress your audience. This template can be altered and modified as per your expectations. So, grab it now.
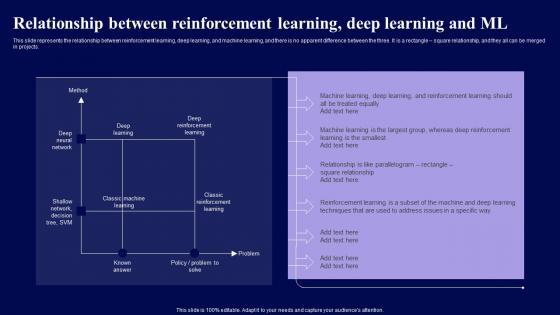
Relationship Between Reinforcement Learning Deep Learning And ML Role Of Reinforcement Themes Pdf
This slide represents the relationship between reinforcement learning, deep learning, and machine learning, and there is no apparent difference between the three. It is a rectangle square relationship, and they all can be merged in projects. Find a pre-designed and impeccable Relationship Between Reinforcement Learning Deep Learning And ML Role Of Reinforcement Themes Pdf The templates can ace your presentation without additional effort. You can download these easy-to-edit presentation templates to make your presentation stand out from others. So, what are you waiting for Download the template from Slidegeeks today and give a unique touch to your presentation. This slide represents the relationship between reinforcement learning, deep learning, and machine learning, and there is no apparent difference between the three. It is a rectangle square relationship, and they all can be merged in projects.
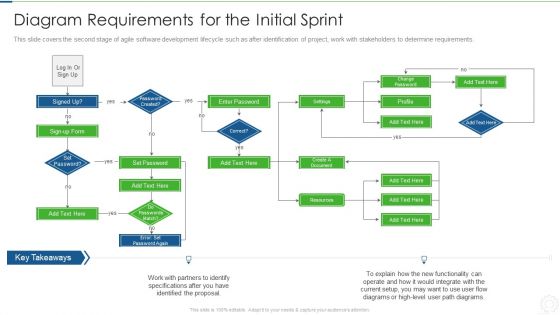
Agile Planning Development Strategies And Architecture IT Diagram Requirements For The Initial Sprint Formats PDF
This slide covers the second stage of agile software development lifecycle such as after identification of project, work with stakeholders to determine requirements. Deliver and pitch your topic in the best possible manner with this agile planning development strategies and architecture it diagram requirements for the initial sprint formats pdf. Use them to share invaluable insights on diagram requirements for the initial sprint and impress your audience. This template can be altered and modified as per your expectations. So, grab it now.
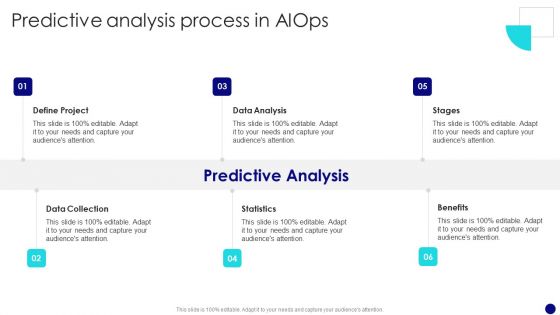
Information Technology Operations Administration With ML Predictive Analysis Process Structure PDF
Are you searching for a Information Technology Operations Administration With ML Predictive Analysis Process Structure PDF that is uncluttered, straightforward, and original Its easy to edit, and you can change the colors to suit your personal or business branding. For a presentation that expresses how much effort you have put in, this template is ideal With all of its features, including tables, diagrams, statistics, and lists, its perfect for a business plan presentation. Make your ideas more appealing with these professional slides. Download Information Technology Operations Administration With ML Predictive Analysis Process Structure PDF from Slidegeeks today.
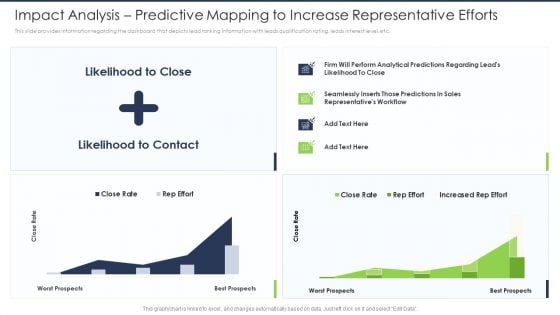
Lead Scoring AI Model Impact Analysis Predictive Mapping To Increase Representative Efforts Ppt Slides Objects PDF
This slide provides information regarding the dashboard that depicts lead ranking information with leads qualification rating, leads interest level, etc. Deliver and pitch your topic in the best possible manner with this lead scoring ai model impact analysis predictive mapping to increase representative efforts ppt slides objects pdf. Use them to share invaluable insights on workflow, sales, perform, analytical and impress your audience. This template can be altered and modified as per your expectations. So, grab it now.
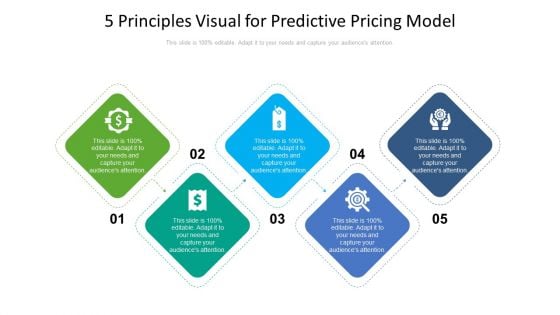
5 Principles Visual For Predictive Pricing Model Ppt PowerPoint Presentation File Gallery PDF
Presenting 5 principles visual for predictive pricing model ppt powerpoint presentation file gallery pdf to dispense important information. This template comprises five stages. It also presents valuable insights into the topics including 5 principles visual for predictive pricing model. This is a completely customizable PowerPoint theme that can be put to use immediately. So, download it and address the topic impactfully.
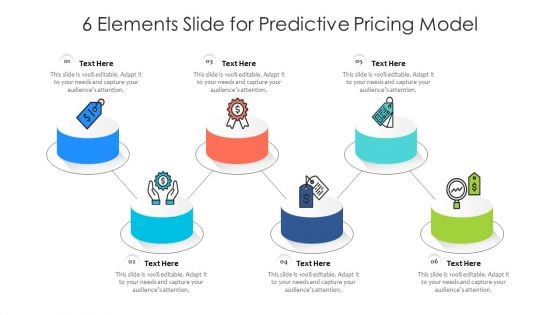
6 Elements Slide For Predictive Pricing Model Ppt PowerPoint Presentation Gallery Picture PDF
Presenting 6 elements slide for predictive pricing model ppt powerpoint presentation gallery picture pdf to dispense important information. This template comprises six stages. It also presents valuable insights into the topics including 6 elements slide for predictive pricing model. This is a completely customizable PowerPoint theme that can be put to use immediately. So, download it and address the topic impactfully.
File Transfer Data Management Vector Icon Ppt PowerPoint Presentation File Graphic Images
Presenting this set of slides with name file transfer data management vector icon ppt powerpoint presentation file graphic images. The topics discussed in these slides are data sources, database management, marketing. This is a completely editable PowerPoint presentation and is available for immediate download. Download now and impress your audience.

Data Analysis Excel Bar Graph To Compare PowerPoint Templates
Get The Domestics Right With Our data analysis excel bar graph to compare Powerpoint Templates. Create The Base For Thoughts To Grow.
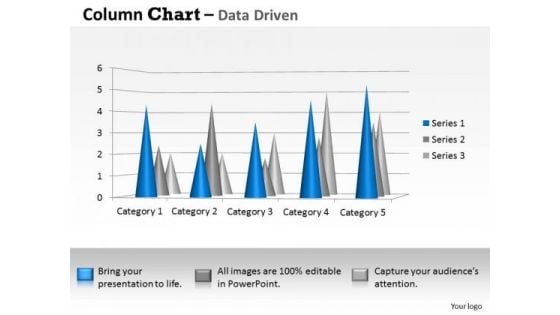
Data Analysis Techniques 3d Distribution Of In Sets PowerPoint Templates
Your Thoughts Will Be The Main Course. Provide The Dressing With Our data analysis techniques 3d distribution of in sets Powerpoint Templates .
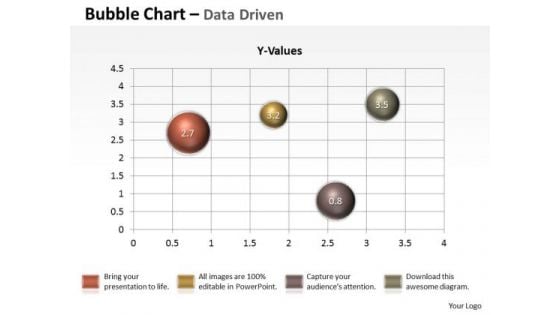
Data Analysis Techniques 3d Graphical Presentation Of PowerPoint Templates
Our data analysis techniques 3d graphical presentation of Powerpoint Templates Will Follow The Drill. They Accomplish The Task Assigned To Them.


 Continue with Email

 Home
Home


