It Project Discovery Phase
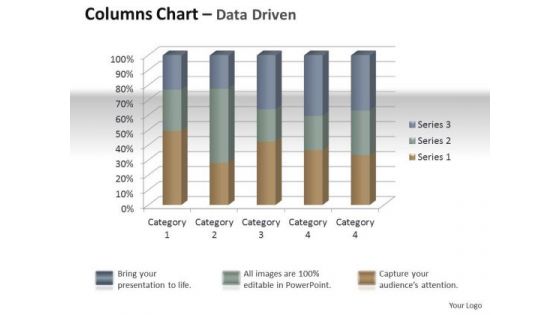
Marketing Data Analysis 3d Quality Control Of Units PowerPoint Templates
Establish Your Dominion With Our marketing data analysis 3d quality control of units Powerpoint Templates . Rule The Stage With Your Thoughts.
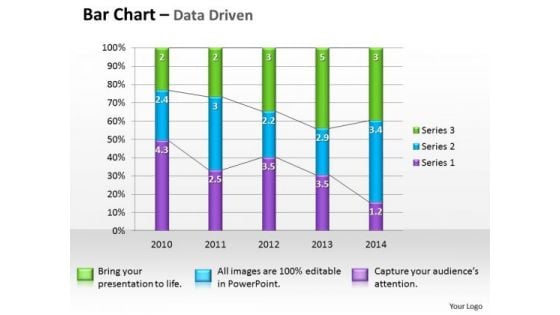
Microsoft Excel Data Analysis Bar Graph PowerPoint Templates
Double The Impact With Our microsoft excel data analysis bar graph Powerpoint Templates . Your Thoughts Will Have An Imposing Effect.
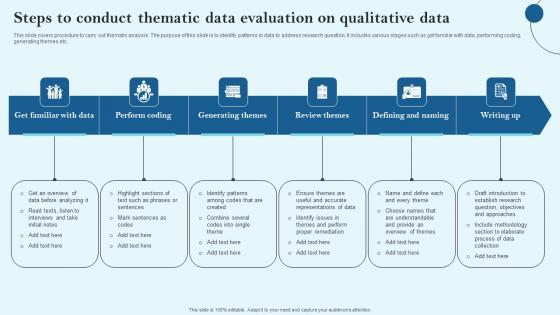
Steps To Conduct Thematic Data Evaluation On Qualitative Data Themes Pdf
This slide covers procedure to carry out thematic analysis. The purpose of this slide is to identify patterns in data to address research question. It includes various stages such as get familiar with data, performing coding, generating themes etc. Pitch your topic with ease and precision using this Steps To Conduct Thematic Data Evaluation On Qualitative Data Themes Pdf This layout presents information on Perform Coding, Generating Themes, Review Themes It is also available for immediate download and adjustment. So, changes can be made in the color, design, graphics or any other component to create a unique layout. This slide covers procedure to carry out thematic analysis. The purpose of this slide is to identify patterns in data to address research question. It includes various stages such as get familiar with data, performing coding, generating themes etc.

Continuous Improvement And Innovation Strategies For SMEs DT SS V
This slide presents a strategy for continuous improvement and innovation of digital transformation in SMEs. It includes agile mindset, investment in digital skills, lean and six sigma methodologies, cloud and SaaS adoption, rapid prototyping and MVPs, and data-driven decision making.If you are looking for a format to display your unique thoughts, then the professionally designed Continuous Improvement And Innovation Strategies For SMEs DT SS V is the one for you. You can use it as a Google Slides template or a PowerPoint template. Incorporate impressive visuals, symbols, images, and other charts. Modify or reorganize the text boxes as you desire. Experiment with shade schemes and font pairings. Alter, share or cooperate with other people on your work. Download Continuous Improvement And Innovation Strategies For SMEs DT SS V and find out how to give a successful presentation. Present a perfect display to your team and make your presentation unforgettable. This slide presents a strategy for continuous improvement and innovation of digital transformation in SMEs. It includes agile mindset, investment in digital skills, lean and six sigma methodologies, cloud and SaaS adoption, rapid prototyping and MVPs, and data-driven decision making.
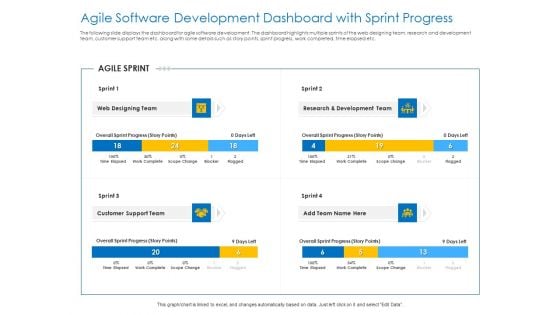
Agile Best Practices For Effective Team Agile Software Development Dashboard With Sprint Progress Themes PDF
Deliver and pitch your topic in the best possible manner with this agile best practices for effective team agile software development dashboard with sprint progress themes pdf. Use them to share invaluable insights on web designing team, research and development team, customer support team and impress your audience. This template can be altered and modified as per your expectations. So, grab it now.
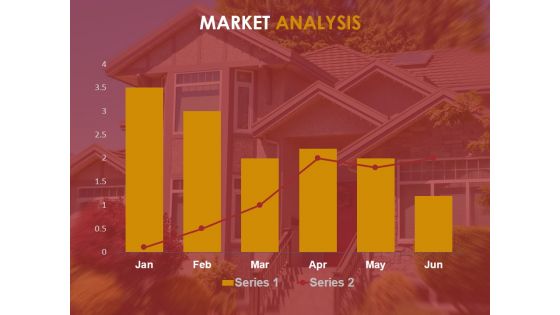
Market Analysis Ppt PowerPoint Presentation Introduction
This is a market analysis ppt powerpoint presentation introduction. This is a six stage process. The stages in this process are business, marketing, analysis, strategy, chart and graph, growth.

Trend Line Technical Analysis Powerpoint Themes
This is a trend line technical analysis powerpoint themes. This is a five stage process. The stages in this process are complex systems, statistical modeling, uncertainty, lateral thinking, mathematical analysis.
Swot Analysis Icon Illustration Of Predictive Analytics Promotions Ppt PowerPoint Presentation File Elements PDF
Persuade your audience using this swot analysis icon illustration of predictive analytics promotions ppt powerpoint presentation file elements pdf. This PPT design covers four stages, thus making it a great tool to use. It also caters to a variety of topics including strengths, weaknesses, opportunities. Download this PPT design now to present a convincing pitch that not only emphasizes the topic but also showcases your presentation skills.
Modelling Technique Of Dynamic System Development Model Icons PDF
This slide depicts modelling as a technique of Dynamic Systems Development Model which helps in the visualization of various elements of the project. This is a modelling technique of dynamic system development model icons pdf template with various stages. Focus and dispense information on four stages using this creative set, that comes with editable features. It contains large content boxes to add your information on topics like processes, locations, customers, strategy. You can also showcase facts, figures, and other relevant content using this PPT layout. Grab it now.
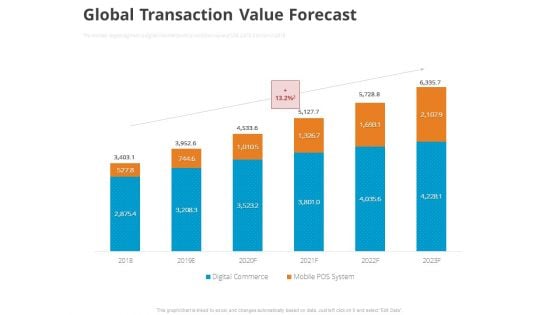
Online Settlement Revolution Global Transaction Value Forecast Sample PDF
The markets largest segment is digital commerce with a transition value of US 2,875.5 billion in 2018. Deliver an awe inspiring pitch with this creative online settlement revolution global transaction value forecast sample pdf bundle. Topics like global transaction value forecast can be discussed with this completely editable template. It is available for immediate download depending on the needs and requirements of the user.
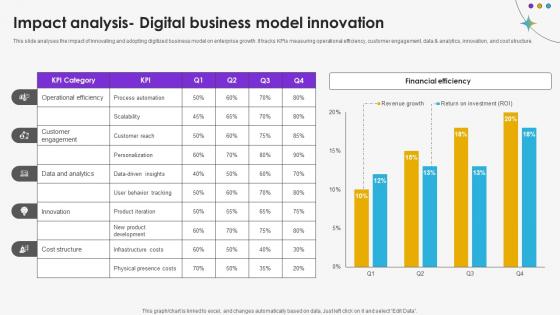
Impact Analysis Digital Business Model Innovation DT SS V
This slide analyses the impact of innovating and adopting digitized business model on enterprise growth. It tracks KPIs measuring operational efficiency, customer engagement, data and analytics, innovation, and cost structure.Do you have an important presentation coming up Are you looking for something that will make your presentation stand out from the rest Look no further than Impact Analysis Digital Business Model Innovation DT SS V. With our professional designs, you can trust that your presentation will pop and make delivering it a smooth process. And with Slidegeeks, you can trust that your presentation will be unique and memorable. So why wait Grab Impact Analysis Digital Business Model Innovation DT SS V today and make your presentation stand out from the rest. This slide analyses the impact of innovating and adopting digitized business model on enterprise growth. It tracks KPIs measuring operational efficiency, customer engagement, data and analytics, innovation, and cost structure.
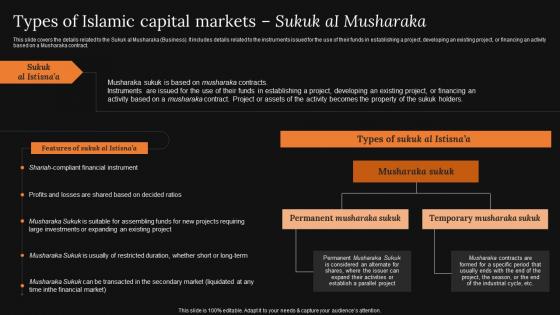
A Detailed Knowledge Of Islamic Finance Types Of Islamic Capital Markets Sukuk Download Pdf
This slide covers the details related to the Sukuk al Musharaka Business. It includes details related to the instruments issued for the use of their funds in establishing a project, developing an existing project, or financing an activity based on a Musharaka contract. Retrieve professionally designed A Detailed Knowledge Of Islamic Finance Types Of Islamic Capital Markets Sukuk Download Pdf to effectively convey your message and captivate your listeners. Save time by selecting pre made slideshows that are appropriate for various topics, from business to educational purposes. These themes come in many different styles, from creative to corporate, and all of them are easily adjustable and can be edited quickly. Access them as PowerPoint templates or as Google Slides themes. You do not have to go on a hunt for the perfect presentation because Slidegeeks got you covered from everywhere. This slide covers the details related to the Sukuk al Musharaka Business. It includes details related to the instruments issued for the use of their funds in establishing a project, developing an existing project, or financing an activity based on a Musharaka contract.
Predictive Analytics Classification Model Introduction Forward Looking Analysis IT Icons PDF
This slide describes the overview of the classification model used in predictive analytics, including the questions it answers. It also contains algorithms used in this model, such as random forest, gradient boosted model, convolution neural network, bagging, and stacking.Are you in need of a template that can accommodate all of your creative concepts This one is crafted professionally and can be altered to fit any style. Use it with Google Slides or PowerPoint. Include striking photographs, symbols, depictions, and other visuals. Fill, move around, or remove text boxes as desired. Test out color palettes and font mixtures. Edit and save your work, or work with colleagues. Download Predictive Analytics Classification Model Introduction Forward Looking Analysis IT Icons PDF and observe how to make your presentation outstanding. Give an impeccable presentation to your group and make your presentation unforgettable.

Quantitative Data Analysis Methods Diagram Powerpoint Slide
This is a quantitative data analysis methods diagram powerpoint slide. This is a three stage process. The stages in this process are organizing data, presenting data, data analysis.
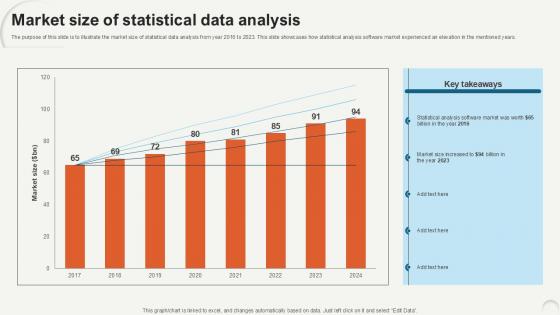
Market Size Of Statistical Data Analytics For Informed Decision Ppt Template
The purpose of this slide is to illustrate the market size of statistical data analysis from year 2016 to 2023. This slide showcases how statistical analysis software market experienced an elevation in the mentioned years. Explore a selection of the finest Market Size Of Statistical Data Analytics For Informed Decision Ppt Template here. With a plethora of professionally designed and pre-made slide templates, you can quickly and easily find the right one for your upcoming presentation. You can use our Market Size Of Statistical Data Analytics For Informed Decision Ppt Template to effectively convey your message to a wider audience. Slidegeeks has done a lot of research before preparing these presentation templates. The content can be personalized and the slides are highly editable. Grab templates today from Slidegeeks. The purpose of this slide is to illustrate the market size of statistical data analysis from year 2016 to 2023. This slide showcases how statistical analysis software market experienced an elevation in the mentioned years.
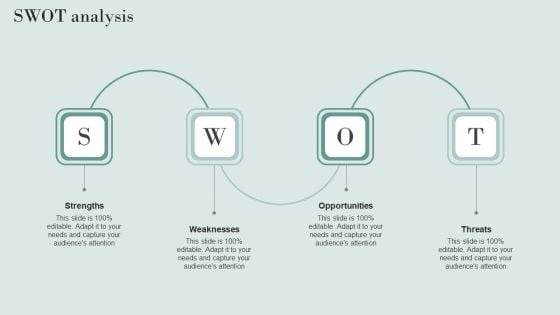
Data Structure IT Swot Analysis Diagrams PDF
Presenting this PowerPoint presentation, titled Data Structure IT Swot Analysis Diagrams PDF, with topics curated by our researchers after extensive research. This editable presentation is available for immediate download and provides attractive features when used. Download now and captivate your audience. Presenting this Data Structure IT Swot Analysis Diagrams PDF. Our researchers have carefully researched and created these slides with all aspects taken into consideration. This is a completely customizable Data Structure IT Swot Analysis Diagrams PDF that is available for immediate downloading. Download now and make an impact on your audience. Highlight the attractive features available with our PPTs.
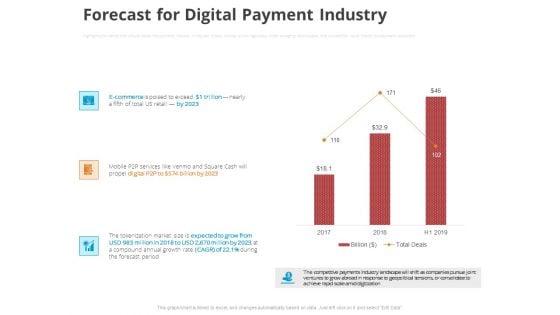
Online Settlement Revolution Forecast For Digital Payment Industry Pictures PDF
Highlights five trends that should shape the payments industry in the year ahead, looking at how regulatory shifts, emerging technologies, and competition could impact the payments ecosystem. Deliver and pitch your topic in the best possible manner with this online settlement revolution forecast for digital payment industry pictures pdf. Use them to share invaluable insights on forecast for digital payment industry and impress your audience. This template can be altered and modified as per your expectations. So, grab it now.
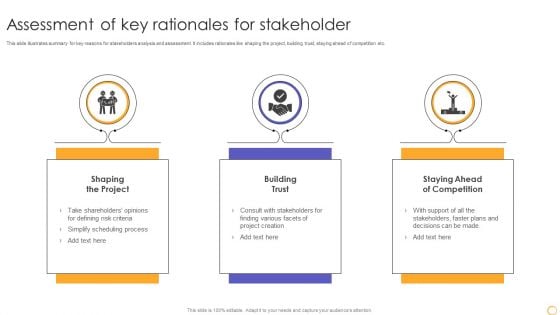
Assessment Of Key Rationales For Stakeholder Structure PDF
This slide illustrates summary for key reasons for stakeholders analysis and assessment. It includes rationales like shaping the project, building trust, staying ahead of competition etc. Presenting Assessment Of Key Rationales For Stakeholder Structure PDF to dispense important information. This template comprises three stages. It also presents valuable insights into the topics including Shaping The Project, Building Trust, Staying Ahead Of Competition. This is a completely customizable PowerPoint theme that can be put to use immediately. So, download it and address the topic impactfully.
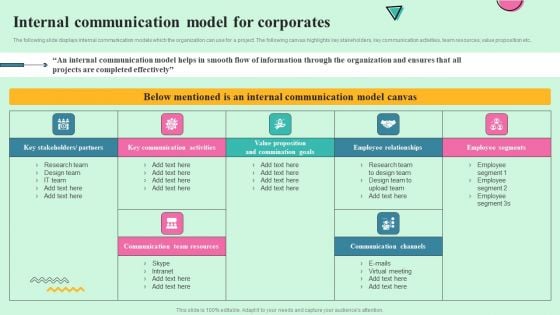
Developing Effective Stakeholder Communication Internal Communication Model Ideas PDF
The following slide displays internal communication models which the organization can use for a project. The following canvas highlights key stakeholders, key communication activities, team resources, value proposition etc. Get a simple yet stunning designed Developing Effective Stakeholder Communication Internal Communication Model Ideas PDF. It is the best one to establish the tone in your meetings. It is an excellent way to make your presentations highly effective. So, download this PPT today from Slidegeeks and see the positive impacts. Our easy-to-edit Developing Effective Stakeholder Communication Internal Communication Model Ideas PDF can be your go-to option for all upcoming conferences and meetings. So, what are you waiting for Grab this template today.
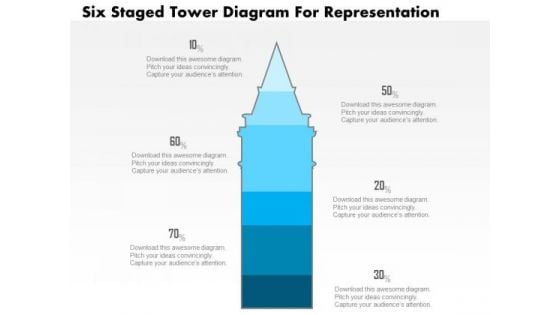
Business Diagram Five Staged Tower Diagram For Representation PowerPoint Slide
This business slide displays five staged tower diagram. It contains blue tower graphic divided into five parts. This diagram slide depicts processes, stages, steps, points, options information display. Use this diagram, in your presentations to express your views innovatively.
Training Program For Predictive Analytics Model Forward Looking Analysis IT Icons PDF
This slide represents the training program for the predictive analytics model, and it includes the name of teams, trainer names, modules to be covered in training, and the schedule and venue of the training.Want to ace your presentation in front of a live audience Our Training Program For Predictive Analytics Model Forward Looking Analysis IT Icons PDF can help you do that by engaging all the users towards you.. Slidegeeks experts have put their efforts and expertise into creating these impeccable powerpoint presentations so that you can communicate your ideas clearly. Moreover, all the templates are customizable, and easy-to-edit and downloadable. Use these for both personal and commercial use.
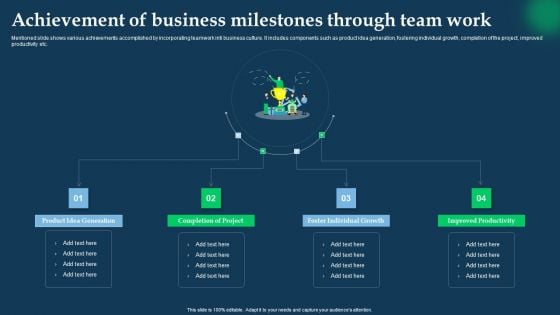
Achievement Of Business Milestones Through Team Work Formats PDF
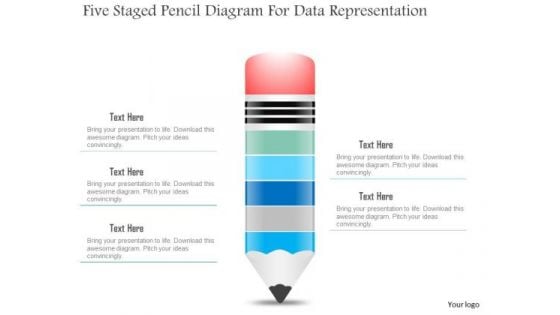
Business Diagram Five Staged Pencil Diagram For Data Representation PowerPoint Slide
This business slide displays five staged pencil diagram. It contains pencil graphic divided into five parts. This diagram slide depicts processes, stages, steps, points, options and education information display. Use this diagram, in your presentations to express your views innovatively.
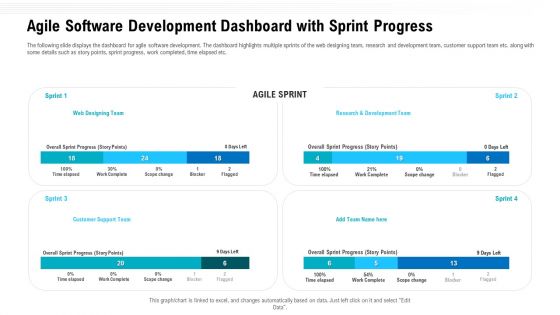
Agile Software Development Dashboard With Sprint Progress Ppt Model Guidelines PDF
The following slide displays the dashboard for agile software development. The dashboard highlights multiple sprints of the web designing team, research and development team, customer support team etc. along with some details such as story points, sprint progress, work completed, time elapsed etc. Deliver an awe inspiring pitch with this creative agile software development dashboard with sprint progress ppt model guidelines pdf bundle. Topics like overall sprint progress, customer support team, research development team can be discussed with this completely editable template. It is available for immediate download depending on the needs and requirements of the user.
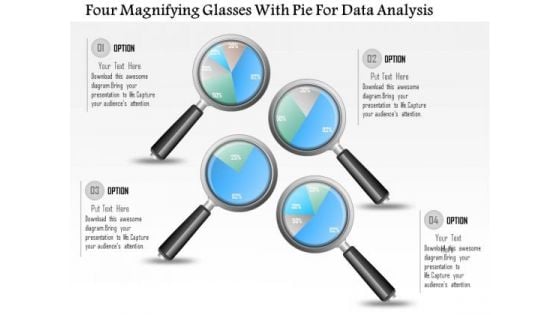
Business Diagram Four Magnifying Glasses With Pie For Data Analysis PowerPoint Slide
This business diagram displays graphic of pie charts in shape of magnifying glasses This business slide is suitable to present and compare business data. Use this diagram to build professional presentations for your viewers.
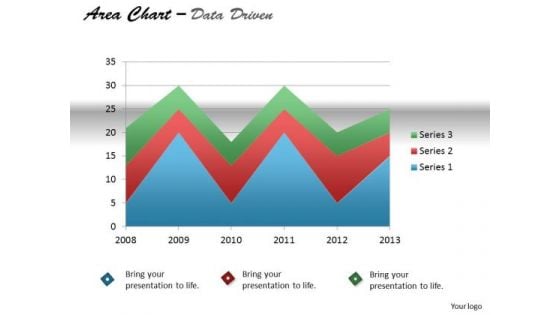
Quantitative Data Analysis Driven Display Series With Area Chart PowerPoint Slides Templates
Our quantitative data analysis driven display series with area chart powerpoint slides Templates Enjoy Drama. They Provide Entertaining Backdrops.
Problem Analysis Overview Procedure Icon Summary PDF
Presenting Problem Analysis Overview Procedure Icon Summary PDF to dispense important information. This template comprises three stages. It also presents valuable insights into the topics including Problem Analysis, Overview Procedure Icon . This is a completely customizable PowerPoint theme that can be put to use immediately. So, download it and address the topic impactfully.
Database Management Vector Icon Ppt PowerPoint Presentation Professional Format Ideas
Presenting this set of slides with name database management vector icon ppt powerpoint presentation professional format ideas. The topics discussed in these slides are data sources, database management, marketing. This is a completely editable PowerPoint presentation and is available for immediate download. Download now and impress your audience.
Dashboard For Tracking Leadership Training And Development Program Progress Topics PDF
This slide illustrates dashboard for tracking leadership development program progress. It also contains information about performing leaders, competency heatmap, executive training, etc. Pitch your topic with ease and precision using this Dashboard For Tracking Leadership Training And Development Program Progress Topics PDF. This layout presents information on People Completed, Number Trainees, Leadership Training. It is also available for immediate download and adjustment. So, changes can be made in the color, design, graphics or any other component to create a unique layout.
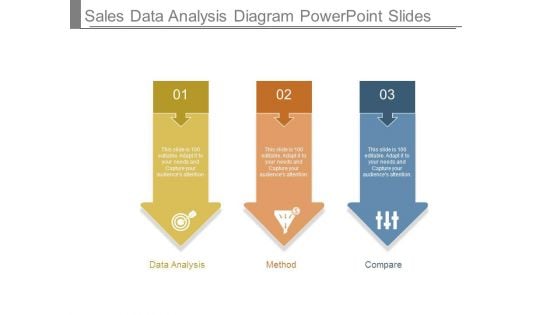
Sales Data Analysis Diagram Powerpoint Slides
This is a sales data analysis diagram powerpoint slides. This is a three stage process. The stages in this process are data analysis, method, compare.
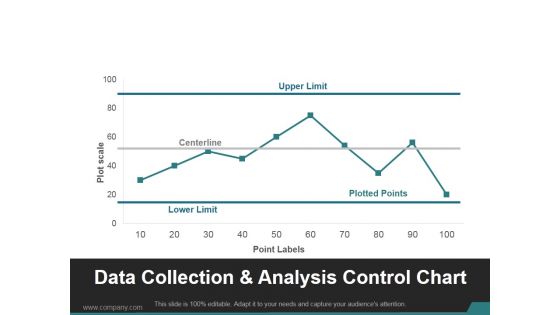
Data Collection And Analysis Control Chart Ppt PowerPoint Presentation Visuals
This is a data collection and analysis control chart ppt powerpoint presentation visuals. This is a ten stage process. The stages in this process are upper limit, centerline, lower limit, plotted points.

Business Data Analysis Media Themes PDF
This is a business data analysis media themes pdf template with various stages. Focus and dispense information on one stage using this creative set, that comes with editable features. It contains large content boxes to add your information on topics like media is the most popular source of big data, as it provides valuable insights on consumer preferences and changing trends, media includes social media and interactive platforms, like google, facebook, twitter, youtube, instagram. You can also showcase facts, figures, and other relevant content using this PPT layout. Grab it now.
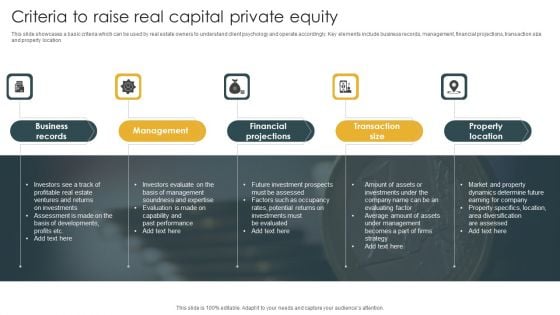
Criteria To Raise Real Capital Private Equity Information PDF
This slide showcases a basic criteria which can be used by real estate owners to understand client psychology and operate accordingly. Key elements include business records, management, financial projections, transaction size and property location. Presenting Criteria To Raise Real Capital Private Equity Information PDF to dispense important information. This template comprises five stages. It also presents valuable insights into the topics including Transaction Size, Property Location, Financial Projections. This is a completely customizable PowerPoint theme that can be put to use immediately. So, download it and address the topic impactfully.
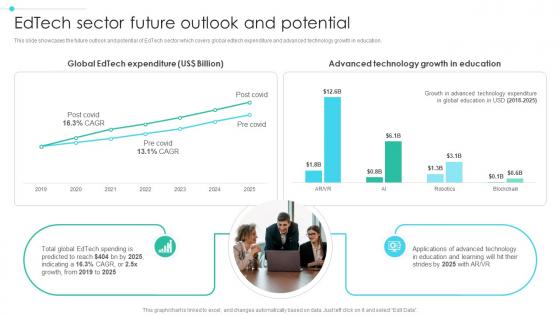
Global Digital Education Edtech Sector Future Outlook And Potential IR SS V
This slide showcases the future outlook and potential of EdTech sector which covers global edtech expenditure and advanced technology growth in education. Slidegeeks is here to make your presentations a breeze with Global Digital Education Edtech Sector Future Outlook And Potential IR SS V With our easy-to-use and customizable templates, you can focus on delivering your ideas rather than worrying about formatting. With a variety of designs to choose from, you are sure to find one that suits your needs. And with animations and unique photos, illustrations, and fonts, you can make your presentation pop. So whether you are giving a sales pitch or presenting to the board, make sure to check out Slidegeeks first This slide showcases the future outlook and potential of EdTech sector which covers global edtech expenditure and advanced technology growth in education.
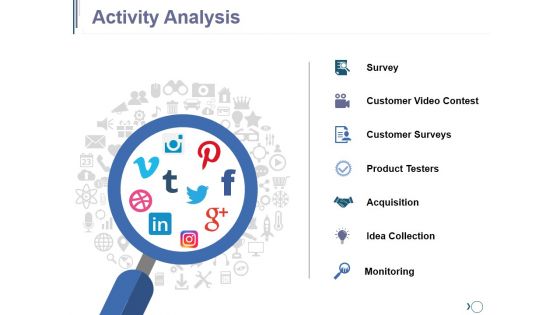
Activity Analysis Ppt PowerPoint Presentation Diagram Images
This is a activity analysis ppt powerpoint presentation diagram images. This is a one stage process. The stages in this process are survey, customer video contest, customer surveys, product testers, acquisition, idea collection.

Predictive Analysis Strategy Three Months Roadmap For Effective Customer Engagement Clipart
We present our predictive analysis strategy three months roadmap for effective customer engagement clipart. This PowerPoint layout is easy-to-edit so you can change the font size, font type, color, and shape conveniently. In addition to this, the PowerPoint layout is Google Slides compatible, so you can share it with your audience and give them access to edit it. Therefore, download and save this well-researched predictive analysis strategy three months roadmap for effective customer engagement clipart in different formats like PDF, PNG, and JPG to smoothly execute your business plan.
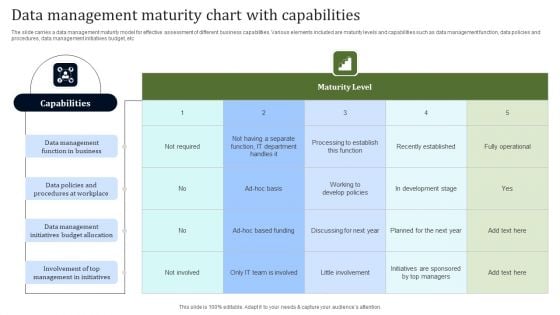
Data Management Maturity Chart With Capabilities Topics PDF
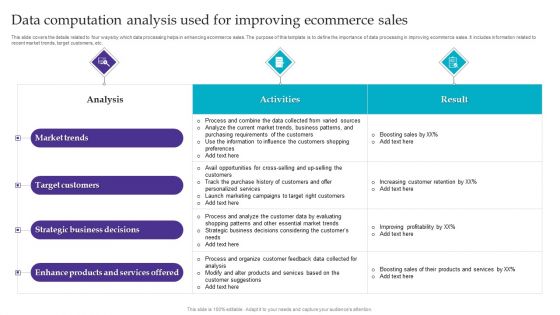
Data Computation Analysis Used For Improving Ecommerce Sales Themes PDF
This slide covers the details related to four ways by which data processing helps in enhancing ecommerce sales. The purpose of this template is to define the importance of data processing in improving ecommerce sales. It includes information related to recent market trends, target customers, etc. Showcasing this set of slides titled Data Computation Analysis Used For Improving Ecommerce Sales Themes PDF. The topics addressed in these templates are Target Customers, Strategic Business Decisions, Market Trends. All the content presented in this PPT design is completely editable. Download it and make adjustments in color, background, font etc. as per your unique business setting.
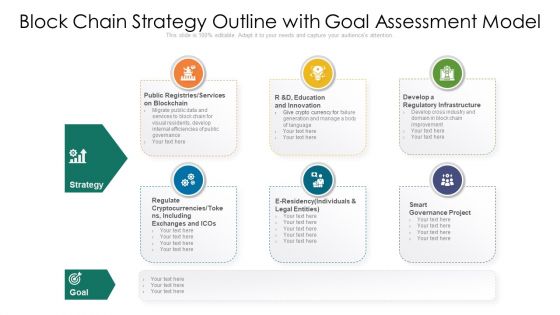
Block Chain Strategy Outline With Goal Assessment Model Ppt Infographic Template Visual Aids PDF
Presenting block chain strategy outline with goal assessment model ppt infographic template visual aids pdf to dispense important information. This template comprises six stages. It also presents valuable insights into the topics including innovation, governance project, regulatory infrastructure, strategy, goal. This is a completely customizable PowerPoint theme that can be put to use immediately. So, download it and address the topic impactfully.

Data Analysis Excel Driven Pie Chart For Easy Comparison PowerPoint Slides Templates
Our data analysis excel driven pie chart for easy comparison powerpoint slides Templates Abhor Doodling. They Never Let The Interest Flag.
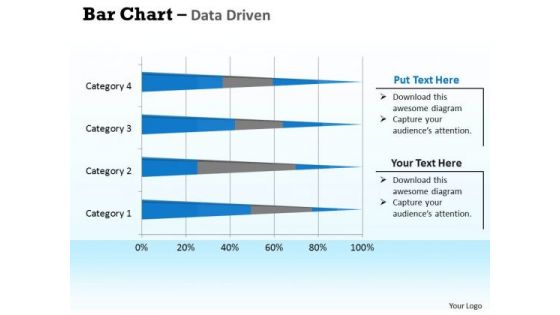
Data Analysis In Excel 3d Bar Chart For Interpretation PowerPoint Templates
Double Up Our data analysis in excel 3d bar chart for interpretation Powerpoint Templates With Your Thoughts. They Will Make An Awesome Pair.
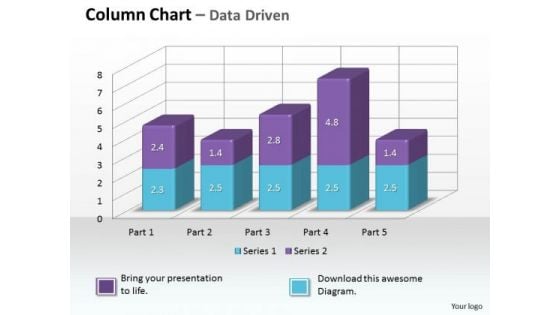
Data Analysis On Excel 3d Chart To Monitor Business Process PowerPoint Templates
Make Some Dough With Our data analysis on excel 3d chart to monitor business process Powerpoint Templates . Your Assets Will Rise Significantly.
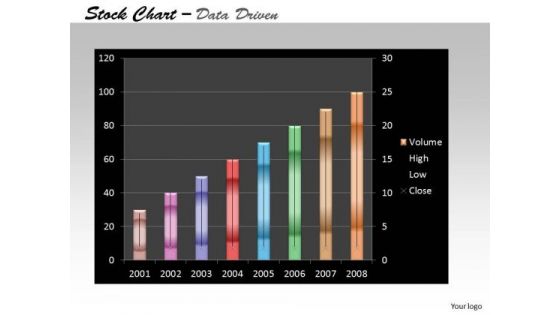
Data Analysis On Excel Driven Stock Chart For Business Growth PowerPoint Slides Templates
Add Some Dramatization To Your Thoughts. Our data analysis on excel driven stock chart for business growth powerpoint slides Templates Make Useful Props.
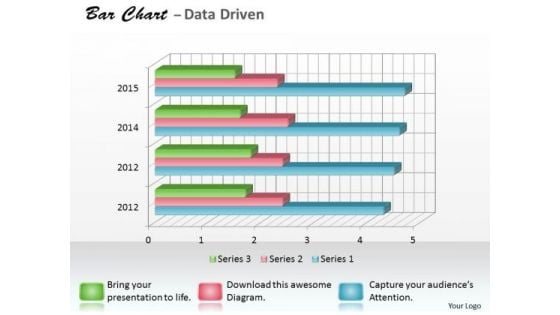
Data Analysis Programs 3d Bar Chart For Research In Statistics PowerPoint Templates
Draw It Out On Our data analysis programs 3d bar chart for research in statistics Powerpoint Templates . Provide Inspiration To Your Colleagues.
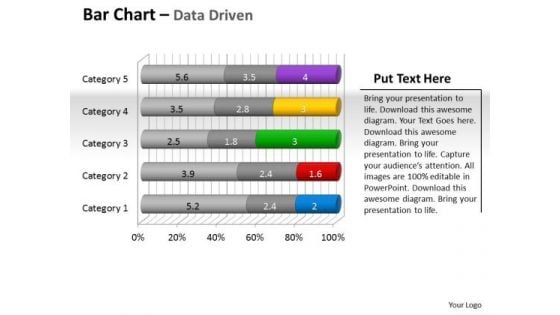
Data Analysis Programs 3d Bar Chart To Put Information PowerPoint Templates
Draw Up Your Agenda On Our data analysis programs 3d bar chart to put information Powerpoint Templates . Coax Your Audience Into Acceptance.
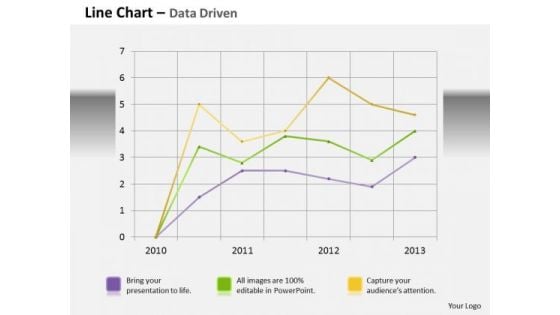
Data Analysis Template Driven Line Chart Business Graph PowerPoint Slides Templates
Bottle Your Thoughts In Our data analysis template driven line chart business graph powerpoint slides Templates . Pass It Around For Your Audience To Sip.
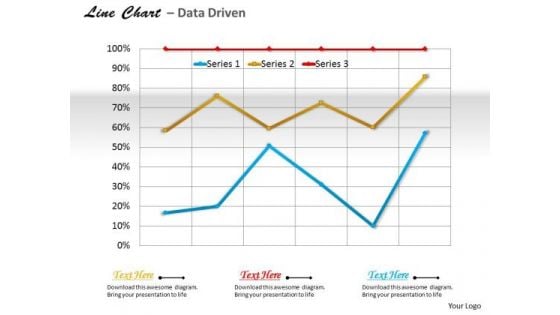
Data Analysis Template Driven Line Chart For Business Trends PowerPoint Slides Templates
Use Our data analysis template driven line chart for business trends powerpoint slides Templates As The Bit. Drill Your Thoughts Into Their Minds.
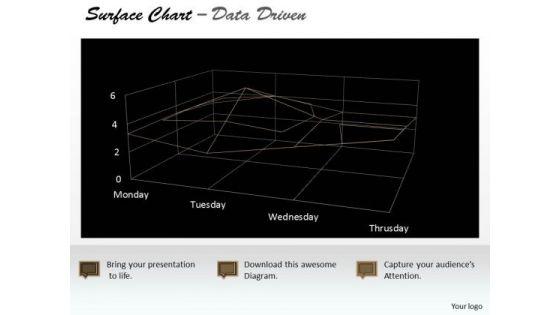
Data Analysis Template Driven Surface Chart Indicating Areas PowerPoint Slides Templates
Highlight Your Drive With Our data analysis template driven surface chart indicating areas powerpoint slides Templates . Prove The Fact That You Have Control.
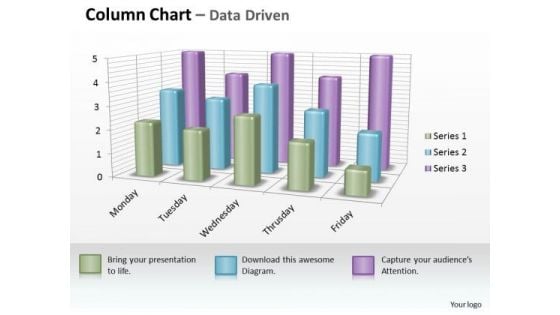
Examples Of Data Analysis Market 3d Business Inspection Procedure Chart PowerPoint Templates
However Dry Your Topic Maybe. Make It Catchy With Our examples of data analysis market 3d business inspection procedure chart Powerpoint Templates .
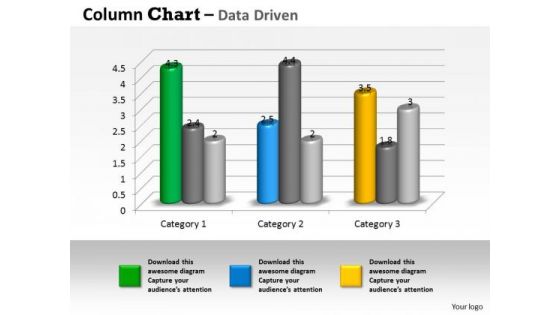
Examples Of Data Analysis Market 3d Business Trend Series Chart PowerPoint Templates
Duct It Through With Our examples of data analysis market 3d business trend series chart Powerpoint Templates . Your Ideas Will Reach Into Their Minds Intact.
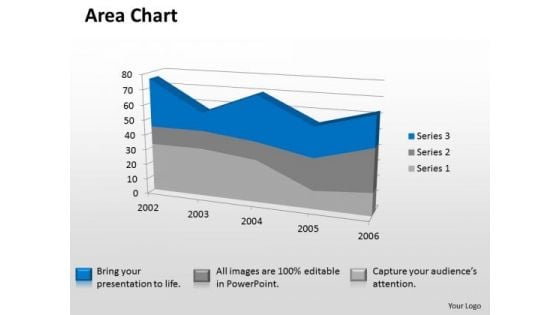
Microsoft Excel Data Analysis 3d Area Chart Showimg Change In Values PowerPoint Templates
Our microsoft excel data analysis 3d area chart showimg change in values Powerpoint Templates Deliver At Your Doorstep. Let Them In For A Wonderful Experience.
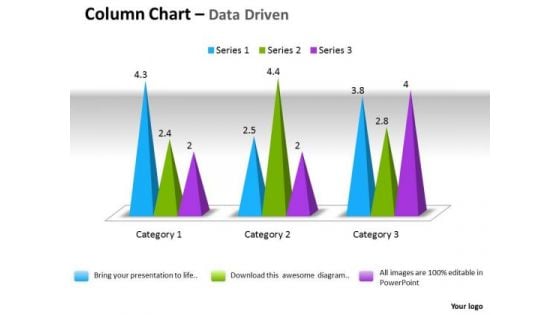
Microsoft Excel Data Analysis 3d Change In Business Process Chart PowerPoint Templates
Double Your Chances With Our microsoft excel data analysis 3d change in business process chart Powerpoint Templates . The Value Of Your Thoughts Will Increase Two-Fold.
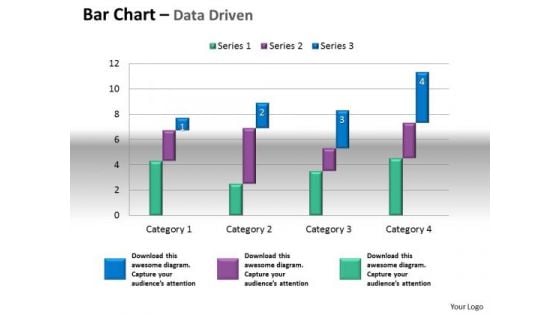
Microsoft Excel Data Analysis Bar Chart To Compare Quantities PowerPoint Templates
Our microsoft excel data analysis bar chart to compare quantities Powerpoint Templates Leave No One In Doubt. Provide A Certainty To Your Views.
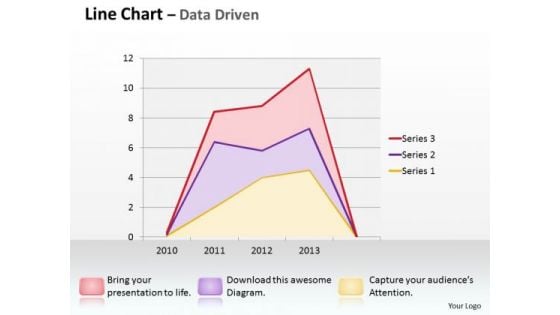
Multivariate Data Analysis Driven Line Chart Shows Revenue Trends PowerPoint Slides Templates
Good Camaraderie Is A Key To Teamwork. Our multivariate data analysis driven line chart shows revenue trends powerpoint slides Templates Can Be A Cementing Force.

Quantitative Data Analysis 3d Pie Chart For Business Process PowerPoint Templates
Put Them On The Same Page With Our quantitative data analysis 3d pie chart for business process Powerpoint Templates . Your Team Will Sing From The Same Sheet.

Data Analysis Excel 3d Pie Chart For Marketing Process PowerPoint Templates
Our data analysis excel 3d pie chart for marketing process Powerpoint Templates Team Are A Dogged Lot. They Keep At It Till They Get It Right.
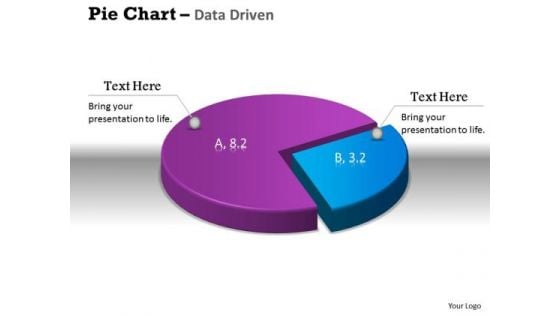
Data Analysis Excel 3d Pie Chart Shows Relative Size Of PowerPoint Templates
Get The Doers Into Action. Activate Them With Our data analysis excel 3d pie chart shows relative size of Powerpoint Templates.
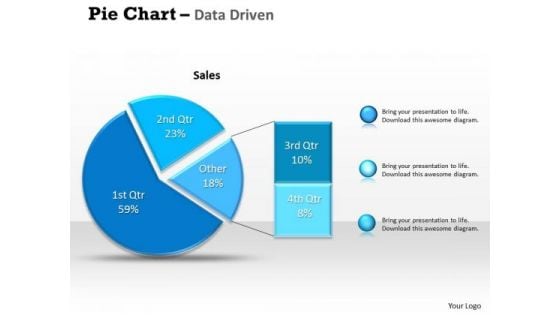
Data Analysis Excel Driven Percentage Breakdown Pie Chart PowerPoint Slides Templates
Be A Donor Of Great Ideas. Display Your Charity On Our data analysis excel driven percentage breakdown pie chart powerpoint slides Templates.
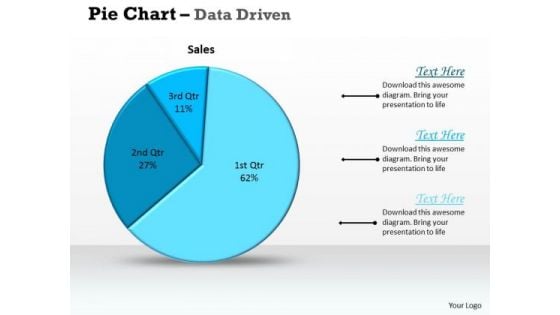
Data Analysis Excel Driven Pie Chart For Sales Process PowerPoint Slides Templates
Deliver The Right Dose With Our data analysis excel driven pie chart for sales process powerpoint slides Templates . Your Ideas Will Get The Correct Illumination.
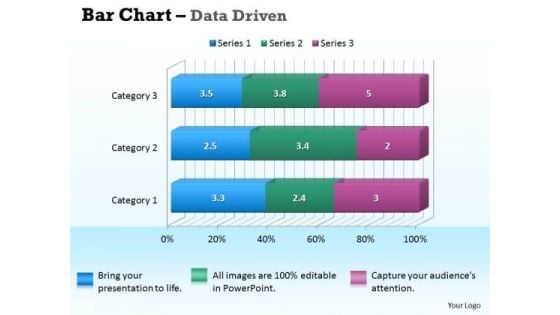
Data Analysis In Excel 3d Bar Chart For Business Information PowerPoint Templates
Our data analysis in excel 3d bar chart for business information Powerpoint Templates Deliver At Your Doorstep. Let Them In For A Wonderful Experience.


 Continue with Email

 Home
Home


