Rating Meter
Comprehensive Guide For Website Various Kpis For Tracking Business Performance
Mentioned slide provide insights into various key performance indicators to determine business performance. It includes KPIs such as business financials, website traffic, customer case, customer engagement, conversion rate, customer retention, customer bounce rate, employee turnover, etc. Make sure to capture your audiences attention in your business displays with our gratis customizable Comprehensive Guide For Website Various Kpis For Tracking Business Performance. These are great for business strategies, office conferences, capital raising or task suggestions. If you desire to acquire more customers for your tech business and ensure they stay satisfied, create your own sales presentation with these plain slides. Mentioned slide provide insights into various key performance indicators to determine business performance. It includes KPIs such as business financials, website traffic, customer case, customer engagement, conversion rate, customer retention, customer bounce rate, employee turnover, etc.
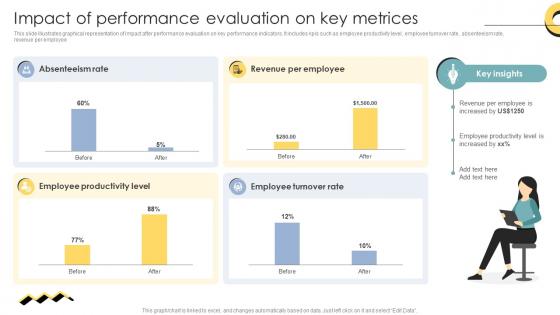
Skill Enhancement Performance Impact Of Performance Evaluation On Key Metrices
This slide illustrates graphical representation of impact after performance evaluation on key performance indicators. It includes kpis such as employee productivity level, employee turnover rate, absenteeism rate, revenue per employee. Do you have to make sure that everyone on your team knows about any specific topic I yes, then you should give Skill Enhancement Performance Impact Of Performance Evaluation On Key Metrices a try. Our experts have put a lot of knowledge and effort into creating this impeccable Skill Enhancement Performance Impact Of Performance Evaluation On Key Metrices. You can use this template for your upcoming presentations, as the slides are perfect to represent even the tiniest detail. You can download these templates from the Slidegeeks website and these are easy to edit. So grab these today This slide illustrates graphical representation of impact after performance evaluation on key performance indicators. It includes kpis such as employee productivity level, employee turnover rate, absenteeism rate, revenue per employee.

KPIS Affected Post Recruitment Technology Cloud Recruiting Technologies PPT Example
This slide showcases key performance indicators impacted after utilization of recruitment technology. It provides details about candidate quality, turnover rate, turnover cost, average hiring time, absences, hiring time, staff growth rate, etc. This modern and well-arranged KPIS Affected Post Recruitment Technology Cloud Recruiting Technologies PPT Example provides lots of creative possibilities. It is very simple to customize and edit with the Powerpoint Software. Just drag and drop your pictures into the shapes. All facets of this template can be edited with Powerpoint, no extra software is necessary. Add your own material, put your images in the places assigned for them, adjust the colors, and then you can show your slides to the world, with an animated slide included. This slide showcases key performance indicators impacted after utilization of recruitment technology. It provides details about candidate quality, turnover rate, turnover cost, average hiring time, absences, hiring time, staff growth rate, etc.

KPIS Affected Post Recruitment Technology Utilization PPT Example
This slide showcases key performance indicators impacted after utilization of recruitment technology. It provides details about candidate quality, turnover rate, turnover cost, average hiring time, absences, hiring time, staff growth rate, etc. This modern and well-arranged KPIS Affected Post Recruitment Technology Utilization PPT Example provides lots of creative possibilities. It is very simple to customize and edit with the Powerpoint Software. Just drag and drop your pictures into the shapes. All facets of this template can be edited with Powerpoint, no extra software is necessary. Add your own material, put your images in the places assigned for them, adjust the colors, and then you can show your slides to the world, with an animated slide included. This slide showcases key performance indicators impacted after utilization of recruitment technology. It provides details about candidate quality, turnover rate, turnover cost, average hiring time, absences, hiring time, staff growth rate, etc.

Stormy Weather Nature PowerPoint Template 0910
a barometer with the needle set on stormy. Get the correct coordination with our Stormy Weather Nature PowerPoint Template 0910. They blend beautifully with your thoughts.
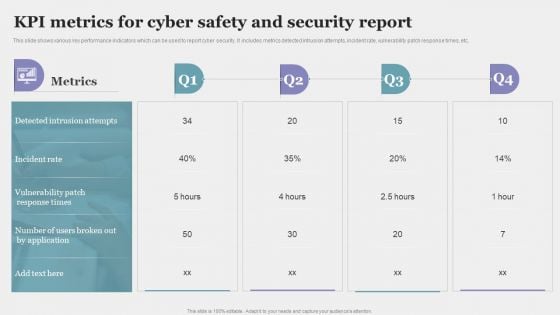
KPI Metrics For Cyber Safety And Security Report Elements PDF
This slide shows various key performance indicators which can be used to report cyber security. It includes metrics detected intrusion attempts, incident rate, vulnerability patch response times, etc. Showcasing this set of slides titled KPI Metrics For Cyber Safety And Security Report Elements PDF. The topics addressed in these templates are Incident Rate, Application, Metrics. All the content presented in this PPT design is completely editable. Download it and make adjustments in color, background, font etc. as per your unique business setting.
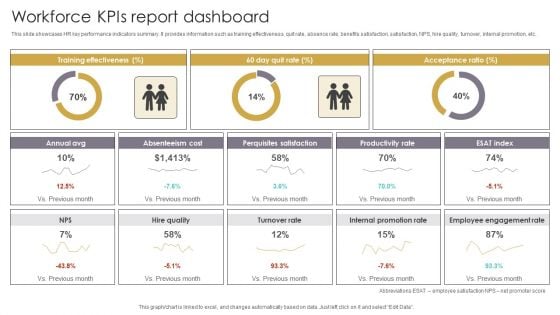
Workforce Kpis Report Dashboard Slides PDF
This slide showcases HR key performance indicators summary. It provides information such as training effectiveness, quit rate, absence rate, benefits satisfaction, satisfaction, NPS, hire quality, turnover, internal promotion, etc. Pitch your topic with ease and precision using this Workforce Kpis Report Dashboard Slides PDF. This layout presents information on Acceptance Ratio, Absenteeism Cost, Perquisites Satisfaction. It is also available for immediate download and adjustment. So, changes can be made in the color, design, graphics or any other component to create a unique layout.
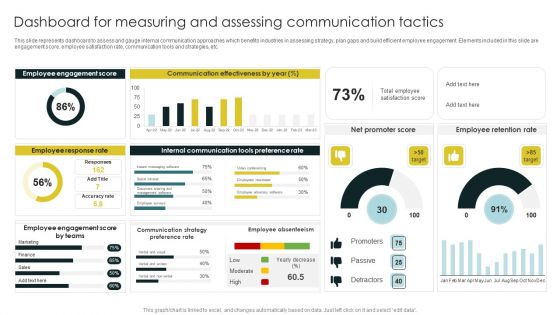
Dashboard For Measuring And Assessing Communication Tactics Information PDF
This slide represents dashboard to assess and gauge internal communication approaches which benefits industries in assessing strategy, plan gaps and build efficient employee engagement. Elements included in this slide are engagement score, employee satisfaction rate, communication tools and strategies, etc. Showcasing this set of slides titled Dashboard For Measuring And Assessing Communication Tactics Information PDF. The topics addressed in these templates are Employee Engagement, Employee Response Rate, Communication Effectiveness. All the content presented in this PPT design is completely editable. Download it and make adjustments in color, background, font etc. as per your unique business setting.
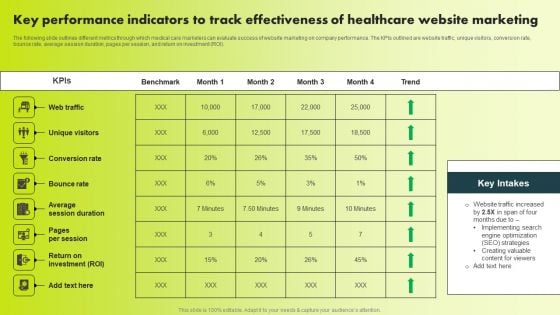
Key Performance Indicators To Track Effectiveness Of Healthcare Website Marketing Themes PDF
The following slide outlines different metrics through which medical care marketers can evaluate success of website marketing on company performance. The KPIs outlined are website traffic, unique visitors, conversion rate, bounce rate, average session duration, pages per session, and return on investment ROI. Whether you have daily or monthly meetings, a brilliant presentation is necessary. Key Performance Indicators To Track Effectiveness Of Healthcare Website Marketing Themes PDF can be your best option for delivering a presentation. Represent everything in detail using Key Performance Indicators To Track Effectiveness Of Healthcare Website Marketing Themes PDF and make yourself stand out in meetings. The template is versatile and follows a structure that will cater to your requirements. All the templates prepared by Slidegeeks are easy to download and edit. Our research experts have taken care of the corporate themes as well. So, give it a try and see the results.
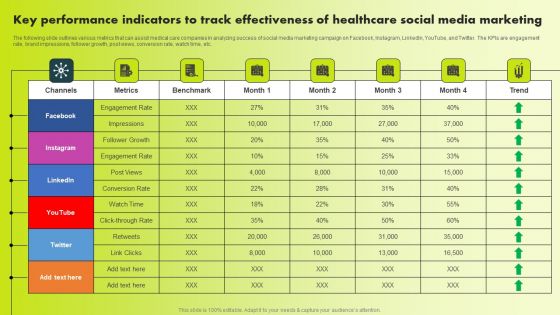
Key Performance Indicators To Track Effectiveness Of Healthcare Social Media Marketing Elements PDF
The following slide outlines various metrics that can assist medical care companies in analyzing success of social media marketing campaign on Facebook, Instagram, LinkedIn, YouTube, and Twitter. The KPIs are engagement rate, brand impressions, follower growth, post views, conversion rate, watch time, etc. Slidegeeks is here to make your presentations a breeze with Key Performance Indicators To Track Effectiveness Of Healthcare Social Media Marketing Elements PDF With our easy-to-use and customizable templates, you can focus on delivering your ideas rather than worrying about formatting. With a variety of designs to choose from, you are sure to find one that suits your needs. And with animations and unique photos, illustrations, and fonts, you can make your presentation pop. So whether you are giving a sales pitch or presenting to the board, make sure to check out Slidegeeks first
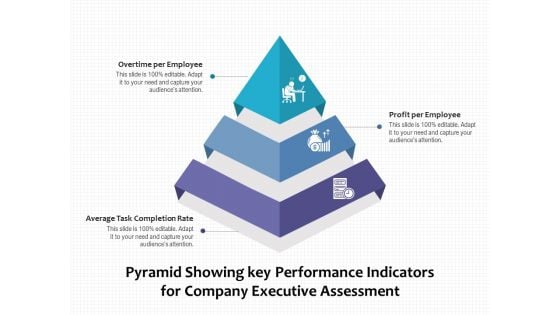
Pyramid Showing Key Performance Indicators For Company Executive Assessment Ppt PowerPoint Presentation Portfolio Rules PDF
Presenting pyramid showing key performance indicators for company executive assessment ppt powerpoint presentation portfolio rules pdf to dispense important information. This template comprises three stages. It also presents valuable insights into the topics including overtime per employee, profit per employee, average task completion rate. This is a completely customizable PowerPoint theme that can be put to use immediately. So, download it and address the topic impactfully.
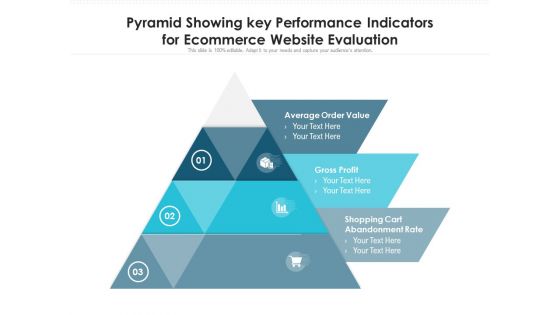
Pyramid Showing Key Performance Indicators For Ecommerce Website Evaluation Ppt PowerPoint Presentation Portfolio Layout Ideas PDF
Persuade your audience using this pyramid showing key performance indicators for ecommerce website evaluation ppt powerpoint presentation portfolio layout ideas pdf. This PPT design covers three stages, thus making it a great tool to use. It also caters to a variety of topics including average order value, gross profit, shopping cart abandonment rate. Download this PPT design now to present a convincing pitch that not only emphasizes the topic but also showcases your presentation skills.
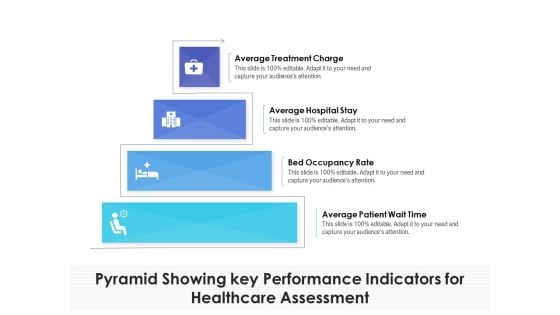
Pyramid Showing Key Performance Indicators For Healthcare Assessment Ppt PowerPoint Presentation Show Background Image PDF
Presenting pyramid showing key performance indicators for healthcare assessment ppt powerpoint presentation show background image pdf to dispense important information. This template comprises four stages. It also presents valuable insights into the topics including average treatment charge, average hospital stay, bed occupancy rate, average patient wait time. This is a completely customizable PowerPoint theme that can be put to use immediately. So, download it and address the topic impactfully.
Key Performance Indicators Of Nss Electronic Manufacturing Company With Future Targets Icons PDF
Presenting key performance indicators of nss electronic manufacturing company with future targets icons pdf to provide visual cues and insights. Share and navigate important information on five stages that need your due attention. This template can be used to pitch topics like company revenue, labor shortage rate, on standard operating efficiency. In addtion, this PPT design contains high resolution images, graphics, etc, that are easily editable and available for immediate download.
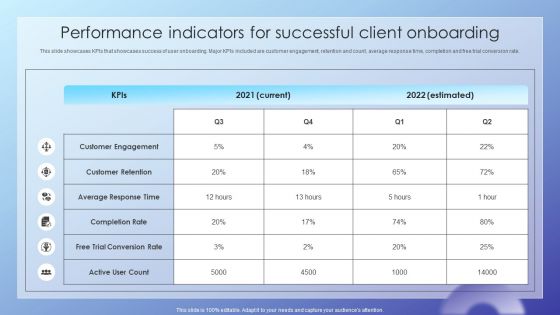
Client Acquisition Journey Plan Performance Indicators For Successful Client Structure PDF
This slide showcases KPIs that showcases success of user onboarding. Major KPIs included are customer engagement, retention and count, average response time, completion and free trial conversion rate. There are so many reasons you need a Client Acquisition Journey Plan Performance Indicators For Successful Client Structure PDF. The first reason is you cant spend time making everything from scratch, Thus, Slidegeeks has made presentation templates for you too. You can easily download these templates from our website easily.

Revenue Performance Reporting Speedometer Ppt PowerPoint Presentation Visuals
This is a revenue performance reporting speedometer ppt powerpoint presentation visuals. This is a four stage process. The stages in this process are speedometer, measurement, business, marketing, finance.
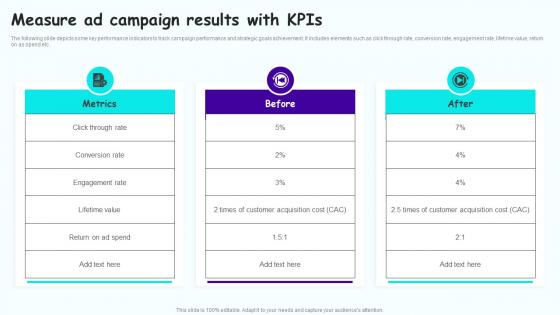
Measure Ad Campaign Results With Leveraging Mobile Marketing Strategies Graphics Pdf
The following slide depicts some key performance indicators to track campaign performance and strategic goals achievement. It includes elements such as click through rate, conversion rate, engagement rate, lifetime value, return on as spend etc. Are you in need of a template that can accommodate all of your creative concepts This one is crafted professionally and can be altered to fit any style. Use it with Google Slides or PowerPoint. Include striking photographs, symbols, depictions, and other visuals. Fill, move around, or remove text boxes as desired. Test out color palettes and font mixtures. Edit and save your work, or work with colleagues. Download Measure Ad Campaign Results With Leveraging Mobile Marketing Strategies Graphics Pdf and observe how to make your presentation outstanding. Give an impeccable presentation to your group and make your presentation unforgettable. The following slide depicts some key performance indicators to track campaign performance and strategic goals achievement. It includes elements such as click through rate, conversion rate, engagement rate, lifetime value, return on as spend etc.
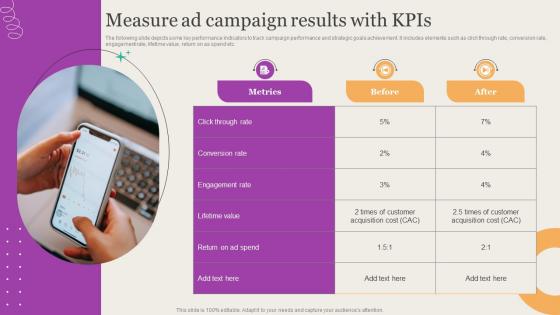
Leveraging Mobile Marketing Strategies Measure Ad Campaign Results With Kpis Topics Pdf
The following slide depicts some key performance indicators to track campaign performance and strategic goals achievement. It includes elements such as click through rate, conversion rate, engagement rate, lifetime value, return on as spend etc. If you are looking for a format to display your unique thoughts, then the professionally designed Leveraging Mobile Marketing Strategies Measure Ad Campaign Results With Kpis Topics Pdf is the one for you. You can use it as a Google Slides template or a PowerPoint template. Incorporate impressive visuals, symbols, images, and other charts. Modify or reorganize the text boxes as you desire. Experiment with shade schemes and font pairings. Alter, share or cooperate with other people on your work. Download Leveraging Mobile Marketing Strategies Measure Ad Campaign Results With Kpis Topics Pdf and find out how to give a successful presentation. Present a perfect display to your team and make your presentation unforgettable. The following slide depicts some key performance indicators to track campaign performance and strategic goals achievement. It includes elements such as click through rate, conversion rate, engagement rate, lifetime value, return on as spend etc.
Mobile Ad Campaign Launch Strategy Measure Ad Campaign Results With KPIs Formats Pdf
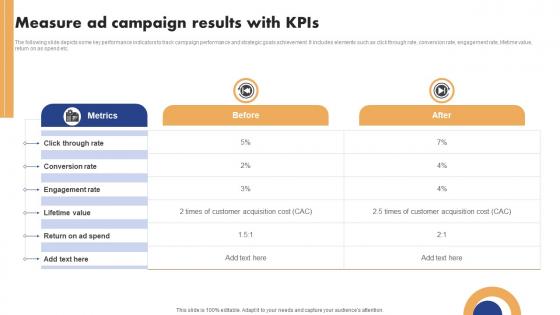
The following slide depicts some key performance indicators to track campaign performance and strategic goals achievement. It includes elements such as click through rate, conversion rate, engagement rate, lifetime value, return on as spend etc. If you are looking for a format to display your unique thoughts, then the professionally designed Mobile Ad Campaign Launch Strategy Measure Ad Campaign Results With KPIs Formats Pdf is the one for you. You can use it as a Google Slides template or a PowerPoint template. Incorporate impressive visuals, symbols, images, and other charts. Modify or reorganize the text boxes as you desire. Experiment with shade schemes and font pairings. Alter, share or cooperate with other people on your work. Download Mobile Ad Campaign Launch Strategy Measure Ad Campaign Results With KPIs Formats Pdf and find out how to give a successful presentation. Present a perfect display to your team and make your presentation unforgettable. The following slide depicts some key performance indicators to track campaign performance and strategic goals achievement. It includes elements such as click through rate, conversion rate, engagement rate, lifetime value, return on as spend etc.
Business Development Team Kpi Matrix To Measure Impact Of Sales Enablement Efforts SA SS V
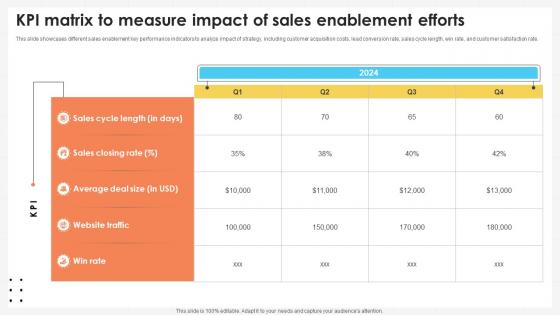
This slide showcases different sales enablement key performance indicators to analyze impact of strategy, including customer acquisition costs, lead conversion rate, sales cycle length, win rate, and customer satisfaction rate. Are you searching for a Business Development Team Kpi Matrix To Measure Impact Of Sales Enablement Efforts SA SS V that is uncluttered, straightforward, and original Its easy to edit, and you can change the colors to suit your personal or business branding. For a presentation that expresses how much effort you have put in, this template is ideal With all of its features, including tables, diagrams, statistics, and lists, its perfect for a business plan presentation. Make your ideas more appealing with these professional slides. Download Business Development Team Kpi Matrix To Measure Impact Of Sales Enablement Efforts SA SS V from Slidegeeks today. This slide showcases different sales enablement key performance indicators to analyze impact of strategy, including customer acquisition costs, lead conversion rate, sales cycle length, win rate, and customer satisfaction rate.
Marketing Growth Strategy To Performance Analysis Of Market Penetration Strategies Strategy SS V
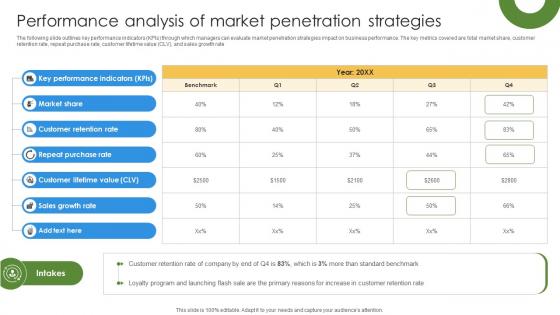
The following slide outlines key performance indicators KPIs through which managers can evaluate market penetration strategies impact on business performance. The key metrics covered are total market share, customer retention rate, repeat purchase rate, customer lifetime value CLV, and sales growth rate. Slidegeeks is here to make your presentations a breeze with Marketing Growth Strategy To Performance Analysis Of Market Penetration Strategies Strategy SS V With our easy-to-use and customizable templates, you can focus on delivering your ideas rather than worrying about formatting. With a variety of designs to choose from, you are sure to find one that suits your needs. And with animations and unique photos, illustrations, and fonts, you can make your presentation pop. So whether you are giving a sales pitch or presenting to the board, make sure to check out Slidegeeks first The following slide outlines key performance indicators KPIs through which managers can evaluate market penetration strategies impact on business performance. The key metrics covered are total market share, customer retention rate, repeat purchase rate, customer lifetime value CLV, and sales growth rate.
Navigating B2B Sales Essential Kpis To Measure B2B Sales Strategy SA SS V
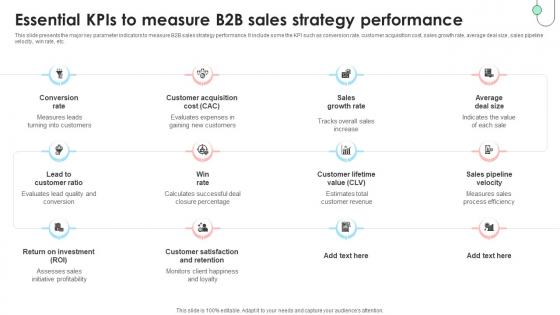
This slide presents the major key parameter indicators to measure B2B sales strategy performance. It include some the KPI such as conversion rate, customer acquisition cost, sales growth rate, average deal size, sales pipeline velocity, win rate, etc. Here you can discover an assortment of the finest PowerPoint and Google Slides templates. With these templates, you can create presentations for a variety of purposes while simultaneously providing your audience with an eye-catching visual experience. Download Navigating B2B Sales Essential Kpis To Measure B2B Sales Strategy SA SS V to deliver an impeccable presentation. These templates will make your job of preparing presentations much quicker, yet still, maintain a high level of quality. Slidegeeks has experienced researchers who prepare these templates and write high-quality content for you. Later on, you can personalize the content by editing the Navigating B2B Sales Essential Kpis To Measure B2B Sales Strategy SA SS V. This slide presents the major key parameter indicators to measure B2B sales strategy performance. It include some the KPI such as conversion rate, customer acquisition cost, sales growth rate, average deal size, sales pipeline velocity, win rate, etc.
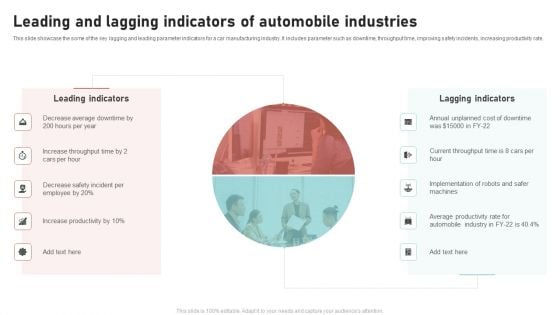
Leading And Lagging Indicators Of Automobile Industries Professional PDF
This slide showcase the some of the key lagging and leading parameter indicators for a car manufacturing industry. It includes parameter such as downtime, throughput time, improving safety incidents, increasing productivity rate. Pitch your topic with ease and precision using this Leading And Lagging Indicators Of Automobile Industries Professional PDF. This layout presents information on Leading Indicators, Lagging Indicators. It is also available for immediate download and adjustment. So, changes can be made in the color, design, graphics or any other component to create a unique layout.
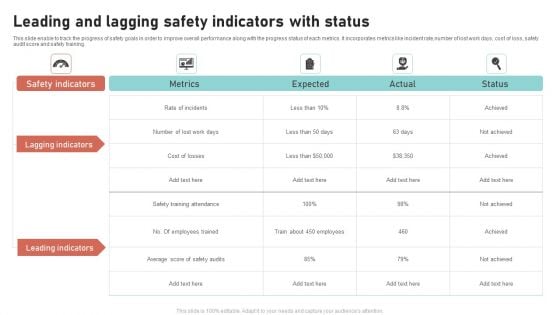
Leading And Lagging Safety Indicators With Status Slides PDF
This slide enable to track the progress of safety goals in order to improve overall performance along with the progress status of each metrics. It incorporates metrics like incident rate,number of lost work days, cost of loss, safety audit score and safety training. Pitch your topic with ease and precision using this Leading And Lagging Safety Indicators With Status Slides PDF. This layout presents information on Safety Indicators, Metrics, Expected, Lagging Indicators. It is also available for immediate download and adjustment. So, changes can be made in the color, design, graphics or any other component to create a unique layout.
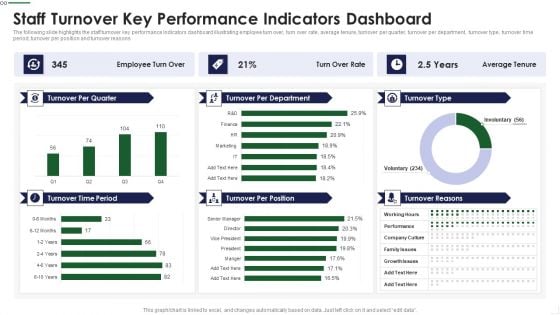
Staff Turnover Key Performance Indicators Dashboard Sample PDF
The following slide highlights the staff turnover key performance Indicators dashboard illustrating employee turn over, turn over rate, average tenure, turnover per quarter, turnover per department, turnover type, turnover time period, turnover per position and turnover reasons Deliver and pitch your topic in the best possible manner with this Staff Turnover Key Performance Indicators Dashboard Sample PDF Use them to share invaluable insights on Management Goals, Subjective Appraisal, Product Defects and impress your audience. This template can be altered and modified as per your expectations. So, grab it now.

Call Center Process Key Performance Indicator Dashboard Mockup PDF
This slide showcases call center process measurements and key performance indicators so managers and teams can keep track of and improve performance . It includes received calls, calculating speed of answering calls , ended calls before starting conversations , average calls per minute etc. Showcasing this set of slides titled Call Center Process Key Performance Indicator Dashboard Mockup PDF. The topics addressed in these templates are Received Calls, Conversation, Abandon Rate. All the content presented in this PPT design is completely editable. Download it and make adjustments in color, background, font etc. as per your unique business setting.
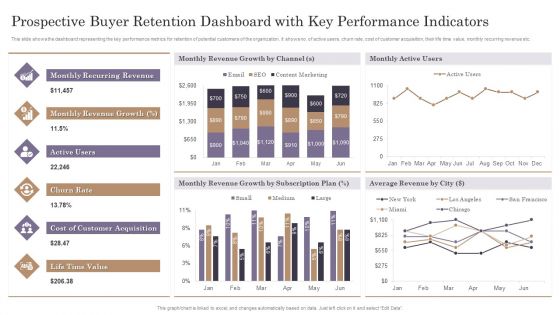
Prospective Buyer Retention Dashboard With Key Performance Indicators Themes PDF
This slide shows the dashboard representing the key performance metrics for retention of potential customers of the organization. It shows no. of active users, churn rate, cost of customer acquisition, their life time value, monthly recurring revenue etc.Pitch your topic with ease and precision using this Prospective Buyer Retention Dashboard With Key Performance Indicators Themes PDF. This layout presents information on Recurring Revenue, Revenue Growth, Customer Acquisition. It is also available for immediate download and adjustment. So, changes can be made in the color, design, graphics or any other component to create a unique layout.
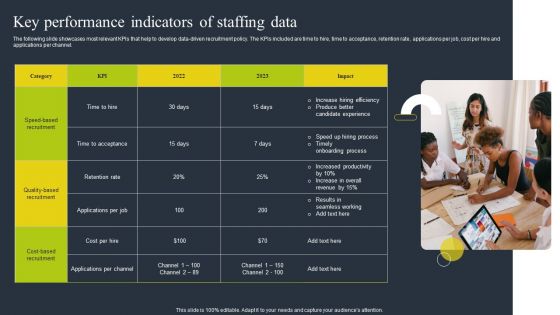
Key Performance Indicators Of Staffing Data Download PDF
The following slide showcases most relevant KPIs that help to develop data driven recruitment policy. The KPIs included are time to hire, time to acceptance, retention rate, applications per job, cost per hire and applications per channel. Persuade your audience using this Key Performance Indicators Of Staffing Data Download PDF. This PPT design covers one stages, thus making it a great tool to use. It also caters to a variety of topics including Quality Based Recruitment, Cost, Applications Per Channel. Download this PPT design now to present a convincing pitch that not only emphasizes the topic but also showcases your presentation skills.
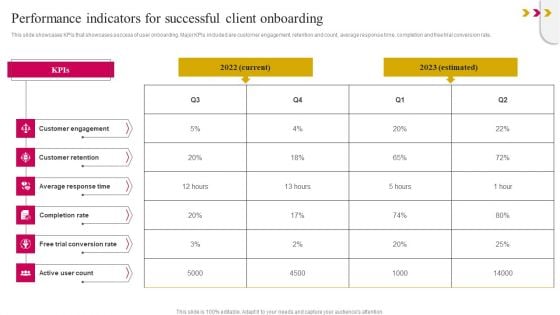
Performance Indicators For Successful Client Onboarding Template PDF
This slide showcases KPIs that showcases success of user onboarding. Major KPIs included are customer engagement, retention and count, average response time, completion and free trial conversion rate. If your project calls for a presentation, then Slidegeeks is your go-to partner because we have professionally designed, easy-to-edit templates that are perfect for any presentation. After downloading, you can easily edit Performance Indicators For Successful Client Onboarding Template PDF and make the changes accordingly. You can rearrange slides or fill them with different images. Check out all the handy templates
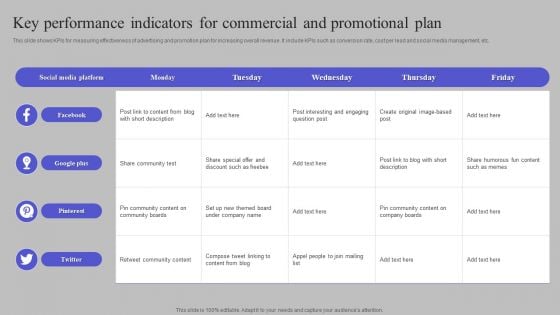
Key Performance Indicators For Commercial And Promotional Plan Information PDF
This slide shows KPIs for measuring effectiveness of advertising and promotion plan for increasing overall revenue. It include KPIs such as conversion rate, cost per lead and social media management, etc. Showcasing this set of slides titled Key Performance Indicators For Commercial And Promotional Plan Information PDF. The topics addressed in these templates are Facebook, Google Plus, Pinterest. All the content presented in this PPT design is completely editable. Download it and make adjustments in color, background, font etc. as per your unique business setting.
Ad Campaign Performance Indicators Tracking Dashboard Diagrams PDF
This slide covers dashboard to measure the performance of ad campaigns on LinkedIn platform. The purpose of this template is to provide the company an overview on the outcomes of running ad campaigns on LinkedIn. It includes performance based on impressions, CTR, engagement rates, CPC, CPM, etc. Find a pre designed and impeccable Ad Campaign Performance Indicators Tracking Dashboard Diagrams PDF. The templates can ace your presentation without additional effort. You can download these easy to edit presentation templates to make your presentation stand out from others. So, what are you waiting for Download the template from Slidegeeks today and give a unique touch to your presentation.

Speedometer Yes I Can Business PowerPoint Template 1110
A speedometer with red needle pointing to Yes I Did It symbolizing self confidence With our Speedometer Yes I Can Business PowerPoint Template 1110 there is no dearth of ideas. They crop up everywhere.

Electric Car Speedometer Travel PowerPoint Templates And PowerPoint Backgrounds 0211
Microsoft PowerPoint Template and Background with speedometer Your thoughts will be engraved in the minds of your audience. Our Electric Car Speedometer Travel PowerPoint Templates And PowerPoint Backgrounds 0211 will etch them in.

Speedometer Shows Danger Travel PowerPoint Templates And PowerPoint Backgrounds 0411
Microsoft PowerPoint Template and Background with danger word on speedometer Our Speedometer Shows Danger Travel PowerPoint Templates And PowerPoint Backgrounds 0411 have a festive effect. The audience will celebrate your ideas.

Speedometer Shows Win Metaphor PowerPoint Templates And PowerPoint Backgrounds 0811
Microsoft PowerPoint Template and Background with a speedometer with red needle speeding to the word win Rise above familiar processes. Explore anew with our Speedometer Shows Win Metaphor PowerPoint Templates And PowerPoint Backgrounds 0811.

Speedometer Shows Danger Travel PowerPoint Themes And PowerPoint Slides 0411
Microsoft PowerPoint Theme and Slide with danger word on speedometer Charge your account with our Speedometer Shows Danger Travel PowerPoint Themes And PowerPoint Slides 0411. Earn the interest of your audience.

Speedometer Shows Win Metaphor PowerPoint Themes And PowerPoint Slides 0811
Microsoft PowerPoint Theme and Slide with a speedometer with red needle speeding to the word win Clear the blocks for your thoughts. Open up the pipeline with our Speedometer Shows Win Metaphor PowerPoint Themes And PowerPoint Slides 0811.

Bike Odometer With Red Pointer Ppt PowerPoint Presentation Pictures Templates PDF
Presenting bike odometer with red pointer ppt powerpoint presentation pictures templates pdf to dispense important information. This template comprises three stages. It also presents valuable insights into the topics including bike odometer with red pointer. This is a completely customizable PowerPoint theme that can be put to use immediately. So, download it and address the topic impactfully.

Odometer Image For Kilometer And Speed Control Ppt PowerPoint Presentation Ideas Deck PDF
Presenting odometer image for kilometer and speed control ppt powerpoint presentation ideas deck pdf to dispense important information. This template comprises two stages. It also presents valuable insights into the topics including odometer image for kilometer, speed control. This is a completely customizable PowerPoint theme that can be put to use immediately. So, download it and address the topic impactfully.
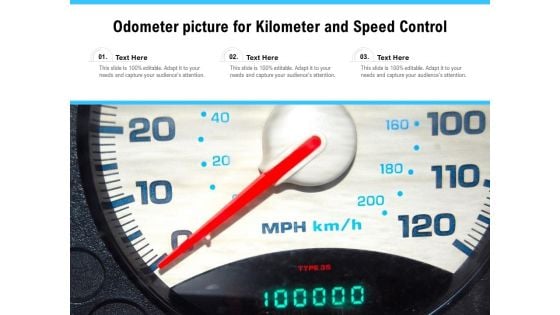
Odometer Picture For Kilometer And Speed Control Ppt PowerPoint Presentation Infographics Graphics PDF
Presenting odometer picture for kilometer and speed control ppt powerpoint presentation infographics graphics pdf to dispense important information. This template comprises three stages. It also presents valuable insights into the topics including odometer picture for kilometer and speed control. This is a completely customizable PowerPoint theme that can be put to use immediately. So, download it and address the topic impactfully.
Odometer Showing Zeros Vector Icon Ppt PowerPoint Presentation Model Graphics Template PDF
Pitch your topic with ease and precision using this odometer showing zeros vector icon ppt powerpoint presentation model graphics template pdf. This layout presents information on odometer showing zeros vector icon. It is also available for immediate download and adjustment. So, changes can be made in the color, design, graphics or any other component to create a unique layout.
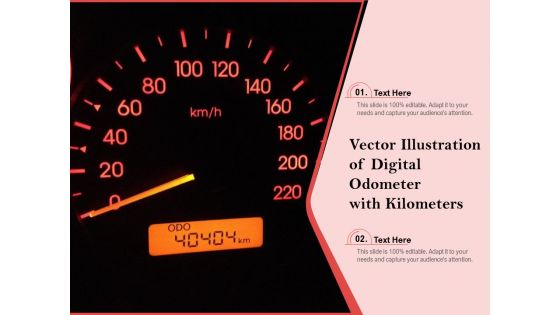
Vector Illustration Of Digital Odometer With Kilometers Ppt PowerPoint Presentation Slides Example PDF
Presenting vector illustration of digital odometer with kilometers ppt powerpoint presentation slides example pdf to dispense important information. This template comprises two stages. It also presents valuable insights into the topics including vector illustration of digital odometer with kilometer. This is a completely customizable PowerPoint theme that can be put to use immediately. So, download it and address the topic impactfully.
Speedometer Vector Icon Ppt Powerpoint Presentation Gallery Objects
This is a speedometer vector icon ppt powerpoint presentation gallery objects. This is a four stage process. The stages in this process are accelerator, seed accelerators, startup accelerator.
Analytics Icon Dashboard Speedometer Ppt PowerPoint Presentation Complete Deck
Presenting this set of slides with name analytics icon dashboard speedometer ppt powerpoint presentation complete deck. The topics discussed in these slides are dashboard, speedometer, key performance, business, automobile. This is a completely editable PowerPoint presentation and is available for immediate download. Download now and impress your audience.
Odometer For Speed Control Vector Icon Ppt PowerPoint Presentation Slides Infographics PDF
Persuade your audience using this odometer for speed control vector icon ppt powerpoint presentation slides infographics pdf. This PPT design covers three stages, thus making it a great tool to use. It also caters to a variety of topics including odometer for speed control vector icon. Download this PPT design now to present a convincing pitch that not only emphasizes the topic but also showcases your presentation skills.
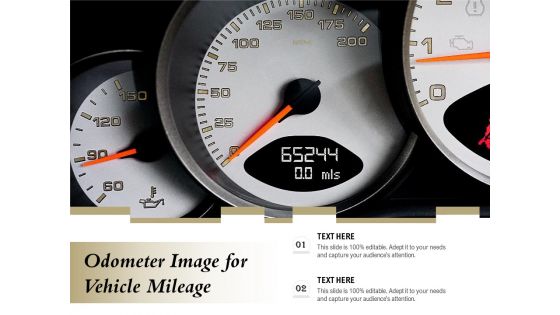
Odometer Image For Vehicle Mileage Ppt PowerPoint Presentation Ideas Guide PDF
Persuade your audience using this odometer image for vehicle mileage ppt powerpoint presentation ideas guide pdf. This PPT design covers two stages, thus making it a great tool to use. It also caters to a variety of topics including odometer image for vehicle mileage. Download this PPT design now to present a convincing pitch that not only emphasizes the topic but also showcases your presentation skills.
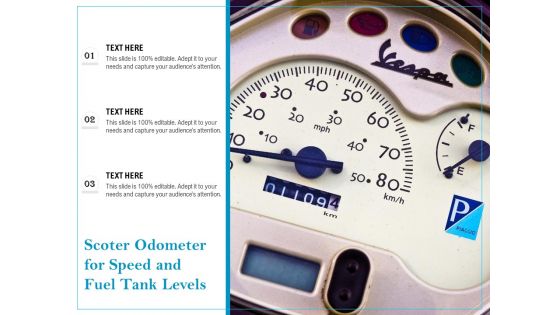
Scoter Odometer For Speed And Fuel Tank Levels Ppt PowerPoint Presentation Outline Mockup PDF
Persuade your audience using this scoter odometer for speed and fuel tank levels ppt powerpoint presentation outline mockup pdf. This PPT design covers three stages, thus making it a great tool to use. It also caters to a variety of topics including scoter odometer, speed and fuel tank levels. Download this PPT design now to present a convincing pitch that not only emphasizes the topic but also showcases your presentation skills.
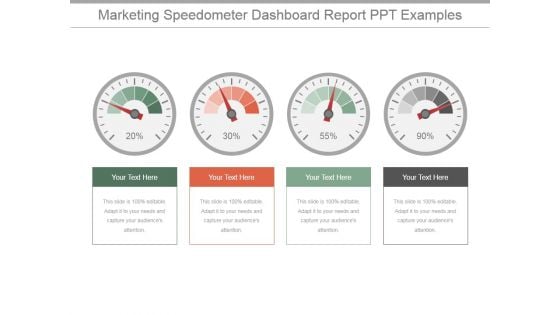
Marketing Speedometer Dashboard Report Ppt PowerPoint Presentation Designs Download
This is a marketing speedometer dashboard report ppt powerpoint presentation designs download. This is a four stage process. The stages in this process are dashboard, measurement, percentage, business, finance.
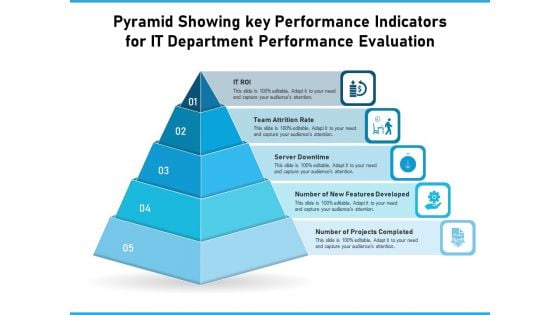
Pyramid Showing Key Performance Indicators For IT Department Performance Evaluation Ppt PowerPoint Presentation Show Graphics Design PDF
Persuade your audience using this pyramid showing key performance indicators for it department performance evaluation ppt powerpoint presentation show graphics design pdf. This PPT design covers five stages, thus making it a great tool to use. It also caters to a variety of topics including it roi, team attrition rate, server downtime, number of new features developed, number of projects completed. Download this PPT design now to present a convincing pitch that not only emphasizes the topic but also showcases your presentation skills.
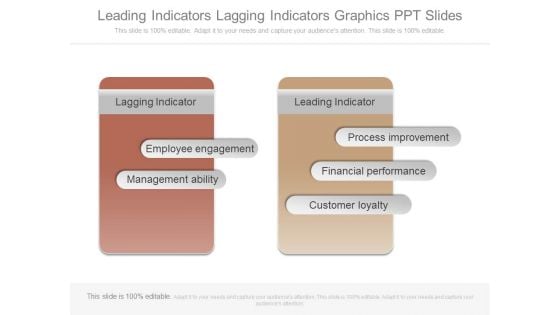
Leading Indicators Lagging Indicators Graphics Ppt Slides
This is a leading indicators lagging indicators graphics ppt slides. This is a two stage process. The stages in this process are lagging indicator, employee engagement, management ability, leading indicator, process improvement, financial performance, customer loyalty.
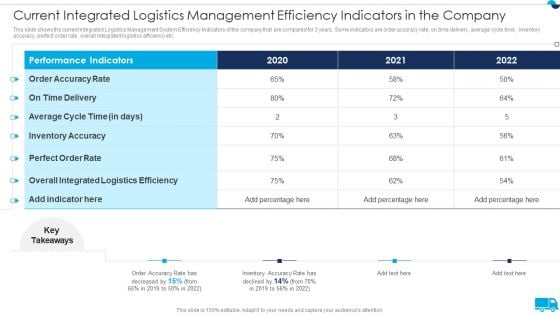
Strategies For Integrated Logistics Management Enhancing Order Efficiency Current Integrated Logistics Introduction PDF
This slide shows the current Integrated Logistics Management System Efficiency Indicators of the company that are compared for 3 years. Some indicators are order accuracy rate, on time delivery, average cycle time , inventory accuracy, perfect order rate, overall integrated logistics efficiency etc. Deliver and pitch your topic in the best possible manner with this Strategies For Integrated Logistics Management Enhancing Order Efficiency Current Integrated Logistics Introduction PDF Use them to share invaluable insights on Performance Indicators, Inventory Accuracy, Overall Integrated and impress your audience. This template can be altered and modified as per your expectations. So, grab it now.
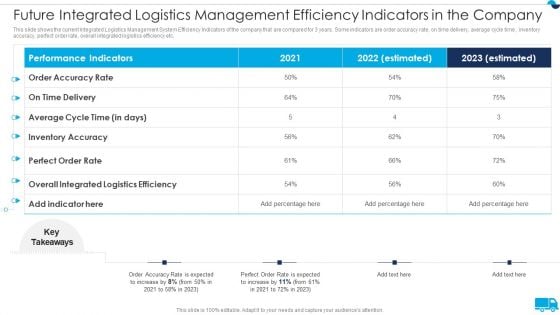
Strategies For Integrated Logistics Management Enhancing Order Efficiency Future Integrated Logistics Microsoft PDF
This slide shows the current Integrated Logistics Management System Efficiency Indicators of the company that are compared for 3 years. Some indicators are order accuracy rate, on time delivery, average cycle time , inventory accuracy, perfect order rate, overall integrated logistics efficiency etc. Deliver an awe inspiring pitch with this creative Strategies For Integrated Logistics Management Enhancing Order Efficiency Future Integrated Logistics Microsoft PDF bundle. Topics like Performance Indicators, Inventory Accuracy, Overall Integrated can be discussed with this completely editable template. It is available for immediate download depending on the needs and requirements of the user.
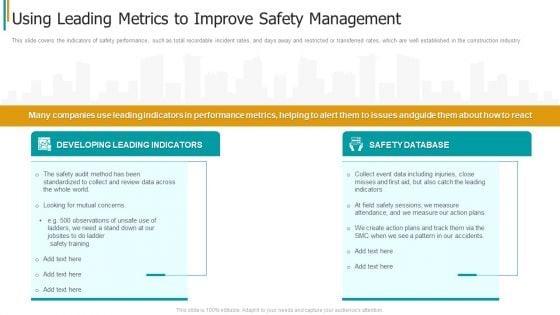
Construction Sector Project Risk Management Using Leading Metrics To Improve Safety Management Sample PDF
This slide covers the indicators of safety performance, such as total recordable incident rates, and days away and restricted or transferred rates, which are well established in the construction industry. This is a construction sector project risk management using leading metrics to improve safety management sample pdf template with various stages. Focus and dispense information on two stages using this creative set, that comes with editable features. It contains large content boxes to add your information on topics like developing leading indicators, safety database. You can also showcase facts, figures, and other relevant content using this PPT layout. Grab it now.
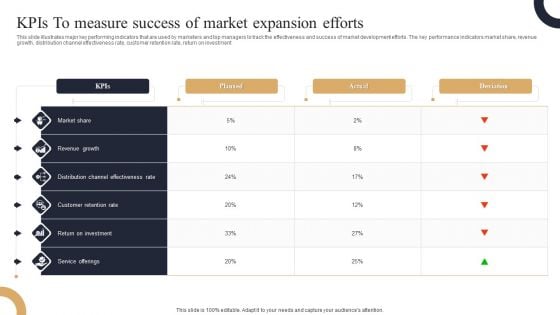
Kpis To Measure Success Of Market Expansion Efforts Portrait PDF
This slide illustrates major key performing indicators that are used by marketers and top managers to track the effectiveness and success of market development efforts. The key performance indicators market share, revenue growth, distribution channel effectiveness rate, customer retention rate, return on investment. Showcasing this set of slides titled Kpis To Measure Success Of Market Expansion Efforts Portrait PDF. The topics addressed in these templates are Revenue Growth, Market Share, Return On Investment. All the content presented in this PPT design is completely editable. Download it and make adjustments in color, background, font etc. as per your unique business setting.

KPI Metrics To Measure Buyer Marketing Success Background PDF
Following slide includes the key performance indicators which can be used to measure the success of shopper marketing campaigns. The key performance indicators are conversion rate, average transaction rate, basket size, stock turn, return on investment etc. Showcasing this set of slides titled KPI Metrics To Measure Buyer Marketing Success Background PDF. The topics addressed in these templates are Performance Attribute, Sales, Inventory. All the content presented in this PPT design is completely editable. Download it and make adjustments in color, background, font etc. as per your unique business setting.
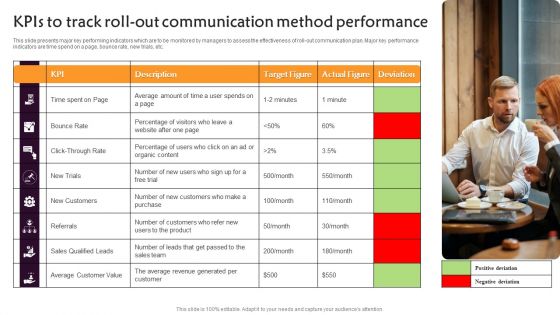
Kpis To Track Roll Out Communication Method Performance Demonstration PDF
This slide presents major key performing indicators which are to be monitored by managers to assess the effectiveness of roll-out communication plan. Major key performance indicators are time spend on a page, bounce rate, new trials, etc. Presenting Kpis To Track Roll Out Communication Method Performance Demonstration PDF to dispense important information. This template comprises one stages. It also presents valuable insights into the topics including Bounce Rate, New Trials, Referrals. This is a completely customizable PowerPoint theme that can be put to use immediately. So, download it and address the topic impactfully.
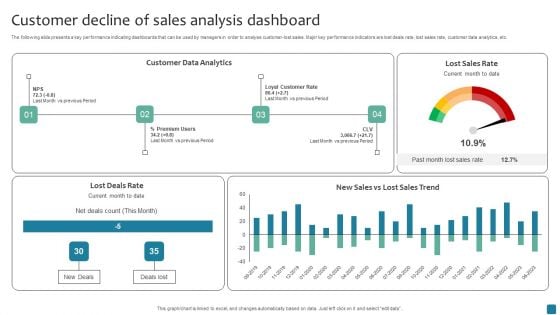
Customer Decline Of Sales Analysis Dashboard Rules PDF
The following slide presents a key performance indicating dashboards that can be used by managers in order to analyse customer-lost sales. Major key performance indicators are lost deals rate, lost sales rate, customer data analytics, etc. Pitch your topic with ease and precision using this Customer Decline Of Sales Analysis Dashboard Rules PDF. This layout presents information on Customer Data Analytics. It is also available for immediate download and adjustment. So, changes can be made in the color, design, graphics or any other component to create a unique layout.
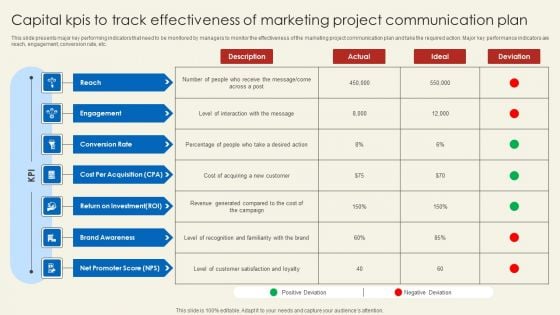
Capital Kpis To Track Effectiveness Of Marketing Project Communication Plan Mockup PDF
This slide presents major key performing indicators that need to be monitored by managers to monitor the effectiveness of the marketing project communication plan and take the required action. Major key performance indicators are reach, engagement, conversion rate, etc.Showcasing this set of slides titled Capital Kpis To Track Effectiveness Of Marketing Project Communication Plan Mockup PDF The topics addressed in these templates are Engagement, Conversion Rate. All the content presented in this PPT design is completely editable. Download it and make adjustments in color, background, font etc. as per your unique business setting.
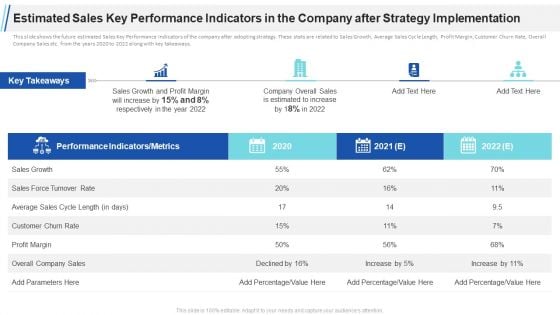
Estimated Sales Key Performance Indicators In The Company After Strategy Implementation Mockup PDF
This slide shows the future estimated Sales Key Performance Indicators of the company after adopting strategy. These stats are related to Sales Growth, Average Sales Cycle Length, Profit Margin, Customer Churn Rate, Overall Company Sales etc. from the years 2020 to 2022 along with key takeaways. Deliver an awe inspiring pitch with this creative estimated sales key performance indicators in the company after strategy implementation mockup pdf bundle. Topics like performance indicators, sales growth, profit margin, overall company sales, 2020 2022 can be discussed with this completely editable template. It is available for immediate download depending on the needs and requirements of the user.
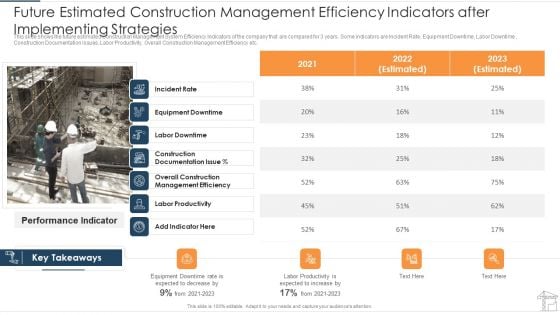
Future Estimated Construction Management Efficiency Indicators After Implementing Strategies Portrait PDF
This slide shows the future estimated Construction Management System Efficiency Indicators of the company that are compared for 3 years. Some indicators are Incident Rate, Equipment Downtime, Labor Downtime , Construction Documentation Issues, Labor Productivity, Overall Construction Management Efficiency etc.Deliver and pitch your topic in the best possible manner with this future estimated construction management efficiency indicators after implementing strategies portrait pdf. Use them to share invaluable insights on equipment downtime, labor downtime, labor productivity and impress your audience. This template can be altered and modified as per your expectations. So, grab it now.


 Continue with Email

 Home
Home


