Rating Meter
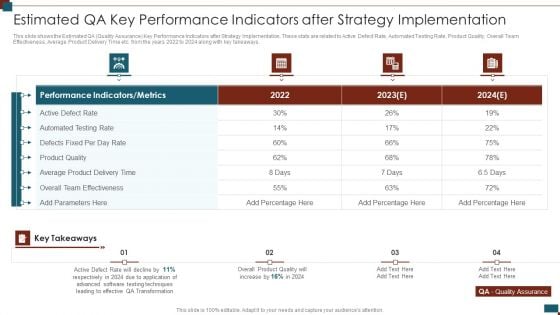
Successful Quality Assurance Transition Techniques To Enhance Product Quality Estimated Qa Key Performance Indicators Slides PDF
This slide shows the Estimated QA Quality Assurance Key Performance Indicators after Strategy Implementation. These stats are related to Active Defect Rate, Automated Testing Rate, Product Quality, Overall Team Effectiveness, Average Product Delivery Time etc. from the years 2022 to 2024 along with key takeaways. Deliver an awe inspiring pitch with this creative successful quality assurance transition techniques to enhance product quality estimated qa key performance indicators slides pdf bundle. Topics like estimated qa key performance indicators after strategy implementation can be discussed with this completely editable template. It is available for immediate download depending on the needs and requirements of the user.

Successful Quality Assurance Transition Techniques To Enhance Product Quality Qa Key Performance Indicators Summary PDF
This slide shows the QA Quality Assurance Key Performance Indicators before Strategy Implementation. These stats are related to Active Defect Rate, Automated Testing Rate, Product Quality, Overall Team Effectiveness, Average Product Delivery Time etc. from the years 2020 to 2022 along with key takeaways. Deliver an awe inspiring pitch with this creative successful quality assurance transition techniques to enhance product quality qa key performance indicators summary pdf bundle. Topics like qa key performance indicators before strategy implementation can be discussed with this completely editable template. It is available for immediate download depending on the needs and requirements of the user.
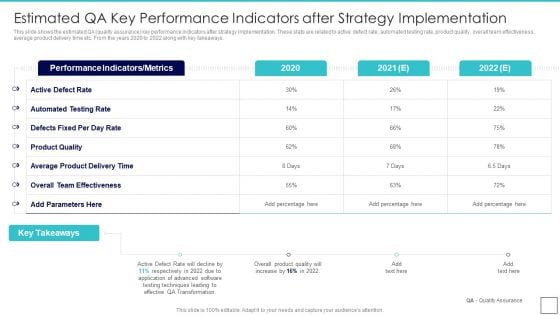
Deploying Quality Assurance QA Transformation Estimated QA Key Performance Indicators Ideas PDF
This slide shows the estimated QA quality assurance key performance indicators after strategy implementation. These stats are related to active defect rate, automated testing rate, product quality, overall team effectiveness, average product delivery time etc. From the years 2020 to 2022 along with key takeaways.Deliver and pitch your topic in the best possible manner with this Deploying Quality Assurance QA Transformation Estimated QA Key Performance Indicators Ideas PDF Use them to share invaluable insights on Performance Indicators, Automated Testing, Overall Team Effectiveness and impress your audience. This template can be altered and modified as per your expectations. So, grab it now.
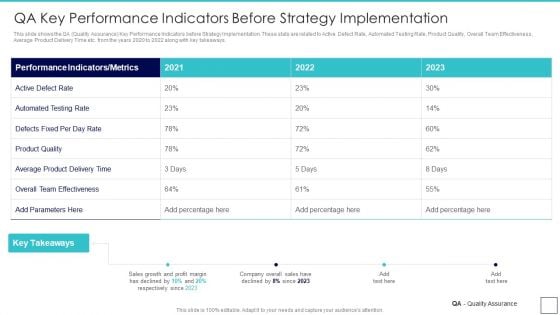
Deploying Quality Assurance QA Transformation QA Key Performance Indicators Before Strategy Graphics PDF
This slide shows the QA Quality Assurance Key Performance Indicators before Strategy Implementation. These stats are related to Active Defect Rate, Automated Testing Rate, Product Quality, Overall Team Effectiveness, Average Product Delivery Time etc. from the years 2020 to 2022 along with key takeaways.Deliver an awe inspiring pitch with this creative Deploying Quality Assurance QA Transformation QA Key Performance Indicators Before Strategy Graphics PDF bundle. Topics like Performance Indicators, Automated Testing, Overall Team Effectiveness can be discussed with this completely editable template. It is available for immediate download depending on the needs and requirements of the user.

Key Performance Indicators For Power Strategy Template Pdf
This slide shows key performance indicators for energy plan. The purpose of this slide is to highlight main key performance indicators that should be considered for performance measurement. It include indicators such as facility wide units and process unit levels, etc.Pitch your topic with ease and precision using this Key Performance Indicators For Power Strategy Template Pdf This layout presents information on Electricity Consumption, Process Measuring, Temperature Steam Systems It is also available for immediate download and adjustment. So, changes can be made in the color, design, graphics or any other component to create a unique layout. This slide shows key performance indicators for energy plan. The purpose of this slide is to highlight main key performance indicators that should be considered for performance measurement. It include indicators such as facility wide units and process unit levels, etc.
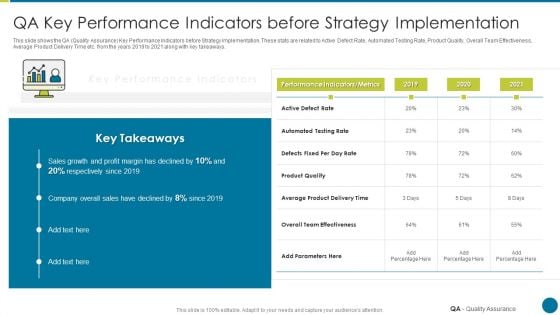
QA Modification For Product Quality Development And Consumer Satisfaction QA Key Performance Indicators Infographics PDF
This slide shows the QA Quality Assurance Key Performance Indicators before Strategy Implementation. These stats are related to Active Defect Rate, Automated Testing Rate, Product Quality, Overall Team Effectiveness, Average Product Delivery Time etc. from the years 2019 to 2021 along with key takeaways. Deliver an awe inspiring pitch with this creative qa modification for product quality development and consumer satisfaction qa key performance indicators infographics pdf bundle. Topics like overall team effectiveness, product quality, performance, product quality can be discussed with this completely editable template. It is available for immediate download depending on the needs and requirements of the user.
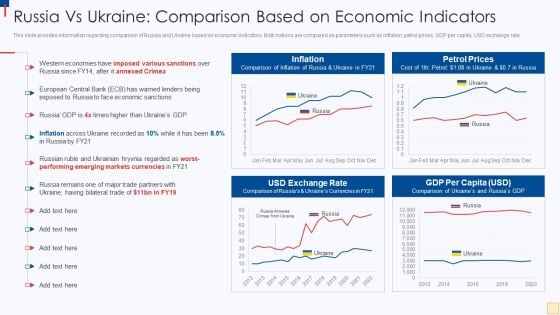
Ukraine Vs Russia Examining Russia Vs Ukraine Comparison Based On Economic Indicators Sample PDF
This slide provides information regarding comparison of Russia and Ukraine based on economic indicators. Both nations are compared on parameters such as inflation, petrol prices, GDP per capita, USD exchange rate. Deliver an awe inspiring pitch with this creative Ukraine Vs Russia Examining Russia Vs Ukraine Comparison Based On Economic Indicators Sample PDF bundle. Topics like Inflation, Petrol Prices, USD Exchange Rate, GDP Per Capita can be discussed with this completely editable template. It is available for immediate download depending on the needs and requirements of the user.
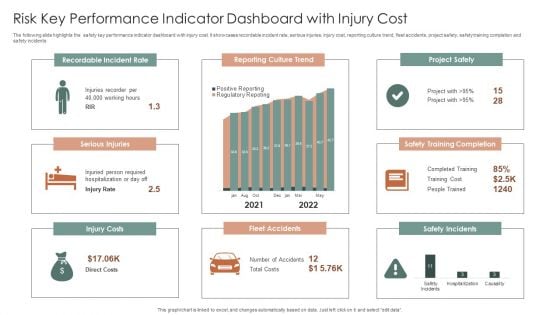
Risk Key Performance Indicator Dashboard With Injury Cost Ppt Summary Brochure PDF
The following slide highlights the safety key performance indicator dashboard with injury cost. It showcases recordable incident rate, serious injuries, injury cost, reporting culture trend, fleet accidents, project safety, safety training completion and safety incidents. Pitch your topic with ease and precision using this Risk Key Performance Indicator Dashboard With Injury Cost Ppt Summary Brochure PDF. This layout presents information on Recordable Incident Rate, Reporting Culture Trend, Project Safety. It is also available for immediate download and adjustment. So, changes can be made in the color, design, graphics or any other component to create a unique layout.
Cybersecurity Key Performance Indicator And Padlock Icon Clipart Pdf
Showcasing this set of slides titled Cybersecurity Key Performance Indicator And Padlock Icon Clipart Pdf The topics addressed in these templates are Cybersecurity Key, Performance Indicator, Padlock Icon All the content presented in this PPT design is completely editable. Download it and make adjustments in color, background, font etc. as per your unique business setting. Our Cybersecurity Key Performance Indicator And Padlock Icon Clipart Pdf are topically designed to provide an attractive backdrop to any subject. Use them to look like a presentation pro.
Human Resource Analytics Key Performance Indicator Icon Elements Pdf
Showcasing this set of slides titled Human Resource Analytics Key Performance Indicator Icon Elements Pdf The topics addressed in these templates are Human Resource, Analytics Key Performance, Indicator Icon All the content presented in this PPT design is completely editable. Download it and make adjustments in color, background, font etc. as per your unique business setting. Our Human Resource Analytics Key Performance Indicator Icon Elements Pdf are topically designed to provide an attractive backdrop to any subject. Use them to look like a presentation pro.
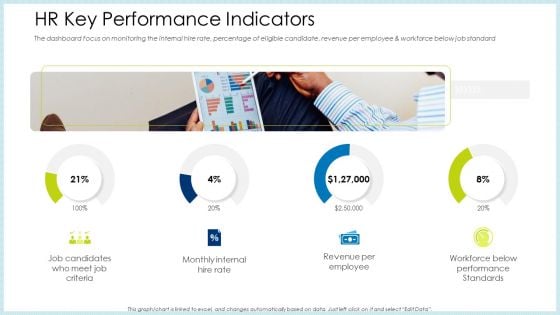
Technology Innovation Human Resource System HR Key Performance Indicators Ppt Styles Designs Download PDF
The dashboard focus on monitoring the internal hire rate, percentage of eligible candidate, revenue per employee and workforce below job standard. Presenting technology innovation human resource system hr key performance indicators ppt styles designs download pdf to provide visual cues and insights. Share and navigate important information on four stages that need your due attention. This template can be used to pitch topics like revenue per employee, performance standards, internal rate. In addition, this PPT design contains high-resolution images, graphics, etc, that are easily editable and available for immediate download.
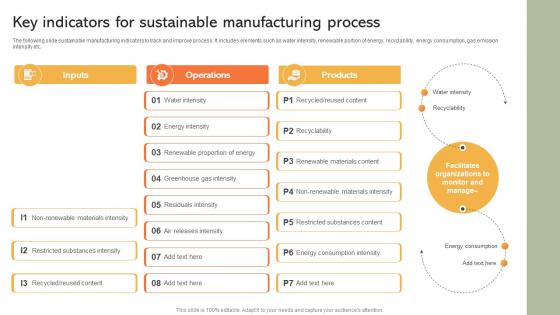
Key Indicators For Sustainable Manufacturing Implementing Manufacturing Strategy SS V
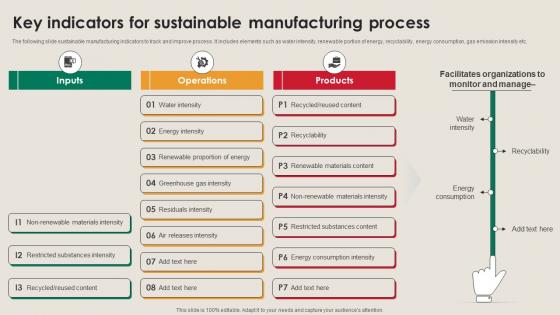
The following slide sustainable manufacturing indicators to track and improve process. It includes elements such as water intensity, renewable portion of energy, recyclability, energy consumption, gas emission intensity etc. Presenting this PowerPoint presentation, titled Key Indicators For Sustainable Manufacturing Implementing Manufacturing Strategy SS V, with topics curated by our researchers after extensive research. This editable presentation is available for immediate download and provides attractive features when used. Download now and captivate your audience. Presenting this Key Indicators For Sustainable Manufacturing Implementing Manufacturing Strategy SS V. Our researchers have carefully researched and created these slides with all aspects taken into consideration. This is a completely customizable Key Indicators For Sustainable Manufacturing Implementing Manufacturing Strategy SS V that is available for immediate downloading. Download now and make an impact on your audience. Highlight the attractive features available with our PPTs. The following slide sustainable manufacturing indicators to track and improve process. It includes elements such as water intensity, renewable portion of energy, recyclability, energy consumption, gas emission intensity etc.
Key Indicators For Sustainable Manufacturing Strategy Driving Industry 4 0
The following slide sustainable manufacturing indicators to track and improve process. It includes elements such as water intensity, renewable portion of energy, recyclability, energy consumption, gas emission intensity etc. Presenting this PowerPoint presentation, titled Key Indicators For Sustainable Manufacturing Strategy Driving Industry 4 0, with topics curated by our researchers after extensive research. This editable presentation is available for immediate download and provides attractive features when used. Download now and captivate your audience. Presenting this Key Indicators For Sustainable Manufacturing Strategy Driving Industry 4 0. Our researchers have carefully researched and created these slides with all aspects taken into consideration. This is a completely customizable Key Indicators For Sustainable Manufacturing Strategy Driving Industry 4 0 that is available for immediate downloading. Download now and make an impact on your audience. Highlight the attractive features available with our PPTs. The following slide sustainable manufacturing indicators to track and improve process. It includes elements such as water intensity, renewable portion of energy, recyclability, energy consumption, gas emission intensity etc.
Indications Liver Transplant In Powerpoint And Google Slides Cpb
Introducing our well designed Indications Liver Transplant In Powerpoint And Google Slides Cpb. This PowerPoint design presents information on topics like Indications Liver Transplant. As it is predesigned it helps boost your confidence level. It also makes you a better presenter because of its high quality content and graphics. This PPT layout can be downloaded and used in different formats like PDF, PNG, and JPG. Not only this, it is available in both Standard Screen and Widescreen aspect ratios for your convenience. Therefore, click on the download button now to persuade and impress your audience. Our Indications Liver Transplant In Powerpoint And Google Slides Cpb are topically designed to provide an attractive backdrop to any subject. Use them to look like a presentation pro.
Addressing Indicators Associated To Insider Cyber Threats Monitoring Digital Assets Themes Pdf
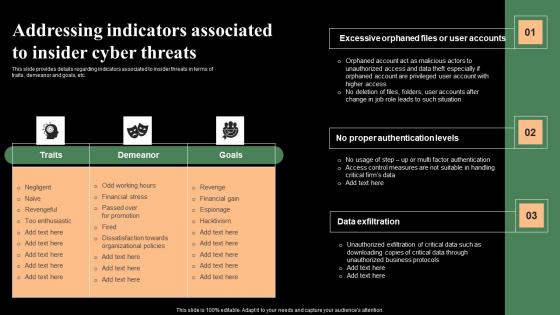
This slide provides details regarding indicators associated to insider threats in terms of traits, demeanor and goals, etc. Presenting this PowerPoint presentation, titled Addressing Indicators Associated To Insider Cyber Threats Monitoring Digital Assets Themes Pdf with topics curated by our researchers after extensive research. This editable presentation is available for immediate download and provides attractive features when used. Download now and captivate your audience. Presenting this Addressing Indicators Associated To Insider Cyber Threats Monitoring Digital Assets Themes Pdf Our researchers have carefully researched and created these slides with all aspects taken into consideration. This is a completely customizable Addressing Indicators Associated To Insider Cyber Threats Monitoring Digital Assets Themes Pdf that is available for immediate downloading. Download now and make an impact on your audience. Highlight the attractive features available with our PPTs. This slide provides details regarding indicators associated to insider threats in terms of traits, demeanor and goals, etc.
Key Economic Indicators To Forecast Inflation Strategies For Inflation A Tactical Guide Fin SS V
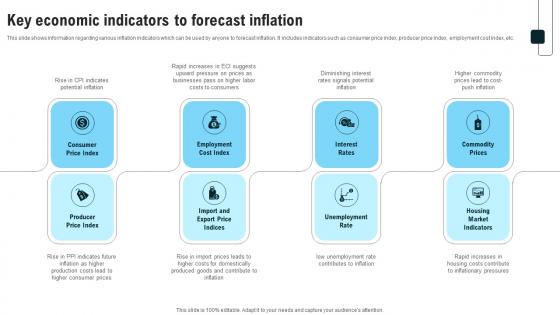
This slide shows information regarding various inflation indicators which can be used by anyone to forecast inflation. It includes indicators such as consumer price index, producer price index, employment cost index, etc. Retrieve professionally designed Key Economic Indicators To Forecast Inflation Strategies For Inflation A Tactical Guide Fin SS V to effectively convey your message and captivate your listeners. Save time by selecting pre-made slideshows that are appropriate for various topics, from business to educational purposes. These themes come in many different styles, from creative to corporate, and all of them are easily adjustable and can be edited quickly. Access them as PowerPoint templates or as Google Slides themes. You do not have to go on a hunt for the perfect presentation because Slidegeeks got you covered from everywhere. This slide shows information regarding various inflation indicators which can be used by anyone to forecast inflation. It includes indicators such as consumer price index, producer price index, employment cost index, etc.
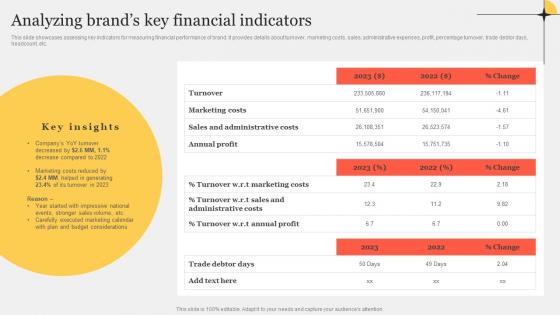
Analyzing Brands Key Financial Indicators Improving Customer Interaction Through Microsoft Pdf
This slide showcases assessing key indicators for measuring financial performance of brand. It provides details about turnover, marketing costs, sales, administrative expenses, profit, percentage turnover, trade debtor days, headcount, etc.Find highly impressive Analyzing Brands Key Financial Indicators Improving Customer Interaction Through Microsoft Pdf on Slidegeeks to deliver a meaningful presentation. You can save an ample amount of time using these presentation templates. No need to worry to prepare everything from scratch because Slidegeeks experts have already done a huge research and work for you. You need to download Analyzing Brands Key Financial Indicators Improving Customer Interaction Through Microsoft Pdf for your upcoming presentation. All the presentation templates are 100Precent editable and you can change the color and personalize the content accordingly. Download now. This slide showcases assessing key indicators for measuring financial performance of brand. It provides details about turnover, marketing costs, sales, administrative expenses, profit, percentage turnover, trade debtor days, headcount, etc.
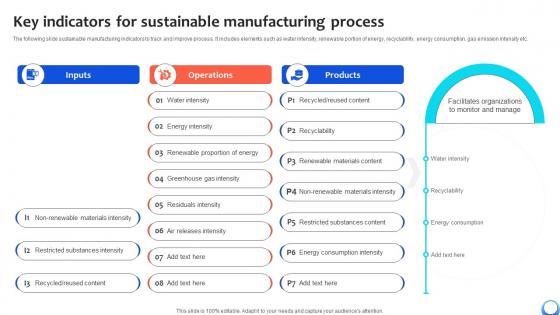
Key Indicators For Sustainable Manufacturing Automating Production Process Strategy SS V
The following slide sustainable manufacturing indicators to track and improve process. It includes elements such as water intensity, renewable portion of energy, recyclability, energy consumption, gas emission intensity etc. Presenting this PowerPoint presentation, titled Key Indicators For Sustainable Manufacturing Automating Production Process Strategy SS V, with topics curated by our researchers after extensive research. This editable presentation is available for immediate download and provides attractive features when used. Download now and captivate your audience. Presenting this Key Indicators For Sustainable Manufacturing Automating Production Process Strategy SS V. Our researchers have carefully researched and created these slides with all aspects taken into consideration. This is a completely customizable Key Indicators For Sustainable Manufacturing Automating Production Process Strategy SS V that is available for immediate downloading. Download now and make an impact on your audience. Highlight the attractive features available with our PPTs. The following slide sustainable manufacturing indicators to track and improve process. It includes elements such as water intensity, renewable portion of energy, recyclability, energy consumption, gas emission intensity etc.
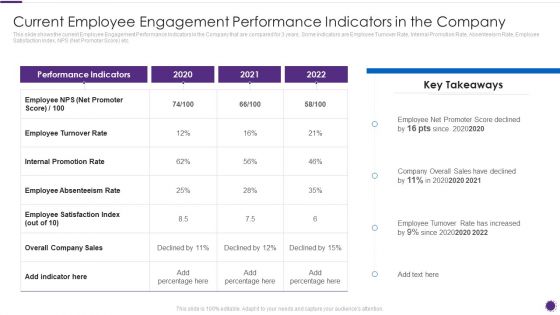
Complete Guide For Total Employee Involvement Strategic Approach Current Employee Engagement Ideas PDF
This slide shows the current Employee Engagement Performance Indicators in the Company that are compared for 3 years. Some indicators are Employee Turnover Rate, Internal Promotion Rate, Absenteeism Rate, Employee Satisfaction Index, NPS Net Promoter Score etc. Deliver and pitch your topic in the best possible manner with this Complete Guide For Total Employee Involvement Strategic Approach Current Employee Engagement Ideas PDF Use them to share invaluable insights on Employee Turnover, Employee Absenteeism, Performance Indicators and impress your audience. This template can be altered and modified as per your expectations. So, grab it now.
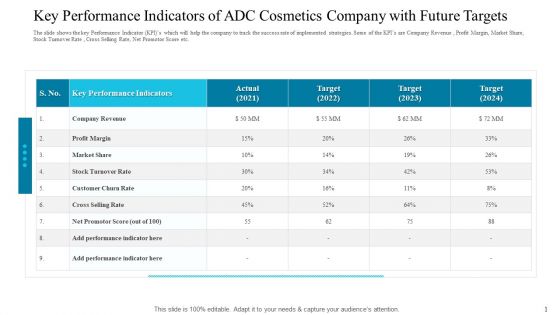
Key Performance Indicators Of ADC Cosmetics Company With Future Targets Structure PDF
Deliver an awe inspiring pitch with this creative key performance indicators of adc cosmetics company with future targets structure pdf bundle. Topics like market share, stock turnover rate, key performance indicators can be discussed with this completely editable template. It is available for immediate download depending on the needs and requirements of the user.
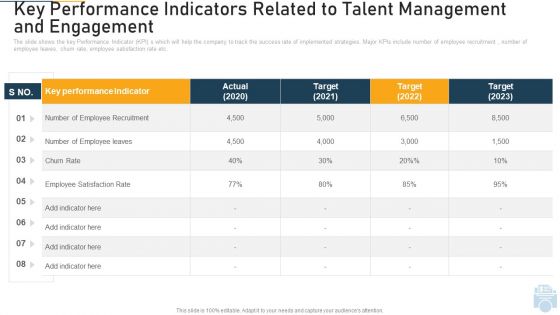
Key Performance Indicators Related To Talent Management And Engagement Ppt Show Outline PDF
Deliver an awe inspiring pitch with this creative key performance indicators related to talent management and engagement ppt show outline pdf bundle. Topics like recruitment, churn rate, key performance indicator, target can be discussed with this completely editable template. It is available for immediate download depending on the needs and requirements of the user.
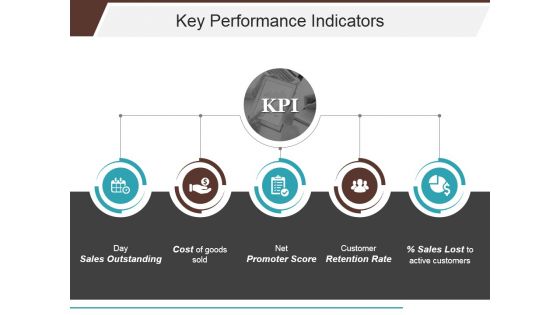
Key Performance Indicators Template 1 Ppt PowerPoint Presentation Portfolio Background Image
This is a key performance indicators template 1 ppt powerpoint presentation portfolio background image. This is a five stage process. The stages in this process are sales outstanding, cost of goods sold, net promoter score, customer retention rate, sales lost to active customers.
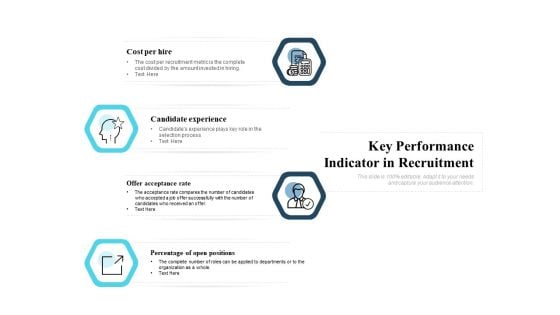
Key Performance Indicator In Recruitment Ppt PowerPoint Presentation Show Graphic Tips
Presenting this set of slides with name key performance indicator in recruitment ppt powerpoint presentation show graphic tips. This is a four stage process. The stages in this process are cost per hire, candidate experience, offer acceptance rate, percentage of open positions. This is a completely editable PowerPoint presentation and is available for immediate download. Download now and impress your audience.
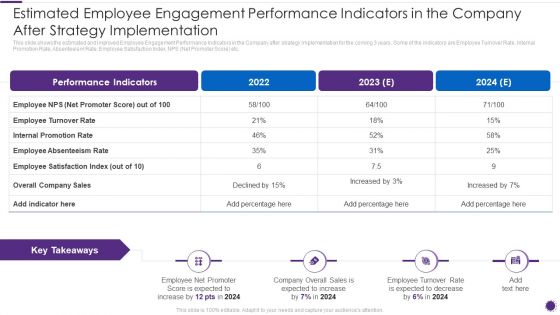
Complete Guide For Total Employee Involvement Strategic Approach Estimated Employee Engagement Pictures PDF
This slide shows the estimated and improved Employee Engagement Performance Indicators in the Company after strategy implementation for the coming 3 years. Some of the indicators are Employee Turnover Rate, Internal Promotion Rate, Absenteeism Rate, Employee Satisfaction Index, NPS Net Promoter Score etc. Deliver an awe inspiring pitch with this creative Complete Guide For Total Employee Involvement Strategic Approach Estimated Employee Engagement Pictures PDF bundle. Topics like Score Expected, Expected Increase, Expected To Decrease can be discussed with this completely editable template. It is available for immediate download depending on the needs and requirements of the user.
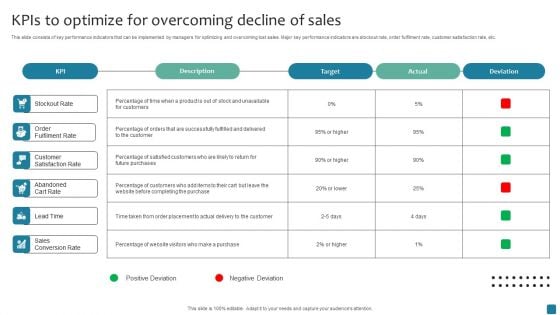
Kpis To Optimize For Overcoming Decline Of Sales Mockup PDF
This slide consists of key performance indicators that can be implemented by managers for optimizing and overcoming lost sales. Major key performance indicators are stockout rate, order fulfilment rate, customer satisfaction rate, etc. Showcasing this set of slides titled Kpis To Optimize For Overcoming Decline Of Sales Mockup PDF. The topics addressed in these templates are Target, Actual, Deviation. All the content presented in this PPT design is completely editable. Download it and make adjustments in color, background, font etc. as per your unique business setting.

HR Framework Dashboard Indicating Kpis Of Employees Introduction PDF
This slide represents human resource HR structure dashboard indicating key performance indicators KPIs of employees. it provides information regarding absenteeism, overtime hours, training costs etc.Pitch your topic with ease and precision using this HR Framework Dashboard Indicating Kpis Of Employees Introduction PDF. This layout presents information on Absenteeism Rate, Costs, Average. It is also available for immediate download and adjustment. So, changes can be made in the color, design, graphics or any other component to create a unique layout.
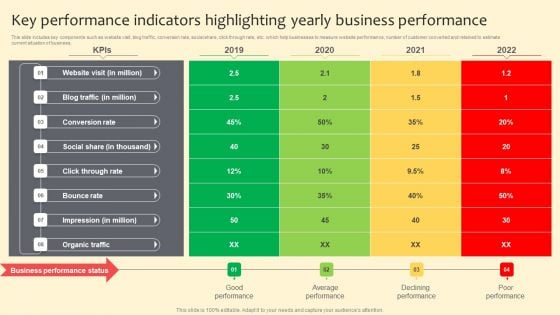
Key Performance Indicators Highlighting Yearly Business Performance Portrait PDF
This slide includes key components such as website visit, blog traffic, conversion rate, social share, click through rate, etc. which help businesses to measure website performance, number of customer converted and retained to estimate current situation of business. Create an editable Key Performance Indicators Highlighting Yearly Business Performance Portrait PDF that communicates your idea and engages your audience. Whether you are presenting a business or an educational presentation, pre designed presentation templates help save time. Key Performance Indicators Highlighting Yearly Business Performance Portrait PDF is highly customizable and very easy to edit, covering many different styles from creative to business presentations. Slidegeeks has creative team members who have crafted amazing templates. So, go and get them without any delay.
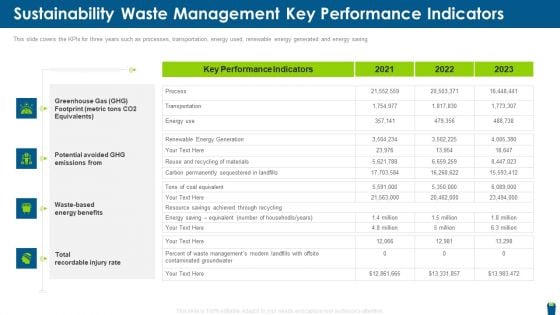
Sustainability Waste Management Key Performance Indicators Summary PDF
This slide covers the KPIs for three years such as processes, transportation, energy used, renewable energy generated and energy saving. Deliver an awe inspiring pitch with this creative sustainability waste management key performance indicators summary pdf bundle. Topics like metric, equivalent, rate, management, performance can be discussed with this completely editable template. It is available for immediate download depending on the needs and requirements of the user.

Key Findings Ppt PowerPoint Presentation Complete Deck With Slides
This is a key findings ppt powerpoint presentation complete deck with slides. This is a one stage process. The stages in this process are key findings, management, planning, business, analysis.

Automotive Tools With Dial Gauge And Gear Knob Ppt PowerPoint Presentation Gallery Background Image PDF
Presenting this set of slides with name automotive tools with dial gauge and gear knob ppt powerpoint presentation gallery background image pdf. The topics discussed in these slide is automotive tools with dial gauge and gear knob. This is a completely editable PowerPoint presentation and is available for immediate download. Download now and impress your audience.
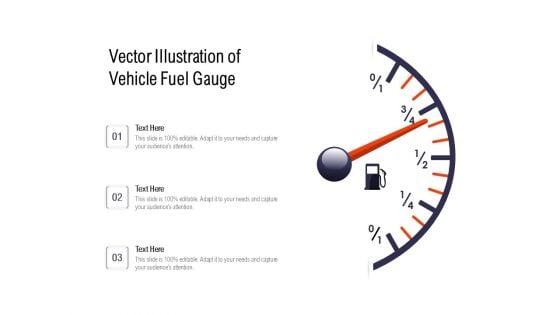
Vector Illustration Of Vehicle Fuel Gauge Ppt PowerPoint Presentation Gallery Introduction PDF
Showcasing this set of slides titled vector illustration of vehicle fuel gauge ppt powerpoint presentation gallery introduction pdf. The topics addressed in these templates are vector illustration of vehicle fuel gauge. All the content presented in this PPT design is completely editable. Download it and make adjustments in color, background, font etc. as per your unique business setting.

Gauge Showing Fuel Level In Vehicle Ppt PowerPoint Presentation Portfolio Picture PDF
Presenting gauge showing fuel level in vehicle ppt powerpoint presentation portfolio picture pdf to dispense important information. This template comprises three stages. It also presents valuable insights into the topics including gauge showing fuel level in vehicle. This is a completely customizable PowerPoint theme that can be put to use immediately. So, download it and address the topic impactfully.
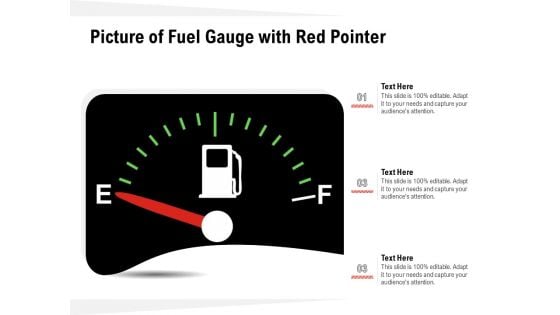
Picture Of Fuel Gauge With Red Pointer Ppt PowerPoint Presentation Show Samples PDF
Presenting picture of fuel gauge with red pointer ppt powerpoint presentation show samples pdf to dispense important information. This template comprises three stages. It also presents valuable insights into the topics including picture of fuel gauge with red pointer. This is a completely customizable PowerPoint theme that can be put to use immediately. So, download it and address the topic impactfully.

Picture Of Vehicle Dashboard With Petrol Gauge Ppt PowerPoint Presentation Portfolio Ideas PDF
Presenting picture of vehicle dashboard with petrol gauge ppt powerpoint presentation portfolio ideas pdf to dispense important information. This template comprises two stages. It also presents valuable insights into the topics including picture of vehicle dashboard with petrol gauge. This is a completely customizable PowerPoint theme that can be put to use immediately. So, download it and address the topic impactfully.
Vector Illustration Of Fuel Gauge Icon Ppt PowerPoint Presentation Layouts Graphics Design PDF
Presenting vector illustration of fuel gauge icon ppt powerpoint presentation layouts graphics design pdf to dispense important information. This template comprises three stages. It also presents valuable insights into the topics including vector illustration of fuel gauge icon. This is a completely customizable PowerPoint theme that can be put to use immediately. So, download it and address the topic impactfully.
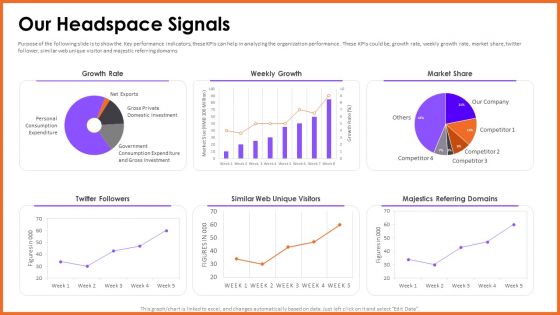
Headspace Fund Raising Pitch Deck Our Headspace Signals Microsoft PDF
Purpose of the following slide is to show the Key performance indicators, these KPIs can help in analyzing the organization performance . These KPIs could be growth rate, weekly growth rate, market share, twitter follower, similar web unique visitor and majestic referring domains.Deliver and pitch your topic in the best possible manner with this Headspace Fund Raising Pitch Deck Our Headspace Signals Microsoft PDF. Use them to share invaluable insights on Growth Rate, Weekly Growth, Referring Domains and impress your audience. This template can be altered and modified as per your expectations. So, grab it now.
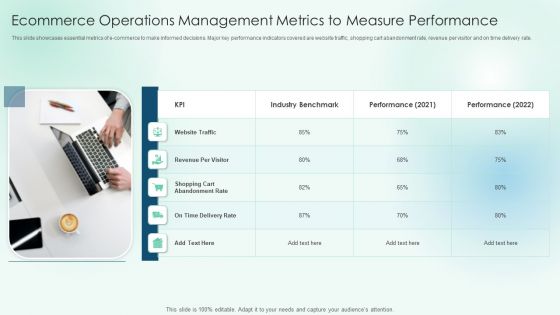
Ecommerce Operations Management Metrics To Measure Performance Professional PDF
This slide showcases essential metrics of e-commerce to make informed decisions. Major key performance indicators covered are website traffic, shopping cart abandonment rate, revenue per visitor and on time delivery rate. Presenting Ecommerce Operations Management Metrics To Measure Performance Professional PDF to dispense important information. This template comprises one stage. It also presents valuable insights into the topics including Abandonment Rate, Industry Benchmark, Performance. This is a completely customizable PowerPoint theme that can be put to use immediately. So, download it and address the topic impactfully.
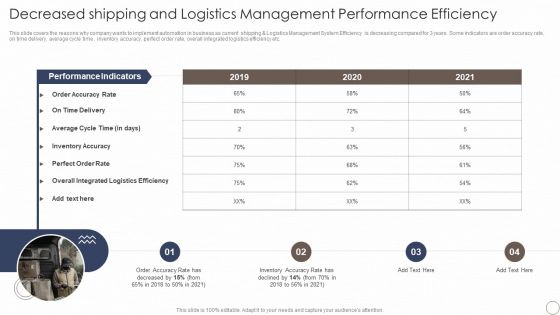
Decreased Shipping And Logistics Management Performance Efficiency Slides PDF
This slide covers the reasons why company wants to implement automation in business as current shipping and Logistics Management System Efficiency is decreasing compared for 3 years. Some indicators are order accuracy rate, on time delivery, average cycle time , inventory accuracy, perfect order rate, overall integrated logistics efficiency etc. Deliver an awe inspiring pitch with this creative Decreased Shipping And Logistics Management Performance Efficiency Slides PDF bundle. Topics like Accuracy Rate, Inventory, Average can be discussed with this completely editable template. It is available for immediate download depending on the needs and requirements of the user.
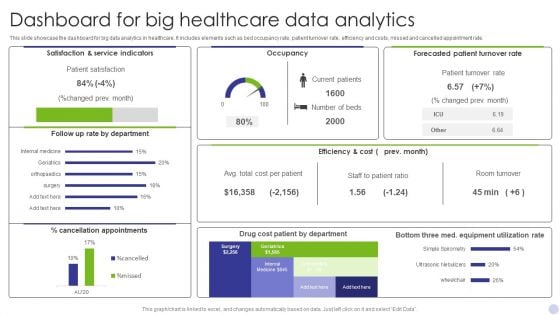
Dashboard For Big Healthcare Data Analytics Graphics PDF
This slide showcase the dashboard for big data analytics in healthcare. It includes elements such as bed occupancy rate, patient turnover rate, efficiency and costs, missed and cancelled appointment rate. Showcasing this set of slides titled Dashboard For Big Healthcare Data Analytics Graphics PDF. The topics addressed in these templates are Satisfaction Service Indicators, Occupancy, Forecasted Patient Turnover. All the content presented in this PPT design is completely editable. Download it and make adjustments in color, background, font etc. as per your unique business setting.

Retail Apparel Online Track Metrics To Analyze Social Media Engagement Professional PDF
This slide showcases key indicators to track and analyze social media engagement. The metrics covered are reach, impressions, audience growth rate, click-through and average engagement rate, share of voice and conversion rate. Want to ace your presentation in front of a live audience Our Retail Apparel Online Track Metrics To Analyze Social Media Engagement Professional PDF can help you do that by engaging all the users towards you. Slidegeeks experts have put their efforts and expertise into creating these impeccable powerpoint presentations so that you can communicate your ideas clearly. Moreover, all the templates are customizable, and easy-to-edit and downloadable. Use these for both personal and commercial use.
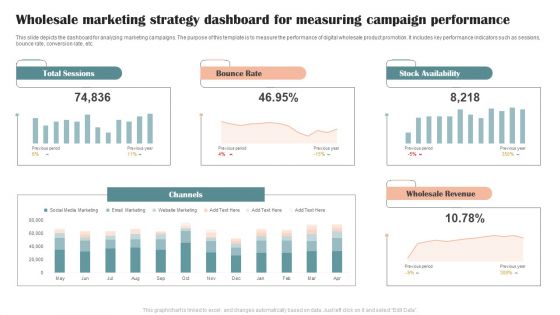
Wholesale Marketing Strategy Dashboard For Measuring Campaign Performance Graphics PDF
This slide depicts the dashboard for analyzing marketing campaigns. The purpose of this template is to measure the performance of digital wholesale product promotion. It includes key performance indicators such as sessions, bounce rate, conversion rate, etc. Showcasing this set of slides titled Wholesale Marketing Strategy Dashboard For Measuring Campaign Performance Graphics PDF. The topics addressed in these templates are Total Sessions, Bounce Rate, Stock Availability. All the content presented in this PPT design is completely editable. Download it and make adjustments in color, background, font etc. as per your unique business setting.
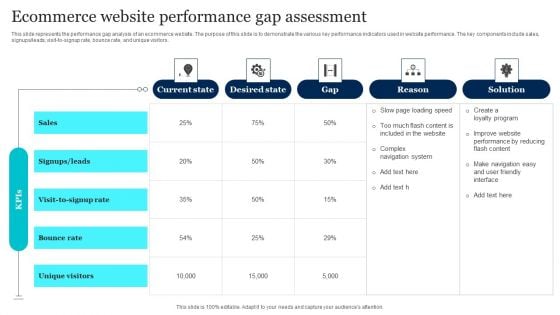
Ecommerce Website Performance Gap Assessment Information PDF
This slide represents the performance gap analysis of an ecommerce website. The purpose of this slide is to demonstrate the various key performance indicators used in website performance. The key components include sales, signups or leads, visit to signup rate, bounce rate, and unique visitors. Pitch your topic with ease and precision using this Ecommerce Website Performance Gap Assessment Information PDF. This layout presents information on Navigation System, Performance, Bounce Rate. It is also available for immediate download and adjustment. So, changes can be made in the color, design, graphics or any other component to create a unique layout.
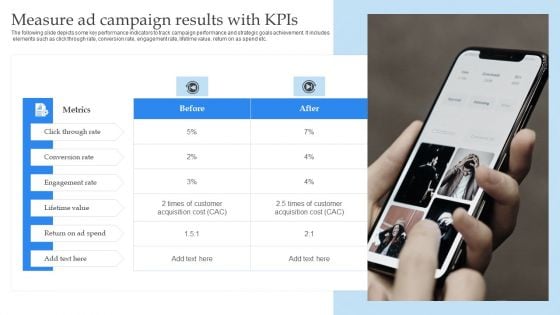
Mobile Promotion Strategic Guide For Micro Businesses Measure Ad Campaign Results With Kpis Sample PDF
The following slide depicts some key performance indicators to track campaign performance and strategic goals achievement. It includes elements such as click through rate, conversion rate, engagement rate, lifetime value, return on as spend etc. From laying roadmaps to briefing everything in detail, our templates are perfect for you. You can set the stage with your presentation slides. All you have to do is download these easy to edit and customizable templates. Mobile Promotion Strategic Guide For Micro Businesses Measure Ad Campaign Results With Kpis Sample PDF will help you deliver an outstanding performance that everyone would remember and praise you for. Do download this presentation today.

Track Metrics To Analyze Social Media Engagement Download PDF
This slide showcases key indicators to track and analyze social media engagement. The metrics covered are reach, impressions, audience growth rate, click-through and average engagement rate, share of voice and conversion rate. If your project calls for a presentation, then Slidegeeks is your go to partner because we have professionally designed, easy to edit templates that are perfect for any presentation. After downloading, you can easily edit Track Metrics To Analyze Social Media Engagement Download PDF and make the changes accordingly. You can rearrange slides or fill them with different images. Check out all the handy templates.
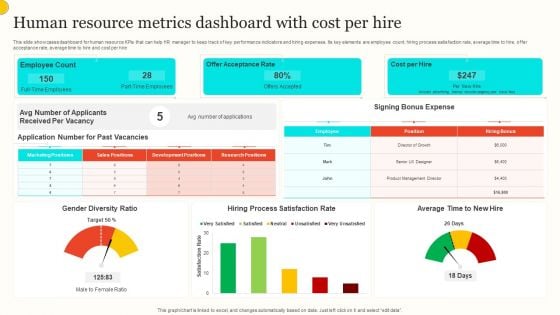
Human Resource Metrics Dashboard With Cost Per Hire Portrait PDF
This slide showcases dashboard for human resource KPIs that can help HR manager to keep track of key performance indicators and hiring expenses. Its key elements are employee count, hiring process satisfaction rate, average time to hire, offer acceptance rate, average time to hire and cost per hire. Showcasing this set of slides titled Human Resource Metrics Dashboard With Cost Per Hire Portrait PDF. The topics addressed in these templates are Employee Count, Offer Acceptance Rate, Cost Per Hire. All the content presented in this PPT design is completely editable. Download it and make adjustments in color, background, font etc. as per your unique business setting.
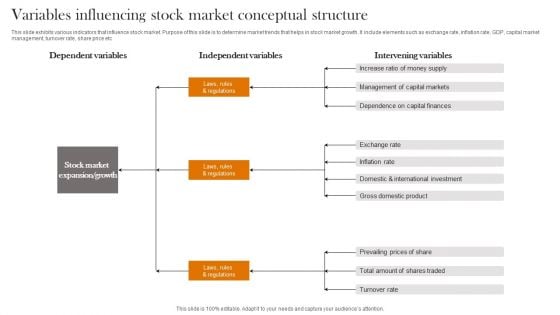
Variables Influencing Stock Market Conceptual Structure Summary PDF
This slide exhibits various indicators that influence stock market. Purpose of this slide is to determine market trends that helps in stock market growth. It include elements such as exchange rate, inflation rate, GDP, capital market management, turnover rate, share price etc. Presenting Variables Influencing Stock Market Conceptual Structure Summary PDF to dispense important information. This template comprises four stages. It also presents valuable insights into the topics including Dependent Variables, Independent Variables, Intervening Variables. This is a completely customizable PowerPoint theme that can be put to use immediately. So, download it and address the topic impactfully.
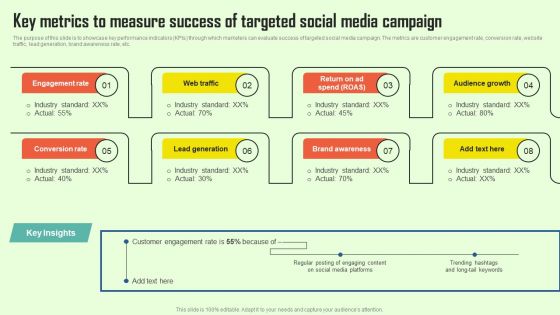
Increasing Consumer Engagement With Database Key Metrics To Measure Success Of Targeted Guidelines PDF
The purpose of this slide is to showcase key performance indicators KPIs through which marketers can evaluate success of targeted social media campaign. The metrics are customer engagement rate, conversion rate, website traffic, lead generation, brand awareness rate, etc. There are so many reasons you need a Increasing Consumer Engagement With Database Key Metrics To Measure Success Of Targeted Guidelines PDF. The first reason is you cannot spend time making everything from scratch, Thus, Slidegeeks has made presentation templates for you too. You can easily download these templates from our website easily.
Performance Gauge For Assessing Business Reliability On Technology Ppt PowerPoint Presentation Gallery Pictures PDF
Persuade your audience using this performance gauge for assessing business reliability on technology ppt powerpoint presentation gallery pictures pdf. This PPT design covers three stages, thus making it a great tool to use. It also caters to a variety of topics including performance gauge for assessing business reliability on technology. Download this PPT design now to present a convincing pitch that not only emphasizes the topic but also showcases your presentation skills.
Self Performance Assessment Gauge Vector Icon Ppt PowerPoint Presentation Gallery Slide PDF
Persuade your audience using this self performance assessment gauge vector icon ppt powerpoint presentation gallery slide pdf. This PPT design covers three stages, thus making it a great tool to use. It also caters to a variety of topics including self performance assessment gauge vector icon. Download this PPT design now to present a convincing pitch that not only emphasizes the topic but also showcases your presentation skills.

Picture Of Fuel Gauge With Pointing Level Ppt PowerPoint Presentation Infographic Template Graphics PDF
Persuade your audience using this picture of fuel gauge with pointing level ppt powerpoint presentation infographic template graphics pdf. This PPT design covers two stages, thus making it a great tool to use. It also caters to a variety of topics including picture of fuel gauge with pointing level. Download this PPT design now to present a convincing pitch that not only emphasizes the topic but also showcases your presentation skills.
Picture Of Scooter Dashboard With Fuel Gauge Ppt PowerPoint Presentation File Icon PDF
Persuade your audience using this picture of scooter dashboard with fuel gauge ppt powerpoint presentation file icon pdf. This PPT design covers four stages, thus making it a great tool to use. It also caters to a variety of topics including picture of scooter dashboard with fuel gauge. Download this PPT design now to present a convincing pitch that not only emphasizes the topic but also showcases your presentation skills.
Software Integration WBS System Integration Template Gauge Ppt PowerPoint Presentation Icon Clipart PDF
This is a software integration wbs system integration template gauge ppt powerpoint presentation icon clipart pdf template with various stages. Focus and dispense information on five stages using this creative set, that comes with editable features. It contains large content boxes to add your information on topics like gauge your readiness, understand business context, create a governance system, identify supporting applications, identify required infrastructure. You can also showcase facts, figures, and other relevant content using this PPT layout. Grab it now.
Time Gauge For Work In Progress Vector Icon Ppt Professional Graphic Tips PDF
Persuade your audience using this time gauge for work in progress vector icon ppt professional graphic tips pdf. This PPT design covers three stages, thus making it a great tool to use. It also caters to a variety of topics including time gauge for work in progress vector icon. Download this PPT design now to present a convincing pitch that not only emphasizes the topic but also showcases your presentation skills.
Competitive Intelligence Guide To Determine Market Online Tracking To Optimize Website Ideas Pdf
The following slide provides overview of performance indicators for online tracking to manage and optimize user behavior on website. It highlights metrics such as web conversions, users, top landing pages, bounce rate, conversion rate, page, sessions and goals value. Make sure to capture your audiences attention in your business displays with our gratis customizable Competitive Intelligence Guide To Determine Market Online Tracking To Optimize Website Ideas Pdf. These are great for business strategies, office conferences, capital raising or task suggestions. If you desire to acquire more customers for your tech business and ensure they stay satisfied, create your own sales presentation with these plain slides. The following slide provides overview of performance indicators for online tracking to manage and optimize user behavior on website. It highlights metrics such as web conversions, users, top landing pages, bounce rate, conversion rate, page, sessions and goals value.
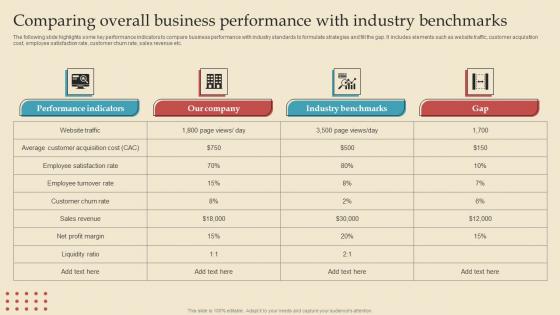
Comparing Overall Benchmarks Describing Business Performance Administration Goals Brochure Pdf
The following slide highlights some key performance indicators to compare business performance with industry standards to formulate strategies and fill the gap. It includes elements such as website traffic, customer acquisition cost, employee satisfaction rate, customer churn rate, sales revenue etc. The Comparing Overall Benchmarks Describing Business Performance Administration Goals Brochure Pdf is a compilation of the most recent design trends as a series of slides. It is suitable for any subject or industry presentation, containing attractive visuals and photo spots for businesses to clearly express their messages. This template contains a variety of slides for the user to input data, such as structures to contrast two elements, bullet points, and slides for written information. Slidegeeks is prepared to create an impression. The following slide highlights some key performance indicators to compare business performance with industry standards to formulate strategies and fill the gap. It includes elements such as website traffic, customer acquisition cost, employee satisfaction rate, customer churn rate, sales revenue etc.
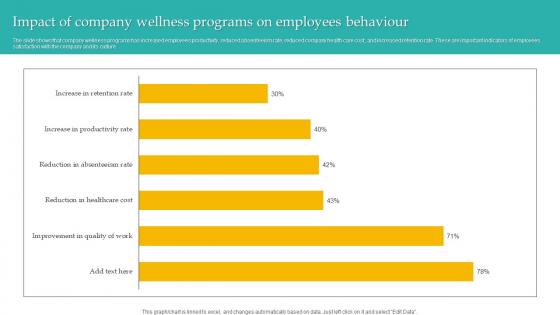
Impact Of Company Wellness Administering Diversity And Inclusion At Workplace Slides Pdf
The slide shows that company wellness programs has increased employees productivity, reduced absenteeism rate, reduced company health care cost, and increased retention rate. These are important indicators of employees satisfaction with the company and its culture. This modern and well arranged Impact Of Company Wellness Administering Diversity And Inclusion At Workplace Slides Pdf provides lots of creative possibilities. It is very simple to customize and edit with the Powerpoint Software. Just drag and drop your pictures into the shapes. All facets of this template can be edited with Powerpoint, no extra software is necessary. Add your own material, put your images in the places assigned for them, adjust the colors, and then you can show your slides to the world, with an animated slide included. The slide shows that company wellness programs has increased employees productivity, reduced absenteeism rate, reduced company health care cost, and increased retention rate. These are important indicators of employees satisfaction with the company and its culture.
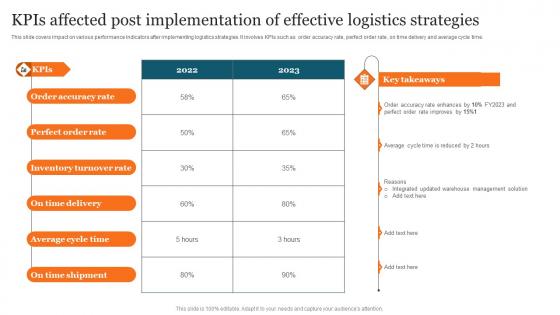
KPIs Affected Post Implementation Advanced Supply Chain Improvement Strategies Rules Pdf
This slide covers impact on various performance indicators after implementing logistics strategies. It involves KPIs such as order accuracy rate, perfect order rate, on time delivery and average cycle time. Are you in need of a template that can accommodate all of your creative concepts This one is crafted professionally and can be altered to fit any style. Use it with Google Slides or PowerPoint. Include striking photographs, symbols, depictions, and other visuals. Fill, move around, or remove text boxes as desired. Test out color palettes and font mixtures. Edit and save your work, or work with colleagues. Download KPIs Affected Post Implementation Advanced Supply Chain Improvement Strategies Rules Pdf and observe how to make your presentation outstanding. Give an impeccable presentation to your group and make your presentation unforgettable. This slide covers impact on various performance indicators after implementing logistics strategies. It involves KPIs such as order accuracy rate, perfect order rate, on time delivery and average cycle time.
Web Consulting Business Various Kpis For Tracking Business Performance
Mentioned slide provide insights into various key performance indicators to determine business performance. It includes KPIs such as business financials, website traffic, customer case, customer engagement, conversion rate, customer retention, customer bounce rate, employee turnover, etc. This modern and well-arranged Web Consulting Business Various Kpis For Tracking Business Performance provides lots of creative possibilities. It is very simple to customize and edit with the Powerpoint Software. Just drag and drop your pictures into the shapes. All facets of this template can be edited with Powerpoint, no extra software is necessary. Add your own material, put your images in the places assigned for them, adjust the colors, and then you can show your slides to the world, with an animated slide included. Mentioned slide provide insights into various key performance indicators to determine business performance. It includes KPIs such as business financials, website traffic, customer case, customer engagement, conversion rate, customer retention, customer bounce rate, employee turnover, etc.

Comparing Overall Business Performance Objectives And Key Result Methodology For Business
The following slide highlights some key performance indicators to compare business performance with industry standards to formulate strategies and fill the gap. It includes elements such as website traffic, customer acquisition cost, employee satisfaction rate, customer churn rate, sales revenue etc. From laying roadmaps to briefing everything in detail, our templates are perfect for you. You can set the stage with your presentation slides. All you have to do is download these easy-to-edit and customizable templates. Comparing Overall Business Performance Objectives And Key Result Methodology For Business will help you deliver an outstanding performance that everyone would remember and praise you for. Do download this presentation today. The following slide highlights some key performance indicators to compare business performance with industry standards to formulate strategies and fill the gap. It includes elements such as website traffic, customer acquisition cost, employee satisfaction rate, customer churn rate, sales revenue etc.
Managing Technical And Non Various Kpis For Tracking Business Performance
Mentioned slide provide insights into various key performance indicators to determine business performance. It includes KPIs such as business financials, website traffic, customer case, customer engagement, conversion rate, customer retention, customer bounce rate, employee turnover, etc. Make sure to capture your audiences attention in your business displays with our gratis customizable Managing Technical And Non Various Kpis For Tracking Business Performance. These are great for business strategies, office conferences, capital raising or task suggestions. If you desire to acquire more customers for your tech business and ensure they stay satisfied, create your own sales presentation with these plain slides. Mentioned slide provide insights into various key performance indicators to determine business performance. It includes KPIs such as business financials, website traffic, customer case, customer engagement, conversion rate, customer retention, customer bounce rate, employee turnover, etc.


 Continue with Email

 Home
Home


