Rating Meter

Three Dashboard For Financial Reporting Ppt Summary
This is a three dashboard for financial reporting ppt summary. This is a three stage process. The stages in this process are business, marketing, speed, dashboard, meter.

Customer Service Team Review Dashboard Powerpoint Slide Rules
This is a customer service team review dashboard powerpoint slide rules. This is a four stage process. The stages in this process are dashboard, meter, financials, speed, measure.
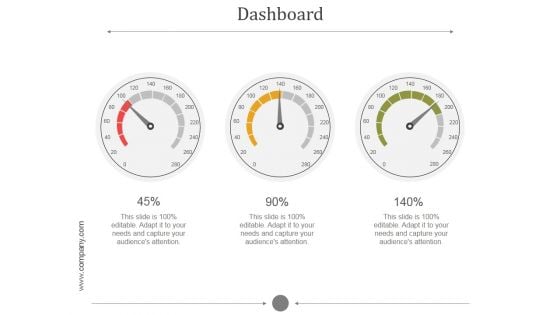
Dashboard Ppt PowerPoint Presentation Show
This is a dashboard ppt powerpoint presentation show. This is a three stage process. The stages in this process are speed, meter, measure, needle, calculate.
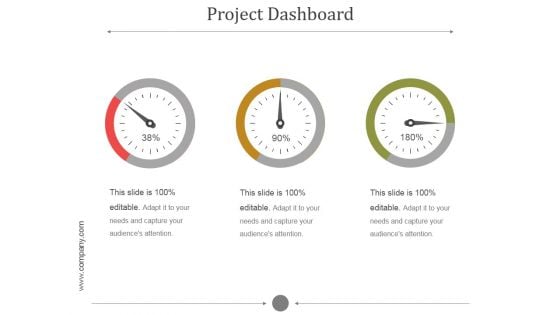
Project Dashboard Ppt PowerPoint Presentation Clipart
This is a project dashboard ppt powerpoint presentation clipart. This is a three stage process. The stages in this process are speed, meter, measure, needle, calculate.
Dashboard Ppt PowerPoint Presentation Microsoft
This is a dashboard ppt powerpoint presentation microsoft. This is a three stage process. The stages in this process are dashboard, business, marketing, speed, meter.
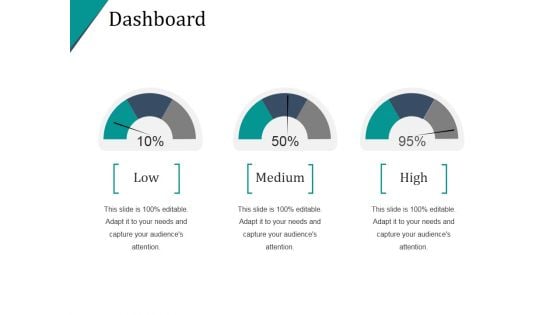
Dashboard Ppt PowerPoint Presentation Images
This is a dashboard ppt powerpoint presentation images. This is a one stage process. The stages in this process are dashboard, meter, speed, measure, business.
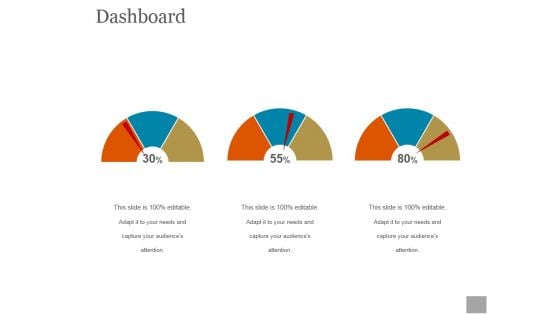
Dashboard Ppt PowerPoint Presentation Styles
This is a dashboard ppt powerpoint presentation styles. This is a three stage process. The stages in this process are dashboard, business, marketing, meter, speed.
Dashboard Ppt PowerPoint Presentation Outline Icon
This is a dashboard ppt powerpoint presentation outline icon. This is a three stage process. The stages in this process are speed, meter, business, marketing, equipment.
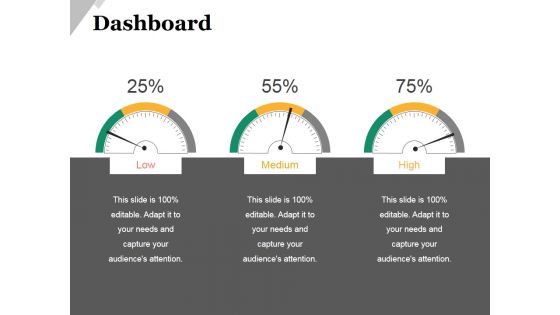
Dashboard Ppt PowerPoint Presentation Layouts Elements
This is a dashboard ppt powerpoint presentation layouts elements. This is a three stage process. The stages in this process are speed, meter, business, marketing, equipment.
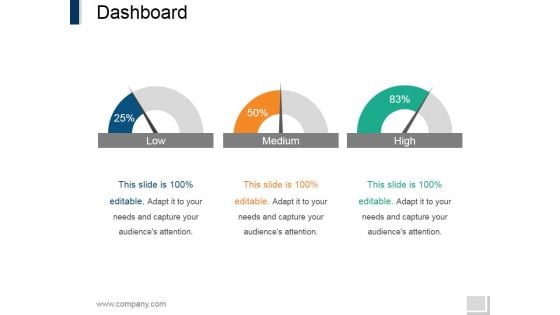
Dashboard Ppt PowerPoint Presentation Pictures Portfolio
This is a dashboard ppt powerpoint presentation pictures portfolio. This is a three stage process. The stages in this process are speed, meter, business, marketing, equipment.
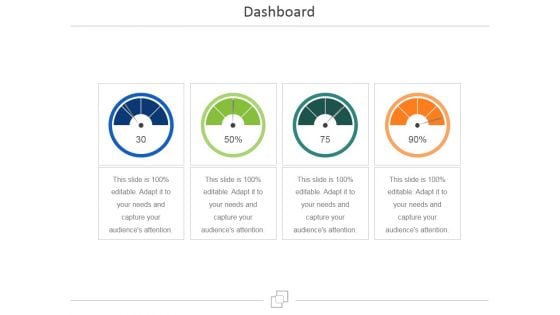
Dashboard Ppt PowerPoint Presentation Infographic Template Model
This is a dashboard ppt powerpoint presentation infographic template model. This is a four stage process. The stages in this process are business, marketing, meter, speed, measure.
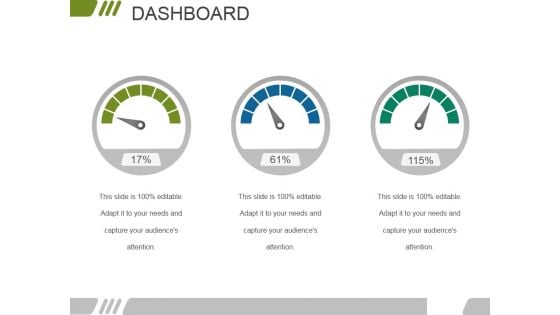
Dashboard Ppt PowerPoint Presentation Visual Aids Professional
This is a dashboard ppt powerpoint presentation visual aids professional. This is a three stage process. The stages in this process are speed, meter, business, marketing, equipment.

Dashboard Ppt PowerPoint Presentation Infographics Introduction
This is a dashboard ppt powerpoint presentation infographics introduction. This is a four stage process. The stages in this process are dashboard, meter, business, marketing, finance.
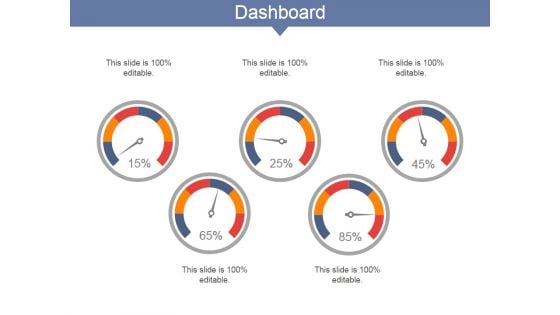
Dashboard Ppt PowerPoint Presentation Model Inspiration
This is a dashboard ppt powerpoint presentation model inspiration. This is a five stage process. The stages in this process are dashboard, business, marketing, strategy, meter.
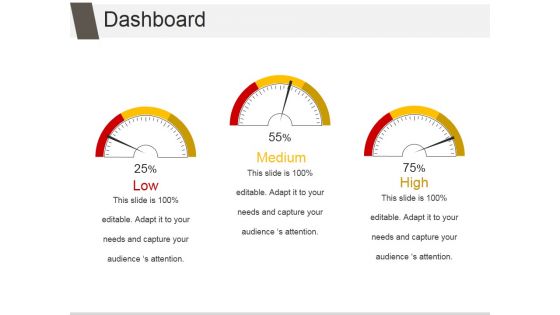
Dashboard Ppt PowerPoint Presentation Inspiration File Formats
This is a dashboard ppt powerpoint presentation inspiration file formats. This is a three stage process. The stages in this process are speed, meter, business, marketing, equipment.
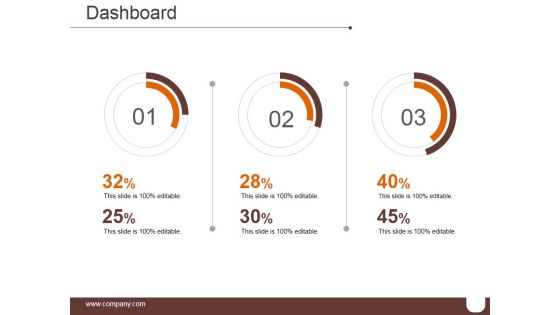
Dashboard Ppt PowerPoint Presentation Infographics Format Ideas
This is a dashboard ppt powerpoint presentation infographics format ideas. This is a three stage process. The stages in this process are speed, meter, business, marketing, equipment.
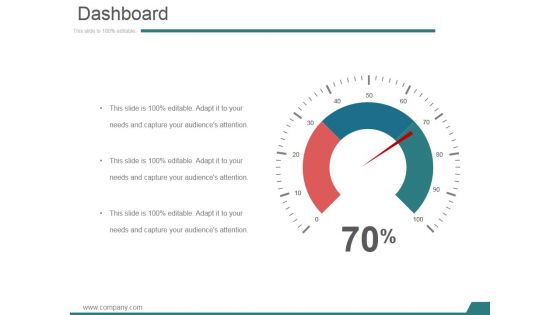
Dashboard Ppt PowerPoint Presentation Infographics Sample
This is a dashboard ppt powerpoint presentation infographics sample. This is a one stage process. The stages in this process are speed, meter, business, marketing, equipment.
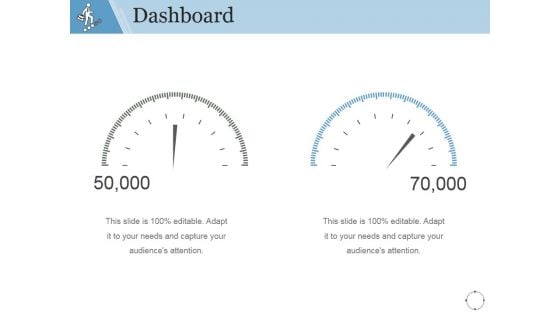
Dashboard Ppt PowerPoint Presentation Gallery Layouts
This is a dashboard ppt powerpoint presentation gallery layouts. This is a two stage process. The stages in this process are speed, meter, business, marketing, equipment.
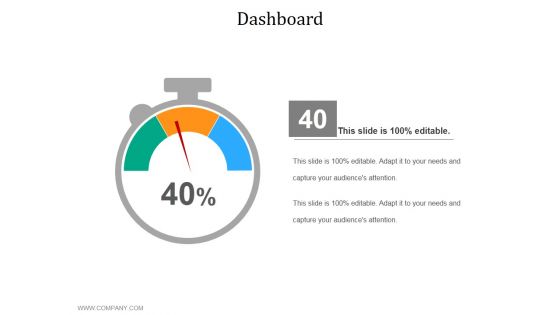
Dashboard Ppt PowerPoint Presentation Summary Example Topics
This is a dashboard ppt powerpoint presentation summary example topics. This is a one stage process. The stages in this process are speed, meter, business, marketing, equipment.
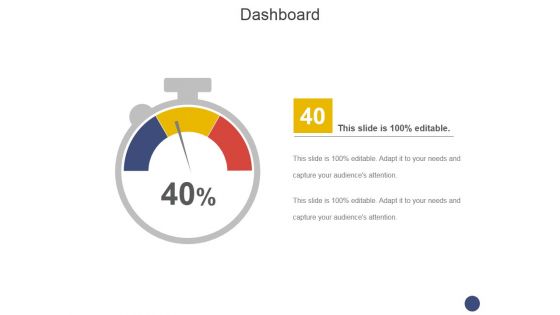
Dashboard Ppt PowerPoint Presentation Layouts Diagrams
This is a dashboard ppt powerpoint presentation layouts diagrams. This is a one stage process. The stages in this process are speed, meter, business, marketing, equipment.
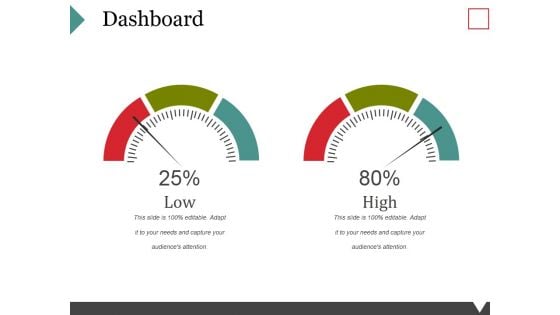
Dashboard Ppt PowerPoint Presentation Pictures Outfit
This is a dashboard ppt powerpoint presentation pictures outfit. This is a two stage process. The stages in this process are speed, meter, business, marketing, equipment.
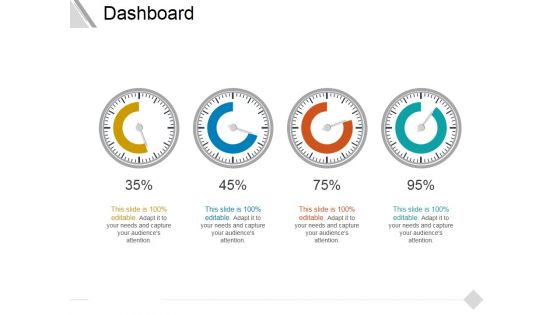
Dashboard Ppt PowerPoint Presentation Slides Styles
This is a dashboard ppt powerpoint presentation slides styles. This is a four stage process. The stages in this process are speed, meter, business, marketing, equipment.
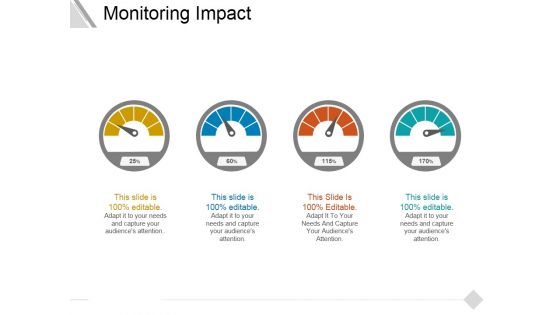
Monitoring Impact Ppt PowerPoint Presentation Ideas Guide
This is a monitoring impact ppt powerpoint presentation ideas guide. This is a four stage process. The stages in this process are speed, meter, business, marketing, equipment.
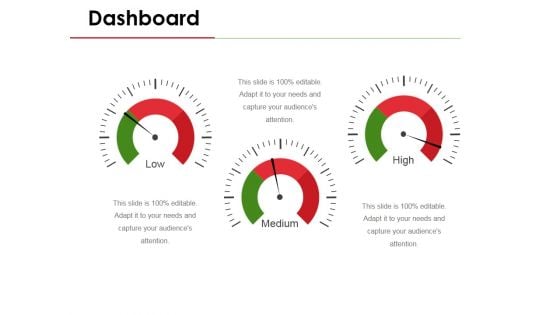
Dashboard Ppt PowerPoint Presentation File Background
This is a dashboard ppt powerpoint presentation file background. This is a three stage process. The stages in this process are speed, meter, business, marketing, equipment.
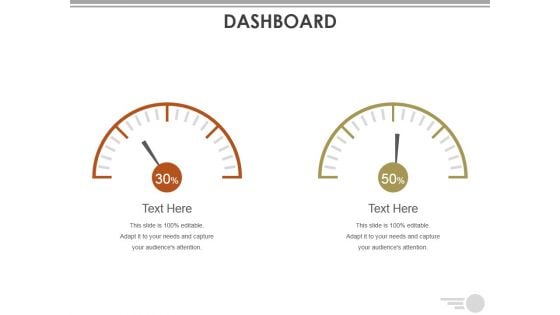
Dashboard Ppt PowerPoint Presentation Portfolio Demonstration
This is a dashboard ppt powerpoint presentation portfolio demonstration. This is a two stage process. The stages in this process are dashboard, finance, percentage, meter, speed.
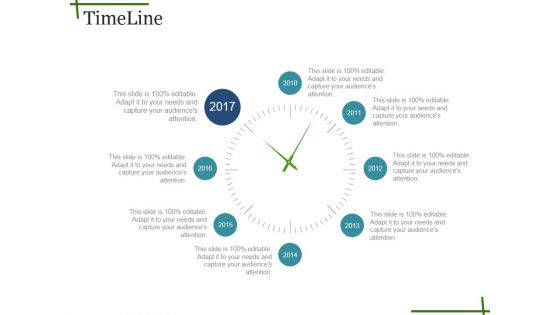
Timeline Ppt PowerPoint Presentation Show Template
This is a timeline ppt powerpoint presentation show template. This is a eight stage process. The stages in this process are measure, years, timeline, meter, watch.
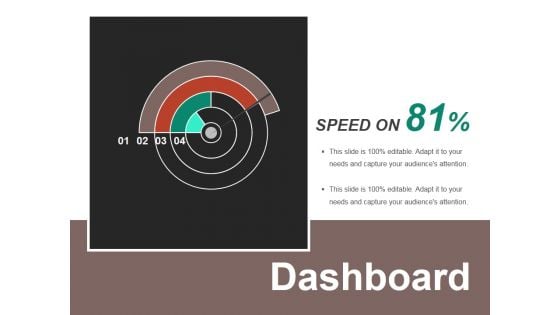
Dashboard Ppt PowerPoint Presentation Summary Format
This is a dashboard ppt powerpoint presentation summary format. This is a one stage process. The stages in this process are speed, meter, dashboard, measure, planning.
Dashboard Ppt PowerPoint Presentation Pictures Icon
This is a dashboard ppt powerpoint presentation pictures icon. This is a six stage process. The stages in this process are dashboard, meter, measure, speed, marketing.
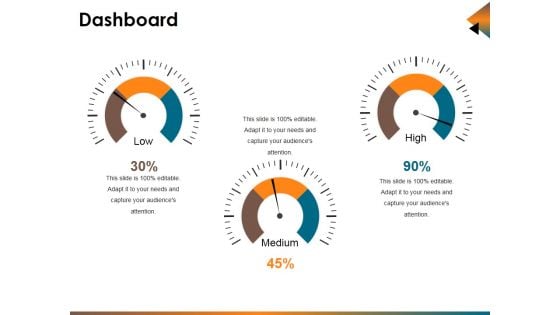
Dashboard Ppt PowerPoint Presentation Model Layout
This is a dashboard ppt powerpoint presentation model layout. This is a three stage process. The stages in this process are dashboard, meter, finance, speed, marketing.
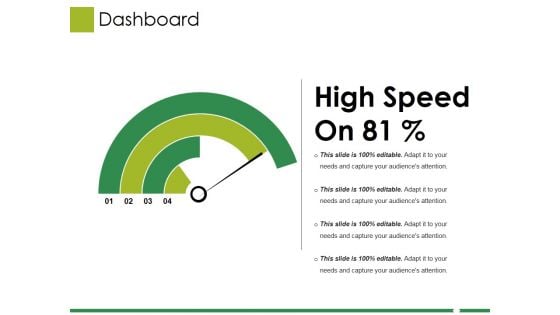
Dashboard Ppt PowerPoint Presentation Model Slide Download
This is a dashboard ppt powerpoint presentation model slide download. This is a one stage process. The stages in this process are finance, planning, meter, speed, dashboard.
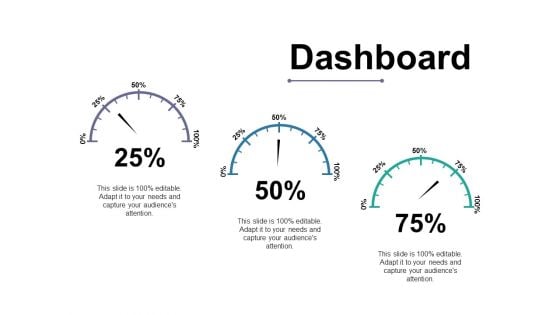
Dashboard Ppt PowerPoint Presentation Styles Themes
This is a dashboard ppt powerpoint presentation styles themes. This is a three stage process. The stages in this process are dashboard, speed, meter, business, marketing.
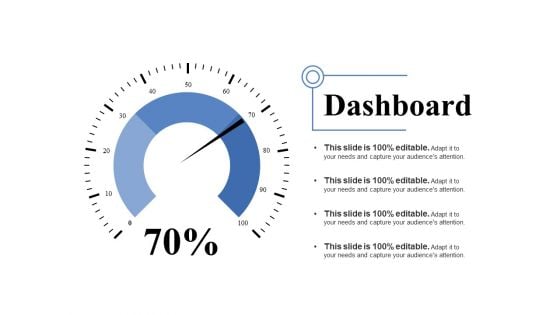
Dashboard Ppt PowerPoint Presentation Summary Maker
This is a dashboard ppt powerpoint presentation summary maker. This is a one stage process. The stages in this process are dashboard, marketing, speed, planning, meter.
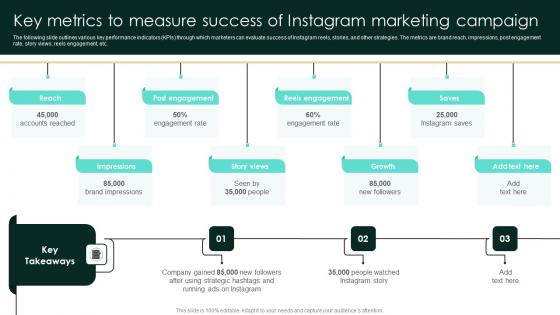
Key Metrics To Measure Success Of Instagram Marketing Campaign Strategic Real Estate Rules Pdf
The following slide outlines various key performance indicators KPIs through which marketers can evaluate success of Instagram reels, stories, and other strategies. The metrics are brand reach, impressions, post engagement rate, story views, reels engagement, etc. Slidegeeks has constructed Key Metrics To Measure Success Of Instagram Marketing Campaign Strategic Real Estate Rules Pdf after conducting extensive research and examination. These presentation templates are constantly being generated and modified based on user preferences and critiques from editors. Here, you will find the most attractive templates for a range of purposes while taking into account ratings and remarks from users regarding the content. This is an excellent jumping-off point to explore our content and will give new users an insight into our top-notch PowerPoint Templates. The following slide outlines various key performance indicators KPIs through which marketers can evaluate success of Instagram reels, stories, and other strategies. The metrics are brand reach, impressions, post engagement rate, story views, reels engagement, etc.
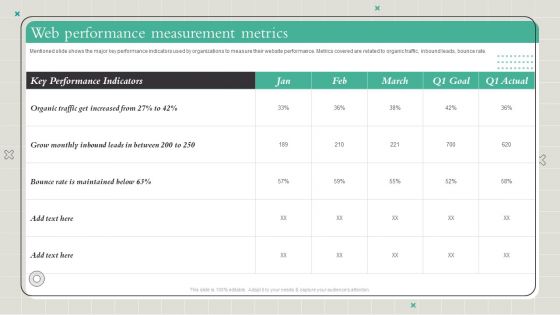
Playbook To Formulate Efficient Web Performance Measurement Metrics Diagrams PDF
Mentioned slide shows the major key performance indicators used by organizations to measure their website performance. Metrics covered are related to organic traffic, inbound leads, bounce rate. Slidegeeks has constructed Playbook To Formulate Efficient Web Performance Measurement Metrics Diagrams PDF after conducting extensive research and examination. These presentation templates are constantly being generated and modified based on user preferences and critiques from editors. Here, you will find the most attractive templates for a range of purposes while taking into account ratings and remarks from users regarding the content. This is an excellent jumping-off point to explore our content and will give new users an insight into our top-notch PowerPoint Templates.
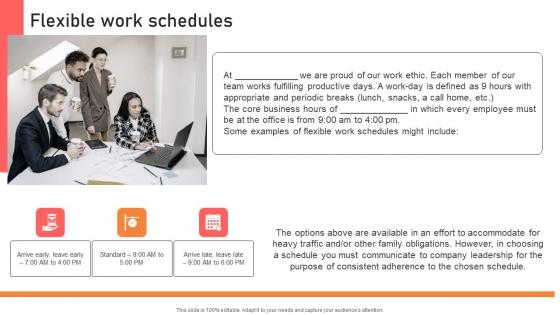
Flexible Work Schedules Handbook For Corporate Personnel Infographics Pdf
Slidegeeks has constructed Flexible Work Schedules Handbook For Corporate Personnel Infographics Pdf after conducting extensive research and examination. These presentation templates are constantly being generated and modified based on user preferences and critiques from editors. Here, you will find the most attractive templates for a range of purposes while taking into account ratings and remarks from users regarding the content. This is an excellent jumping-off point to explore our content and will give new users an insight into our top-notch PowerPoint Templates. This slide covers KPI dashboard to measure employee satisfaction due to effective internal communication. It includes indicators such as net promoter score, retention rate, absenteeism etc.
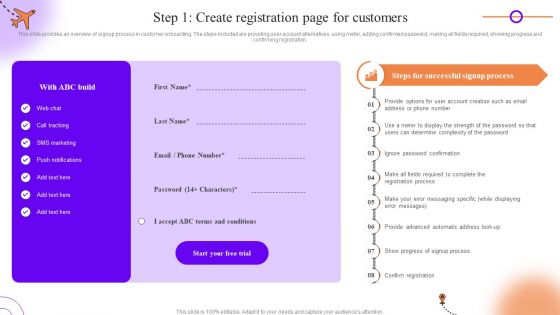
Client Onboarding Journey Impact On Business Step 1 Create Registration Page For Customers Template PDF
This slide provides an overview of signup process in customer onboarding. The steps included are providing user account alternatives, using meter, adding confirmed password, making all fields required, showing progress and confirming registration. Slidegeeks has constructed Client Onboarding Journey Impact On Business Step 1 Create Registration Page For Customers Template PDF after conducting extensive research and examination. These presentation templates are constantly being generated and modified based on user preferences and critiques from editors. Here, you will find the most attractive templates for a range of purposes while taking into account ratings and remarks from users regarding the content. This is an excellent jumping-off point to explore our content and will give new users an insight into our top-notch PowerPoint Templates.
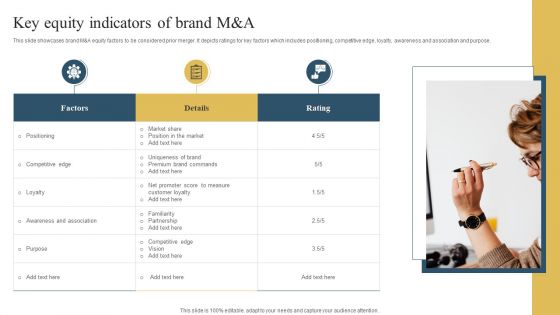
Key Equity Indicators Of Brand M And A Summary PDF
This slide showcases brand M andA equity factors to be considered prior merger. It depicts ratings for key factors which includes positioning, competitive edge, loyalty, awareness and association and purpose. Showcasing this set of slides titled Key Equity Indicators Of Brand M And A Summary PDF. The topics addressed in these templates are Positioning, Loyalty, Purpose. All the content presented in this PPT design is completely editable. Download it and make adjustments in color, background, font etc. as per your unique business setting.

Key Performance Indicators Template 1 Ppt PowerPoint Presentation Styles Mockup
This is a key performance indicators template 1 ppt powerpoint presentation styles mockup. This is a four stage process. The stages in this process are dashboard, meter, business, marketing, speed.
Customer Satisfaction Levels High Medium Low Indicator Dashboard Ppt PowerPoint Presentation Icon Show
This is a customer satisfaction levels high medium low indicator dashboard ppt powerpoint presentation icon show. This is a six stage process. The stages in this process are performance dashboard, performance meter, performance kpi.

Low High Performance Measurement Indicator Dashboard Ppt PowerPoint Presentation Summary Images
This is a low high performance measurement indicator dashboard ppt powerpoint presentation summary images. This is a five stage process. The stages in this process are performance dashboard, performance meter, performance kpi.

Metrics Measuring Impact Of Culture And Transformation Strategy Elements Pdf
The following slide enlists metrics to measure quality of company culture for the purpose of designing appropriate strategies and gauge employee satisfaction. It covers employee referrals, internal transfers, productivity metrics, employee turnover rates and communication metrics Pitch your topic with ease and precision using this Metrics Measuring Impact Of Culture And Transformation Strategy Elements Pdf. This layout presents information on Employee Referrals, Internal Transfers, Productivity. It is also available for immediate download and adjustment. So, changes can be made in the color, design, graphics or any other component to create a unique layout. The following slide enlists metrics to measure quality of company culture for the purpose of designing appropriate strategies and gauge employee satisfaction. It covers employee referrals, internal transfers, productivity metrics, employee turnover rates and communication metrics
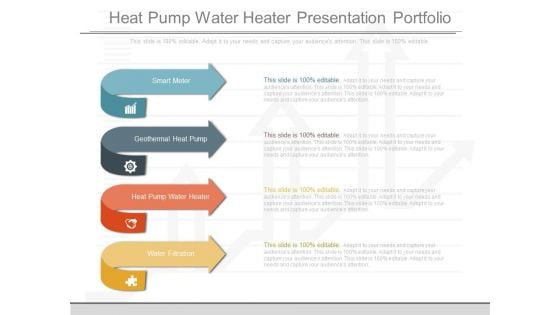
Heat Pump Water Heater Presentation Portfolio
This is a heat pump water heater presentation portfolio. This is a four stage process. The stages in this process are smart meter, geothermal heat pump, heat pump water heater, water filtration.

Small Wind Powerpoint Slide Presentation Guidelines
This is a small wind powerpoint slide presentation guidelines. This is a four stage process. The stages in this process are heat pump water heater, geothermal heat pump, small wind, smart meter.
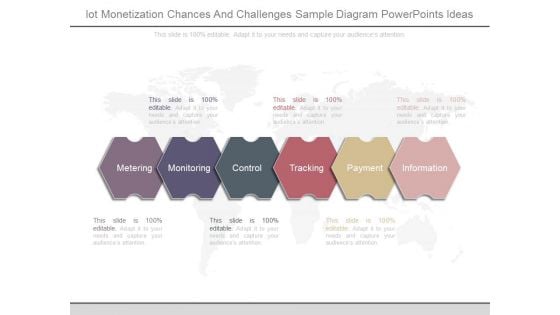
Iot Monetization Chances And Challenges Sample Diagram Powerpoints Ideas
This is a iot monetization chances and challenges sample diagram powerpoints ideas. This is a six stage process. The stages in this process are metering, monitoring, control, tracking, payment, information.
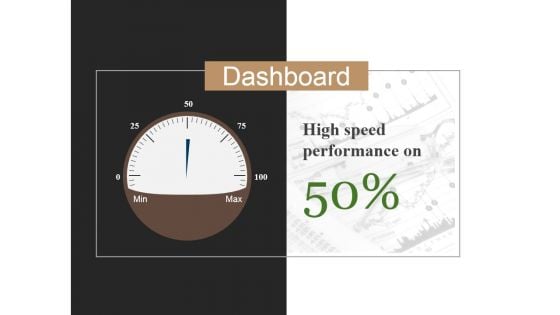
Dashboard Ppt PowerPoint Presentation File Slide
This is a dashboard ppt powerpoint presentation file slide. This is a one stage process. The stages in this process are high speed performance on, business, marketing, meter, measure.
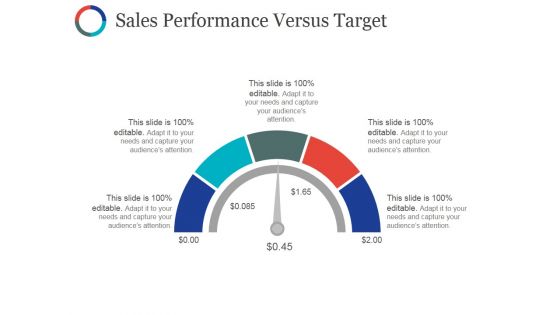
Sales Performance Versus Target Ppt PowerPoint Presentation File Vector
This is a sales performance versus target ppt powerpoint presentation file vector. This is a five stage process. The stages in this process are business, marketing, speed, meter, sales.
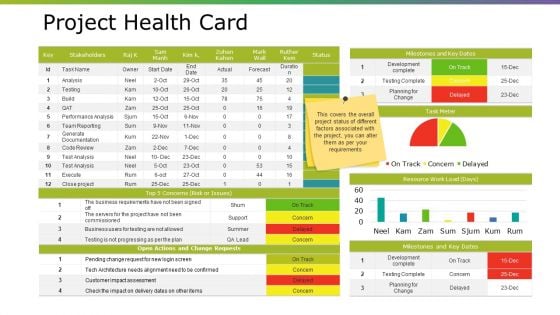
Project Health Card Ppt PowerPoint Presentation Summary Example
This is a project health card ppt powerpoint presentation summary example. This is a seven stage process. The stages in this process are development complete, testing complete, planning for change, milestones and key dates, task meter.
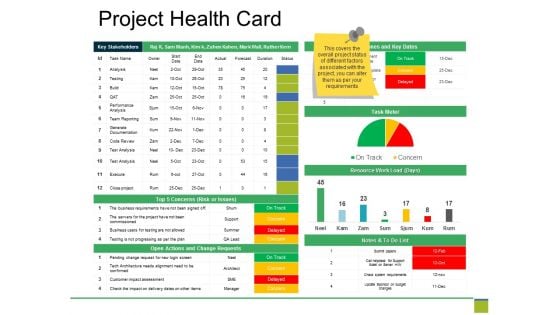
Project Health Card Ppt PowerPoint Presentation Pictures Design Templates
This is a project health card ppt powerpoint presentation pictures design templates. This is a seven stage process. The stages in this process are key stakeholders, milestones and key dates, task meter, submit papers, check system requirements.
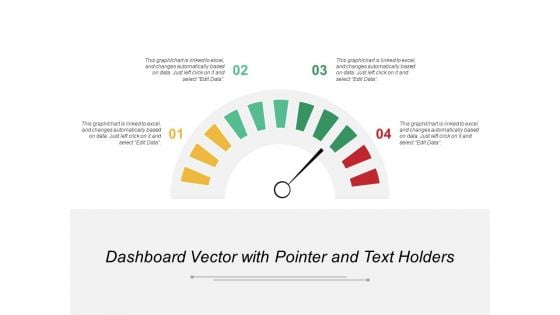
Dashboard Vector With Pointer And Text Holders Ppt PowerPoint Presentation Portfolio Format Ideas
This is a dashboard vector with pointer and text holders ppt powerpoint presentation portfolio format ideas. This is a four stage process. The stages in this process are performance dashboard, performance meter, performance kpi.
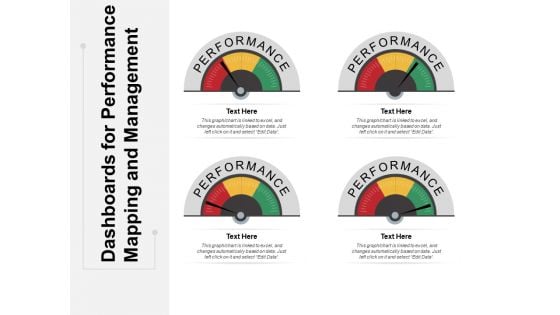
Dashboards For Performance Mapping And Management Ppt PowerPoint Presentation Ideas File Formats
This is a dashboards for performance mapping and management ppt powerpoint presentation ideas file formats. This is a four stage process. The stages in this process are performance dashboard, performance meter, performance kpi.
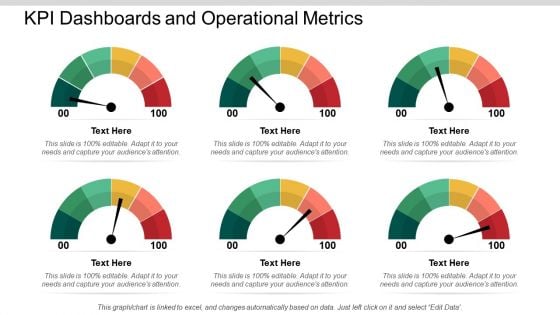
KPI Dashboards And Operational Metrics Ppt PowerPoint Presentation Portfolio Infographics
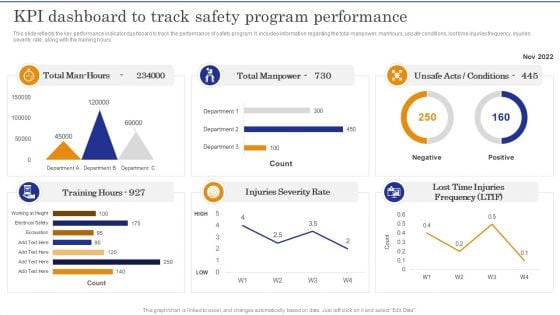
Construction Site Safety Measure KPI Dashboard To Track Safety Program Performance Slides PDF
This slide reflects the key performance indicator dashboard to track the performance of safety program. It includes information regarding the total manpower, manhours, unsafe conditions, lost time injuries frequency, injuries severity rate, along with the training hours.Slidegeeks has constructed Construction Site Safety Measure KPI Dashboard To Track Safety Program Performance Slides PDF after conducting extensive research and examination. These presentation templates are constantly being generated and modified based on user preferences and critiques from editors. Here, you will find the most attractive templates for a range of purposes while taking into account ratings and remarks from users regarding the content. This is an excellent jumping-off point to explore our content and will give new users an insight into our top-notch PowerPoint Templates.
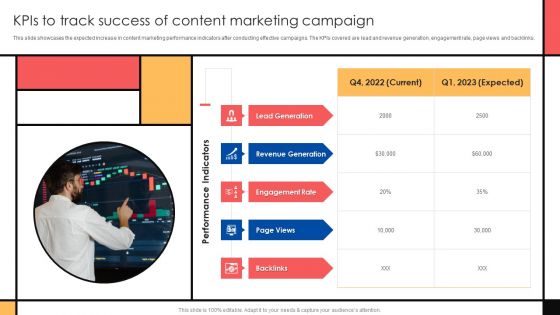
Guide To Create Advertising Campaign For Client Engagement Kpis To Track Success Of Content Marketing Campaign Brochure PDF
This slide showcases the expected increase in content marketing performance indicators after conducting effective campaigns. The KPIs covered are lead and revenue generation, engagement rate, page views and backlinks. Slidegeeks has constructed Guide To Create Advertising Campaign For Client Engagement Kpis To Track Success Of Content Marketing Campaign Brochure PDF after conducting extensive research and examination. These presentation templates are constantly being generated and modified based on user preferences and critiques from editors. Here, you will find the most attractive templates for a range of purposes while taking into account ratings and remarks from users regarding the content. This is an excellent jumping-off point to explore our content and will give new users an insight into our top-notch PowerPoint Templates.
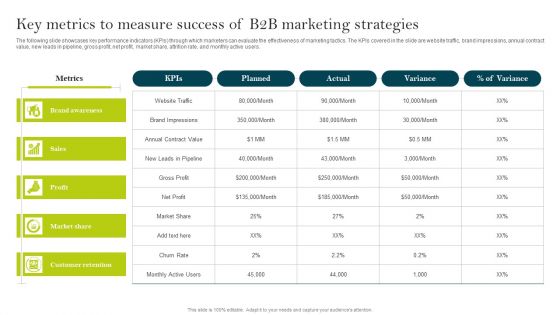
Key Metrics To Measure Success Of B2B Marketing Strategies Ppt PowerPoint Presentation File Styles PDF
The following slide showcases key performance indicators KPIs through which marketers can evaluate the effectiveness of marketing tactics. The KPIs covered in the slide are website traffic, brand impressions, annual contract value, new leads in pipeline, gross profit, net profit, market share, attrition rate, and monthly active users. Slidegeeks has constructed Key Metrics To Measure Success Of B2B Marketing Strategies Ppt PowerPoint Presentation File Styles PDF after conducting extensive research and examination. These presentation templates are constantly being generated and modified based on user preferences and critiques from editors. Here, you will find the most attractive templates for a range of purposes while taking into account ratings and remarks from users regarding the content. This is an excellent jumping off point to explore our content and will give new users an insight into our top notch PowerPoint Templates.
Employee Performance KPI Tracker For 360 Degree Review Structure PDF
This slide covers 360 degree workforce performance evaluation sheet. It includes ratings such as peer, customer, upwards, downwards, overall, etc. Showcasing this set of slides titled Employee Performance KPI Tracker For 360 Degree Review Structure PDF The topics addressed in these templates are Performance Indicators, Communication, Customer All the content presented in this PPT design is completely editable. Download it and make adjustments in color, background, font etc. as per your unique business setting.
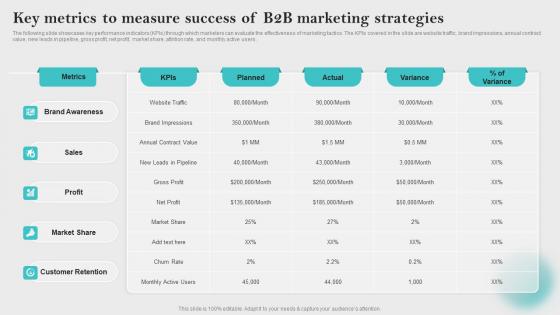
Key Metrics To Measure Success Innovative Business Promotion Ideas Pictures Pdf
The following slide showcases key performance indicators KPIs through which marketers can evaluate the effectiveness of marketing tactics. The KPIs covered in the slide are website traffic, brand impressions, annual contract value, new leads in pipeline, gross profit, net profit, market share, attrition rate, and monthly active users. Slidegeeks has constructed Key Metrics To Measure Success Innovative Business Promotion Ideas Pictures Pdf after conducting extensive research and examination. These presentation templates are constantly being generated and modified based on user preferences and critiques from editors. Here, you will find the most attractive templates for a range of purposes while taking into account ratings and remarks from users regarding the content. This is an excellent jumping off point to explore our content and will give new users an insight into our top notch PowerPoint Templates. The following slide showcases key performance indicators KPIs through which marketers can evaluate the effectiveness of marketing tactics. The KPIs covered in the slide are website traffic, brand impressions, annual contract value, new leads in pipeline, gross profit, net profit, market share, attrition rate, and monthly active users.
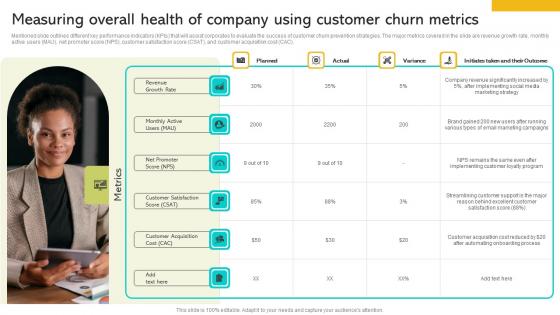
Implementing Strategies To Enhance Measuring Overall Health Of Company Using Customer Slides PDF
Mentioned slide outlines different key performance indicators KPIs that will assist corporates to evaluate the success of customer churn prevention strategies. The major metrics covered in the slide are revenue growth rate, monthly active users MAU, net promoter score NPS, customer satisfaction score CSAT, and customer acquisition cost CAC. Slidegeeks has constructed Implementing Strategies To Enhance Measuring Overall Health Of Company Using Customer Slides PDF after conducting extensive research and examination. These presentation templates are constantly being generated and modified based on user preferences and critiques from editors. Here, you will find the most attractive templates for a range of purposes while taking into account ratings and remarks from users regarding the content. This is an excellent jumping-off point to explore our content and will give new users an insight into our top-notch PowerPoint Templates. Mentioned slide outlines different key performance indicators KPIs that will assist corporates to evaluate the success of customer churn prevention strategies. The major metrics covered in the slide are revenue growth rate, monthly active users MAU, net promoter score NPS, customer satisfaction score CSAT, and customer acquisition cost CAC.

Liquid Gauge Symbol Digital Water Digital Reading Control Gauge Ppt PowerPoint Presentation Complete Deck
Presenting this set of slides with name liquid gauge symbol digital water digital reading control gauge ppt powerpoint presentation complete deck. The topics discussed in these slides are digital water, digital reading, control gauge, water meter. This is a completely editable PowerPoint presentation and is available for immediate download. Download now and impress your audience.
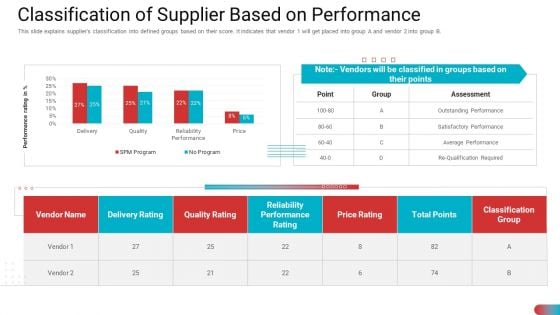
Benchmarking Vendor Operation Control Procedure Classification Of Supplier Based On Performance Mockup PDF
This slide explains suppliers classification into defined groups based on their score. It indicates that vendor 1 will get placed into group A and vendor 2 into group B. Deliver and pitch your topic in the best possible manner with this benchmarking vendor operation control procedure classification of supplier based on performance mockup pdf. Use them to share invaluable insights on quality rating, reliability performance rating, price rating, classification group and impress your audience. This template can be altered and modified as per your expectations. So, grab it now.
Software Tool Leading And Lagging Performance Tracking Indicators Diagrams PDF
This slide showcase the lagging and leading performance indicators after the implementation of a software tool. It includes customer integration data, email campaign revenue generated,session time, email deliverability, email click rates etc. Persuade your audience using this Software Tool Leading And Lagging Performance Tracking Indicators Diagrams PDF. This PPT design covers Two stages, thus making it a great tool to use. It also caters to a variety of topics including Software Tool Leading, Lagging Performance, Tracking Indicators. Download this PPT design now to present a convincing pitch that not only emphasizes the topic but also showcases your presentation skills.


 Continue with Email

 Home
Home


