Rating Meter
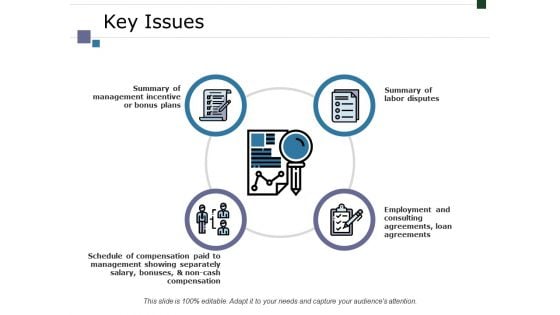
Key Issues Ppt PowerPoint Presentation Infographic Template Example 2015
This is a key issues ppt powerpoint presentation infographic template example 2015. This is a four stage process. The stages in this process are business, summary of management incentive or bonus plans, summary of labor disputes, employment and consulting agreements, loan agreements, management.
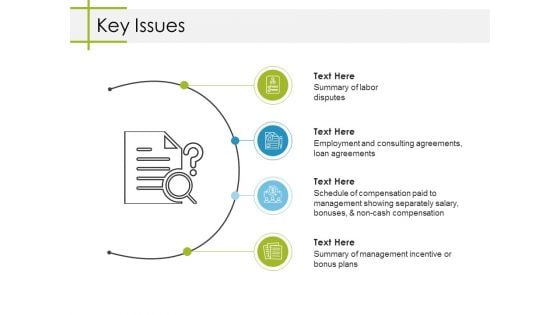
Key Issues Ppt PowerPoint Presentation Slides Deck
This is a key issues ppt powerpoint presentation slides deck. This is a four stage process. The stages in this process are key issues, business, marketing, icons, strategy.
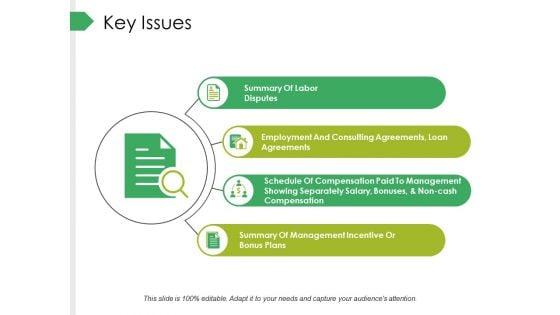
Key Issues Ppt PowerPoint Presentation Professional Design Inspiration
This is a key issues ppt powerpoint presentation professional design inspiration. This is a four stage process. The stages in this process are business, summary of labor disputes, summary of management incentive or bonus plans, employment and consulting agreements, loan agreements, marketing.
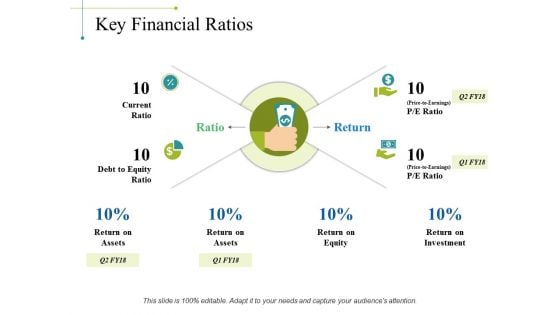
Key Financial Ratios Ppt PowerPoint Presentation Guidelines
This is a key financial ratios ppt powerpoint presentation guidelines. This is a four stage process. The stages in this process are current ratio, debt to equity ratio, ratio, return, return on assets.
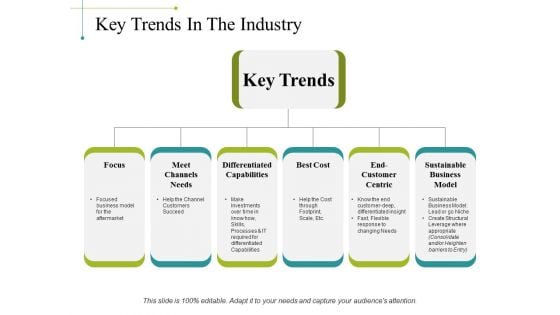
Key Trends In The Industry Ppt PowerPoint Presentation Portfolio Design Inspiration
This is a key trends in the industry ppt powerpoint presentation portfolio design inspiration. This is a six stage process. The stages in this process are focus, meet channels needs, differentiated capabilities, best cost, sustainable business model.
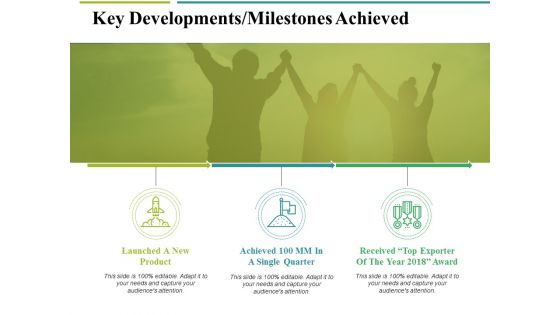
Key Developments Milestones Achieved Ppt PowerPoint Presentation Ideas Styles
This is a key developments milestones achieved ppt powerpoint presentation ideas styles. This is a three stage process. The stages in this process are launched a new product, single quarter, key developments, business, marketing.
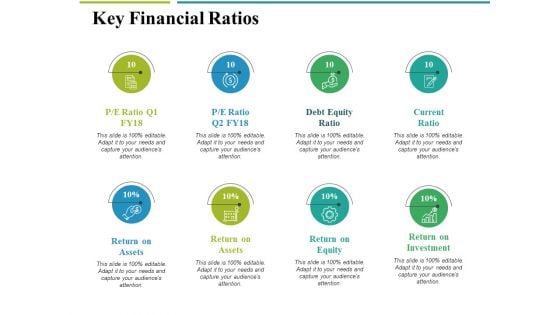
Key Financial Ratios Ppt PowerPoint Presentation Portfolio Summary
This is a key financial ratios ppt powerpoint presentation portfolio summary. This is a eight stage process. The stages in this process are return on assets, return on equity, return on investment, debt equity ratio, current ratio.
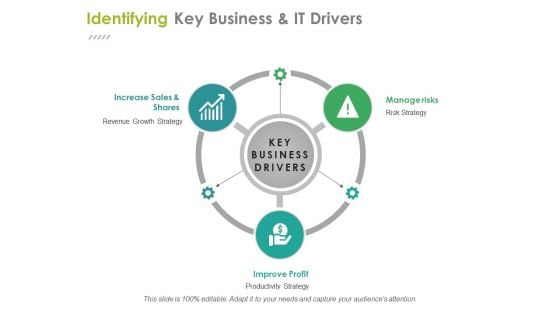
Identifying Key Business And It Drivers Ppt PowerPoint Presentation Ideas Files
This is a identifying key business and it drivers ppt powerpoint presentation ideas files. This is a three stage process. The stages in this process are increase sales and shares, improve profit, manage risks, business, management.
Fuel Dashboards Showing Empty And Full Levels Ppt PowerPoint Presentation Professional Slide Portrait
This is a fuel dashboards showing empty and full levels ppt powerpoint presentation professional slide portrait. This is a four stage process. The stages in this process are fuel gauge, gas gauge, fuel containers.
Oil And Gas Fuel Dashboards Ppt PowerPoint Presentation File Introduction
This is a oil and gas fuel dashboards ppt powerpoint presentation file introduction. This is a two stage process. The stages in this process are fuel gauge, gas gauge, fuel containers.
Semi Circular Fuel Dashboard With Pointer In Centre Ppt PowerPoint Presentation Outline Visuals
This is a semi circular fuel dashboard with pointer in centre ppt powerpoint presentation outline visuals. This is a three stage process. The stages in this process are fuel gauge, gas gauge, fuel containers.
Speed Dashboard With Arrows Percent Values And Icons Ppt PowerPoint Presentation Infographic Template Model
This is a speed dashboard with arrows percent values and icons ppt powerpoint presentation infographic template model. This is a two stage process. The stages in this process are fuel gauge, gas gauge, fuel containers.
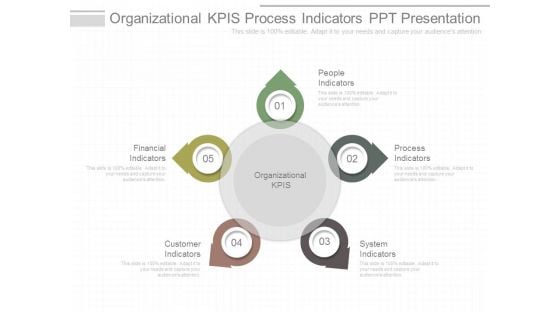
Organizational Kpis Process Indicators Ppt Presentation
This is a organizational kpis process indicators ppt presentation. This is a five stage process. The stages in this process are people indicators, process indicators, system indicators, customer indicators, financial indicators, organizational kpis.
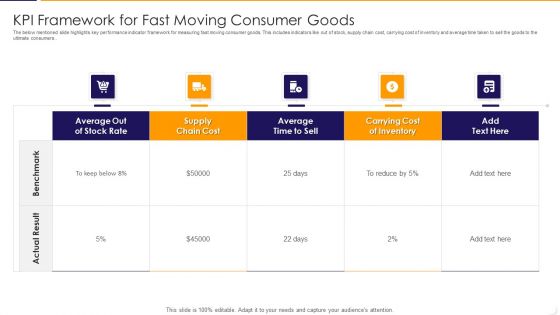
KPI Framework For Fast Moving Consumer Goods Ppt PowerPoint Presentation File Show PDF
The below mentioned slide highlights key performance indicator framework for measuring fast moving consumer goods. This includes indicators like out of stock, supply chain cost, carrying cost of inventory and average time taken to sell the goods to the ultimate consumers. Pitch your topic with ease and precision using this kpi framework for fast moving consumer goods ppt powerpoint presentation file show pdf This layout presents information on average, stock rate, cost It is also available for immediate download and adjustment. So, changes can be made in the color, design, graphics or any other component to create a unique layout.
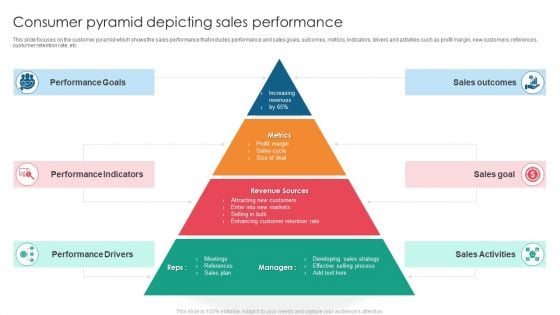
Consumer Pyramid Depicting Sales Performance Introduction PDF
This slide focuses on the customer pyramid which shows the sales performance that includes performance and sales goals, outcomes, metrics, indicators, drivers and activities such as profit margin, new customers, references, customer retention rate, etc. Presenting Consumer Pyramid Depicting Sales Performance Introduction PDF to dispense important information. This template comprises six stages. It also presents valuable insights into the topics including Performance Indicators, Performance Goals, Performance Drivers. This is a completely customizable PowerPoint theme that can be put to use immediately. So, download it and address the topic impactfully.
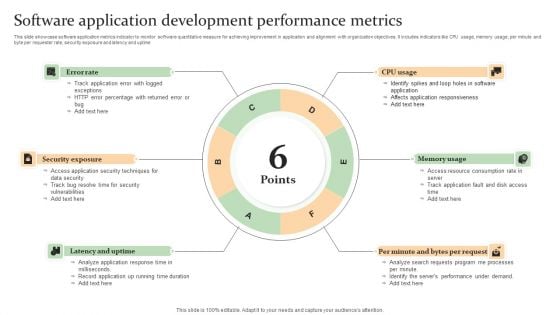
Software Application Development Performance Metrics Mockup PDF
This slide showcase software application metrics indicator to monitor software quantitative measure for achieving improvement in application and alignment with organization objectives. It includes indicators like CPU usage, memory usage, per minute and byte per requester rate, security exposure and latency and uptime Persuade your audience using this Software Application Development Performance Metrics Mockup PDF. This PPT design covers Six stages, thus making it a great tool to use. It also caters to a variety of topics including Latency And Uptime, Memory Usage, Security Exposure . Download this PPT design now to present a convincing pitch that not only emphasizes the topic but also showcases your presentation skills.
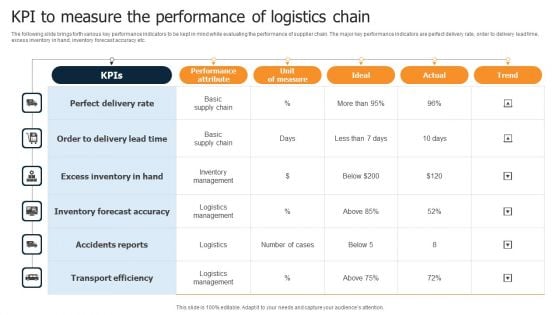
KPI To Measure The Performance Of Logistics Chain Brochure PDF
The following slide brings forth various key performance indicators to be kept in mind while evaluating the performance of supplier chain. The major key performance indicators are perfect delivery rate, order to delivery lead time, excess inventory in hand, inventory forecast accuracy etc. Showcasing this set of slides titled KPI To Measure The Performance Of Logistics Chain Brochure PDF. The topics addressed in these templates are Performance Attribute, Unit Measure, Ideal. All the content presented in this PPT design is completely editable. Download it and make adjustments in color, background, font etc. as per your unique business setting.
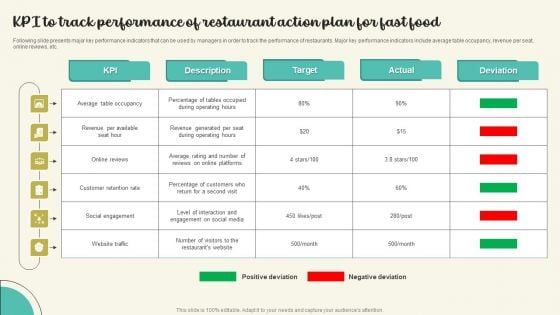
KPI To Track Performance Of Restaurant Action Plan For Fast Food Themes PDF
Following slide presents major key performance indicators that can be used by managers in order to track the performance of restaurants. Major key performance indicators include average table occupancy, revenue per seat, online reviews, etc. Showcasing this set of slides titled KPI To Track Performance Of Restaurant Action Plan For Fast Food Themes PDF. The topics addressed in these templates are Customer Retention Rate, Social Engagement, Website Traffic. All the content presented in this PPT design is completely editable. Download it and make adjustments in color, background, font etc. as per your unique business setting.
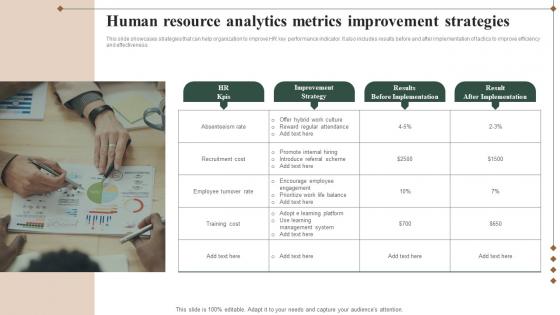
Human Resource Analytics Metrics Improvement Strategies Professional Pdf
This slide showcases strategies that can help organization to improve HR key performance indicator. It also includes results before and after implementation of tactics to improve efficiency and effectiveness.Showcasing this set of slides titled Human Resource Analytics Metrics Improvement Strategies Professional Pdf The topics addressed in these templates are Absenteeism Rate, Employee Turnover, Training Cost All the content presented in this PPT design is completely editable. Download it and make adjustments in color, background, font etc. as per your unique business setting. This slide showcases strategies that can help organization to improve HR key performance indicator. It also includes results before and after implementation of tactics to improve efficiency and effectiveness.

Leading Indicators Operational Ppt Powerpoint Layout
This is a leading indicators operational ppt powerpoint layout. This is a four stage process. The stages in this process are activity based, operational, outcome based, leading indicators.
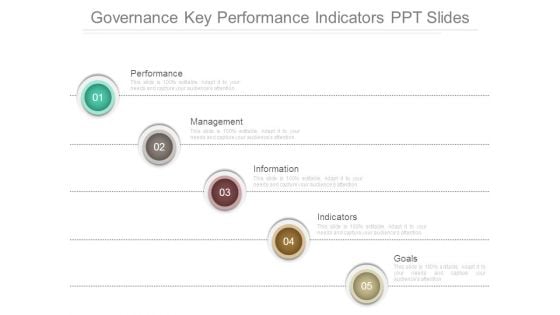
Governance Key Performance Indicators Ppt Slides
This is a governance key performance indicators ppt slides. This is a five stage process. The stages in this process are performance, management, information, indicators, goals.
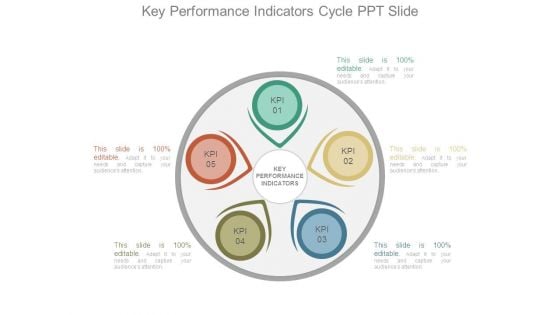
Key Performance Indicators Cycle Ppt Slide
This is a key performance indicators cycle ppt slide. This is a five stage process. The stages in this process are key performance indicators, kpi.
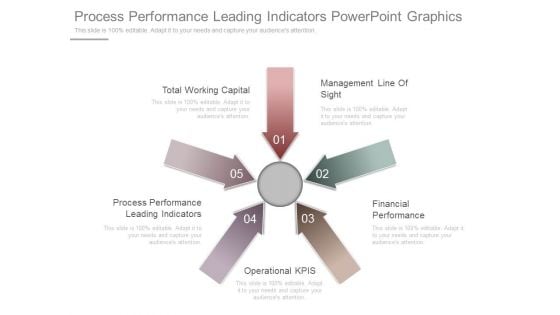
Process Performance Leading Indicators Powerpoint Graphics
This is a process performance leading indicators powerpoint graphics. This is a five stage process. The stages in this process are total working capital, management line of sight, process performance leading indicators, financial performance, operational kpis.
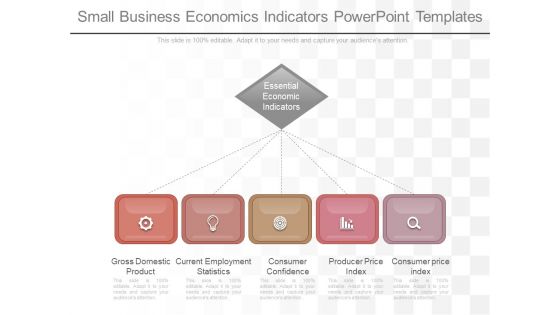
Small Business Economics Indicators Powerpoint Templates
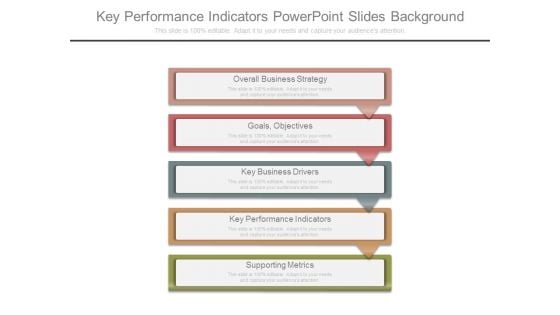
Key Performance Indicators Powerpoint Slides Background
This is a key performance indicators powerpoint slides background. This is a five stage process. The stages in this process are overall business strategy, goals, objectives, key business drivers, key performance indicators, supporting metrics.
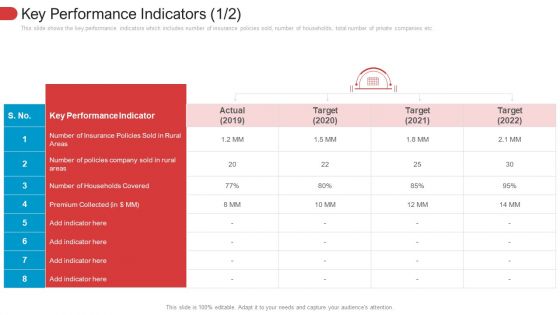
Key Performance Indicators Areas Template PDF
This slide shows the key performance indicators which includes number of insurance policies sold, number of households, total number of private companies etc. Deliver an awe-inspiring pitch with this creative key performance indicators areas template pdf. bundle. Topics like key performance indicator, actual, target, premium collected, number of insurance can be discussed with this completely editable template. It is available for immediate download depending on the needs and requirements of the user.
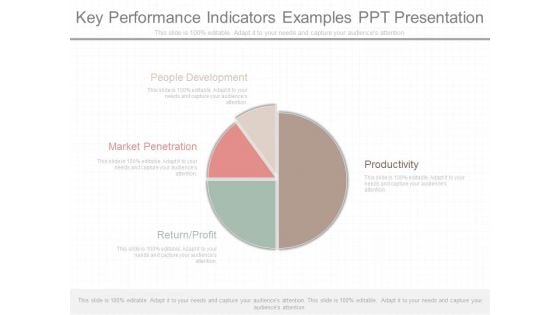
Key Performance Indicators Examples Ppt Presentation
This is a key performance indicators examples ppt presentation. This is a four stage process. The stages in this process are people development, productivity, market penetration, return profit.
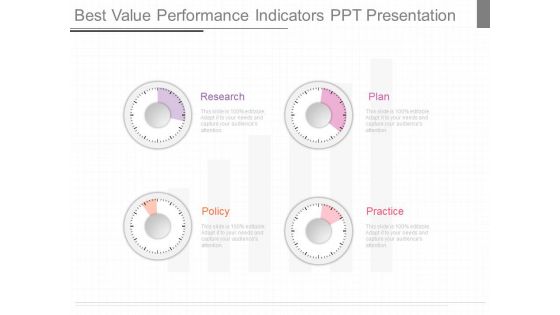
Best Value Performance Indicators Ppt Presentation
This is a best value performance indicators ppt presentation. This is a four stage process. The stages in this process are Research, Policy, Plan, Practice.
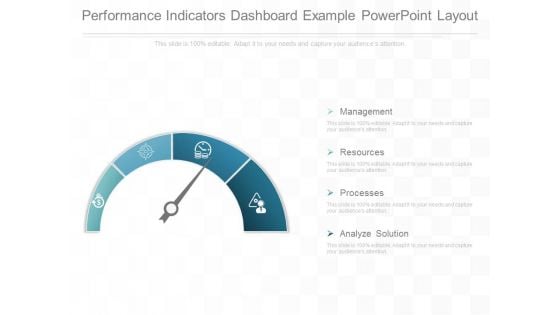
Performance Indicators Dashboard Example Powerpoint Layout
This is a performance indicators dashboard example powerpoint layout. This is a four stage process. The stages in this process are management, resources, processes, analyze solution.
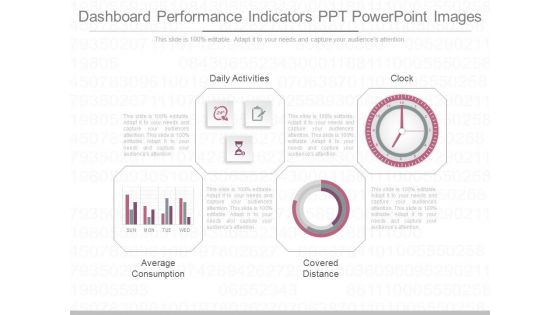
Dashboard Performance Indicators Ppt Powerpoint Images
This is a dashboard performance indicators ppt powerpoint images. This is a four stage process. The stages in this process are daily activities, average consumption, covered distance, clock.

Key Performance Indicators Sample Diagram Ppt Slides
This is a Key Performance Indicators Sample Diagram Ppt Slides. This is a four stage process. The stages in this process are strategize, measure, innovate, propagate.
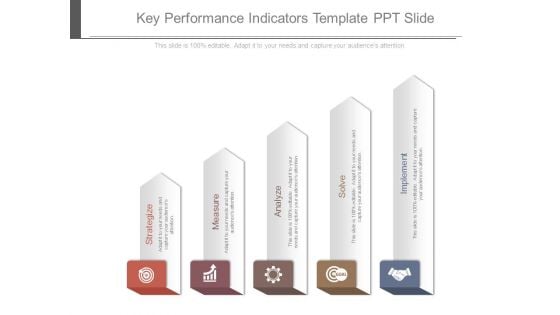
Key Performance Indicators Template Ppt Slide
This is a key performance indicators template ppt slide. This is a five stage process. The stages in this process are strategize, measure, analyze, solve, implement.
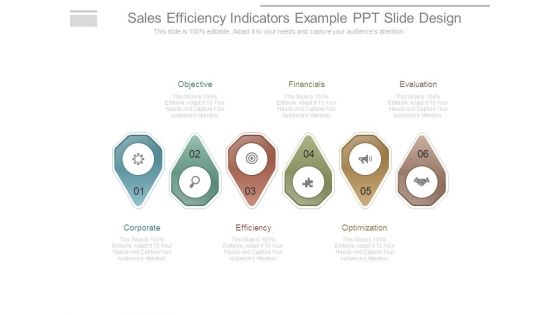
Sales Efficiency Indicators Example Ppt Slide Design
This is a sales efficiency indicators example ppt slide design. This is a six stage process. The stages in this process are objective, financials, evaluation, corporate, efficiency, optimization.
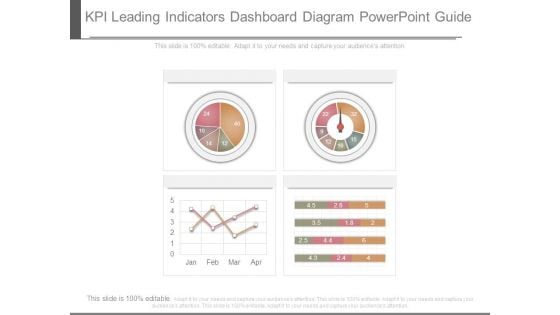
Kpi Leading Indicators Dashboard Diagram Powerpoint Guide
This is a kpi leading indicators dashboard diagram powerpoint guide. This is a four stage process. The stages in this process are business, success, process.
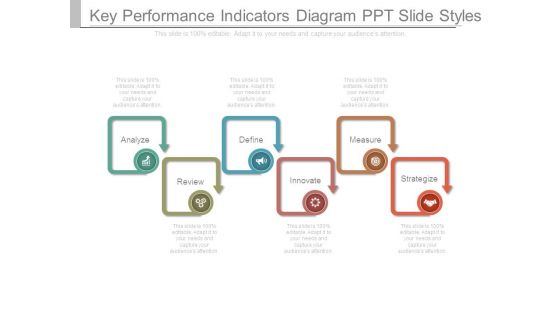
Key Performance Indicators Diagram Ppt Slide Styles
This is a key performance indicators diagram ppt slide styles. This is a six stage process. The stages in this process are analyze, define, measure, review, innovate, strategize.
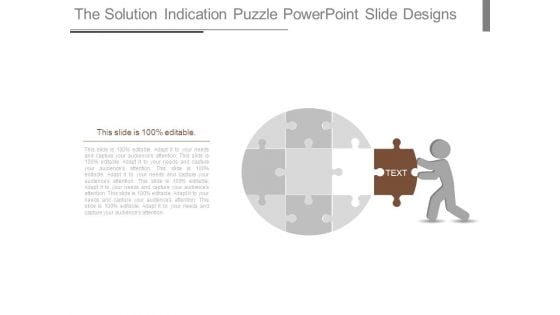
The Solution Indication Puzzle Powerpoint Slide Designs
This is a the solution indication puzzle powerpoint slide designs. This is a one stage process. The stages in this process are business, success, management, puzzle, strategy.

Business Key Performance Indicators Template Ppt Model
This is a business key performance indicators template ppt model. This is a five stage process. The stages in this process are kpi.
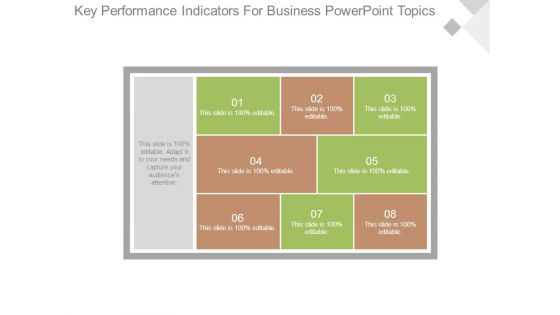
Key Performance Indicators For Business Powerpoint Topics
This is a key performance indicators for business powerpoint topics. This is a eight stage process. The stages in this process are business, marketing, tables, management.
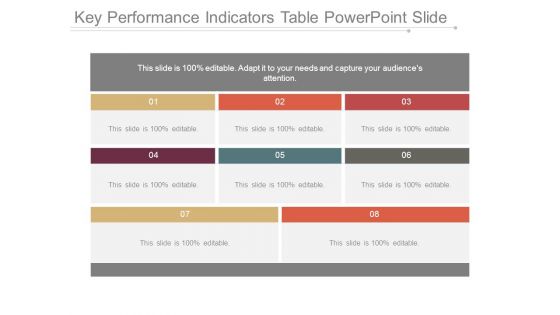
Key Performance Indicators Table Powerpoint Slide
This is a key performance indicators table powerpoint slide. This is a eight stage process. The stages in this process are business, marketing.
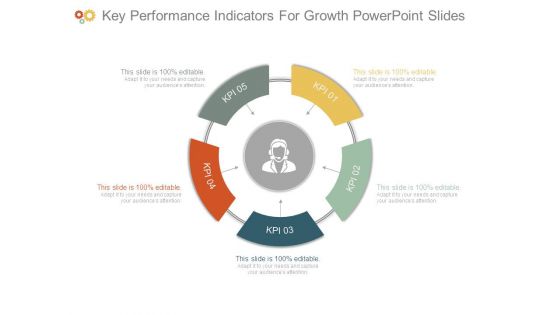
Key Performance Indicators For Growth Powerpoint Slides
This is a key performance indicators for growth powerpoint slides. This is a five stage process. The stages in this process are kpi.
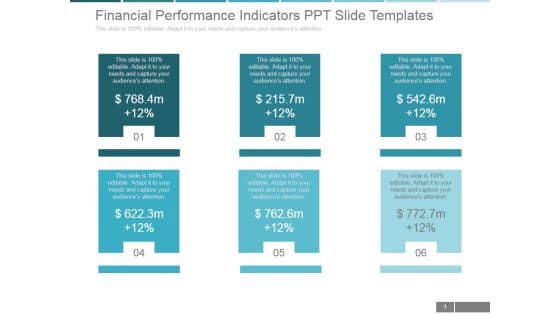
Financial Performance Indicators Ppt PowerPoint Presentation Samples
This is a financial performance indicators ppt powerpoint presentation samples. This is a six stage process. The stages in this process are business, marketing, management, finance, percentage.
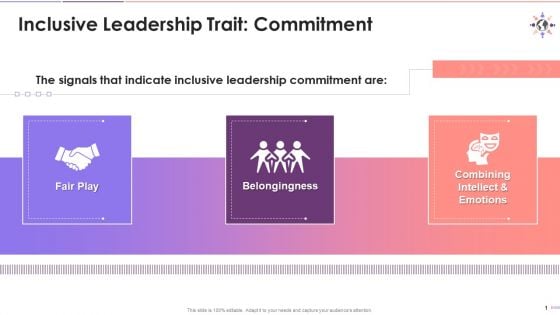
Signals Indicating Inclusive Leadership Commitment Training Ppt
The slide mentions the three main signals that indicate inclusive leadership commitment. These are fair play, belongingness, and combining intellect and emotions.
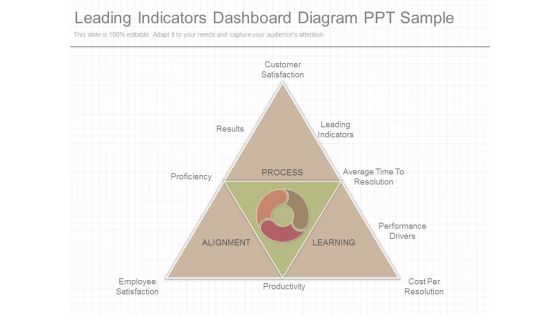
Leading Indicators Dashboard Diagram Ppt Sample
This is a leading indicators dashboard diagram ppt sample. This is a five stage process. The stages in this process are customer satisfaction, leading indicators, average time to resolution, performance drivers, cost per resolution, productivity, employee satisfaction, proficiency, results, process, learning, alignment.

Perspective Performance Indicator Ppt Powerpoint Slide Designs
This is a perspective performance indicator ppt powerpoint slide designs. This is a seven stage process. The stages in this process are performance indicator, perspective, unit, description formula, data source, measurement instrument, method of test how, frequency when, decision criteria, data collector who, owner, baseline, target, process diagram or drawings.
Corporate Key Performance Indicator Icon Inspiration PDF
Showcasing this set of slides titled Corporate Key Performance Indicator Icon Inspiration PDF. The topics addressed in these templates are Corporate Key, Performance Indicator Icon. All the content presented in this PPT design is completely editable. Download it and make adjustments in color, background, font etc. as per your unique business setting.
Disagreement Icon Indicating B2b Challenges Professional PDF
Showcasing this set of slides titled Disagreement Icon Indicating B2b Challenges Professional PDF. The topics addressed in these templates are Disagreement Icon, Indicating B2b, Challenges. All the content presented in this PPT design is completely editable. Download it and make adjustments in color, background, font etc. as per your unique business setting.
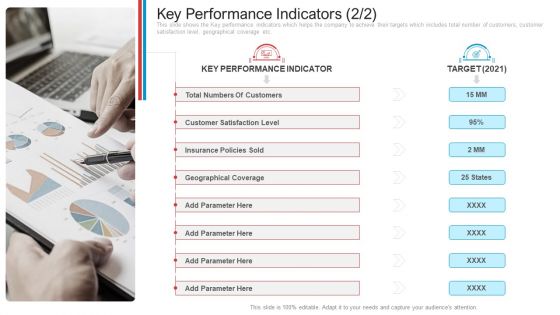
Key Performance Indicators Customers Introduction PDF
This slide shows the Key performance indicators which helps the company to achieve their targets which includes total number of customers, customer satisfaction level, geographical coverage etc. Presenting key performance indicators customers introduction pdf. to provide visual cues and insights. Share and navigate important information on seven stages that need your due attention. This template can be used to pitch topics like total numbers of customers, customer satisfaction level, insurance policies sold, geographical coverage, key performance indicator. In addtion, this PPT design contains high resolution images, graphics, etc, that are easily editable and available for immediate download.
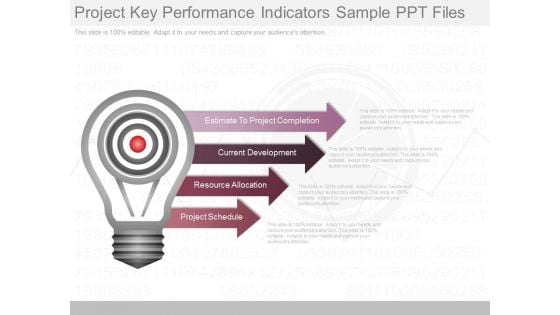
Project Key Performance Indicators Sample Ppt Files
This is a project key performance indicators sample ppt files. This is a four stage process. The stages in this process are estimate to project completion, current development, resource allocation, project schedule.
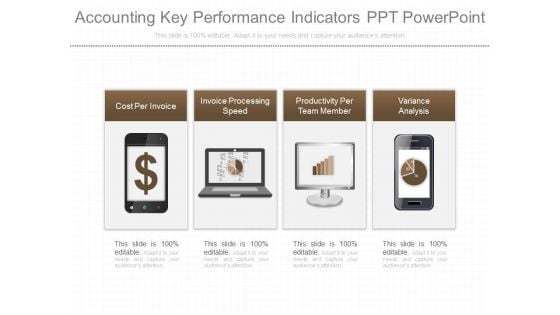
Accounting Key Performance Indicators Ppt Powerpoint
This is a accounting key performance indicators ppt powerpoint. This is a four stage process. The stages in this process are cost per invoice, invoice processing speed, productivity per team member, variance analysis.
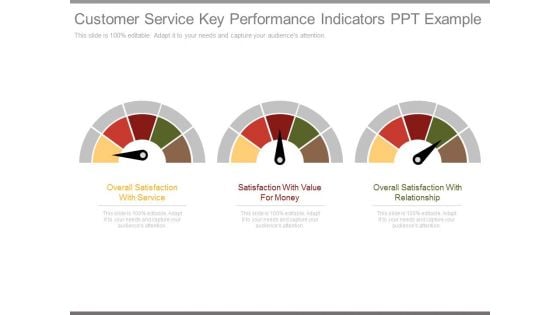
Customer Service Key Performance Indicators Ppt Example
This is a customer service key performance indicators ppt example. This is a three stage process. The stages in this process are overall satisfaction with service, satisfaction with value for money, overall satisfaction with relationship.
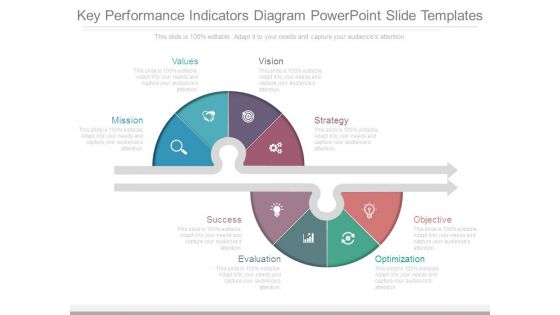
Key Performance Indicators Diagram Powerpoint Slide Templates
This is a key performance indicators diagram powerpoint slide templates. This is a eight stage process. The stages in this process are mission, values, vision, strategy, success, evaluation, optimization, objective.
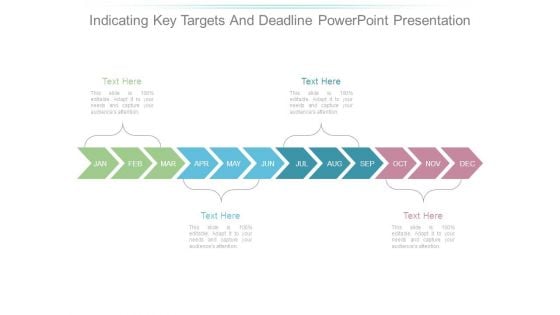
Indicating Key Targets And Deadline Powerpoint Presentation
This is a indicating key targets and deadline powerpoint presentation. This is a four stage process. The stages in this process are jan, feb, mar, apr, may, jun, jul, aug, sep, oct, nov, dec.

Indicating Key Targets And Deadline Powerpoint Ideas
This is a indicating key targets and deadline powerpoint ideas. This is a four stage process. The stages in this process are jan, feb, mar, apr, may, jun, jul, aug, sep, oct, nov, dec.
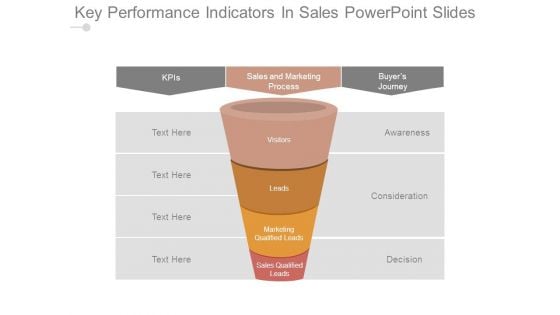
Key Performance Indicators In Sales Powerpoint Slides
This is a key performance indicators in sales powerpoint slides. This is a four stage process. The stages in this process are kpis, sales and marketing process, buyers journey, awareness, consideration, decision, visitors, leads, marketing qualified leads, sales qualified leads.
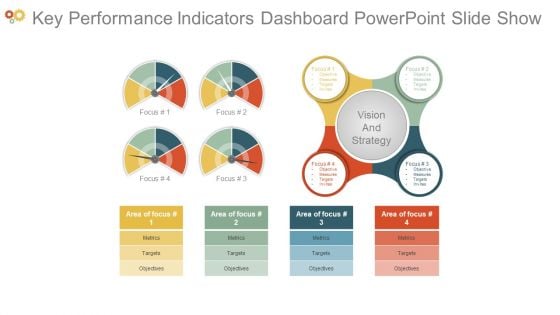
Key Performance Indicators Dashboard Powerpoint Slide Show
This is a key performance indicators dashboard powerpoint slide show. This is a four stage process. The stages in this process are focus, objective, measures, targets, invites, vision and strategy, area of focus, metrics, objectives.
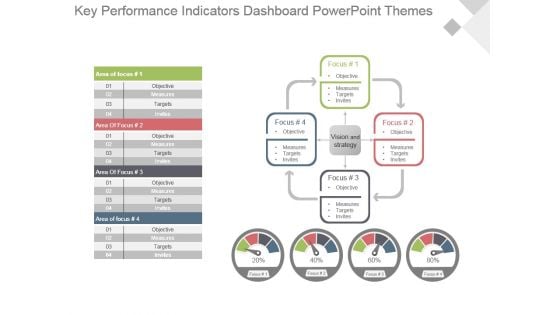
Key Performance Indicators Dashboard Powerpoint Themes
This is a key performance indicators dashboard powerpoint themes. This is a four stage process. The stages in this process are focus, objective, measures, targets, invites, vision and strategy, area of focus.
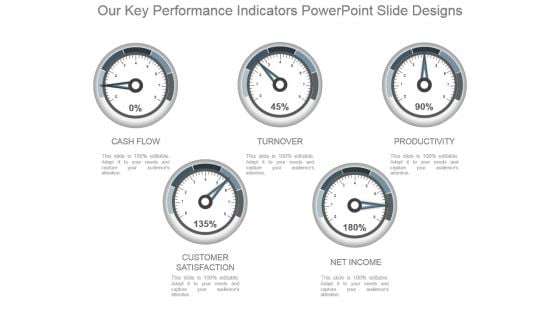
Our Key Performance Indicators Powerpoint Slide Designs
This is a our key performance indicators powerpoint slide designs. This is a five stage process. The stages in this process are cash flow, turnover, productivity, customer satisfaction, net income.
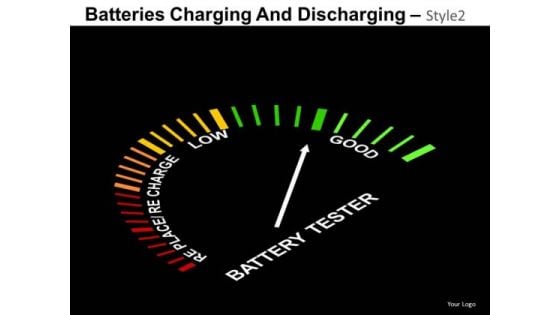
Status Indicator PowerPoint Slides Ppt Templates
Status Indicator PowerPoint Slides PPT Templates-These high quality powerpoint pre-designed slides and powerpoint templates have been carefully created by our professional team to help you impress your audience. All slides have been created and are 100% editable in powerpoint. Each and every property of any graphic - color, size, orientation, shading, outline etc. can be modified to help you build an effective powerpoint presentation. Any text can be entered at any point in the powerpoint template or slide. Simply DOWNLOAD, TYPE and PRESENT! Our Status Indicator PowerPoint Slides Ppt Templates believe in fair play. They adhere to the ethics of it all.
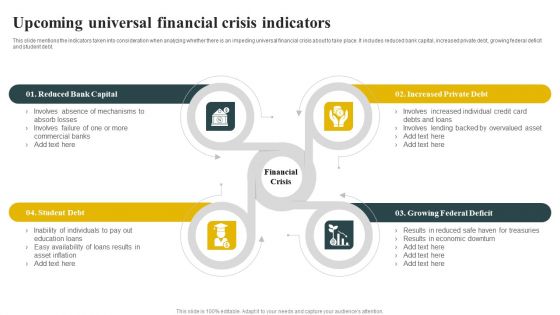
Upcoming Universal Financial Crisis Indicators Themes PDF
This slide mentions the indicators taken into consideration when analyzing whether there is an impeding universal financial crisis about to take place. It includes reduced bank capital, increased private debt, growing federal deficit and student debt. Persuade your audience using this Upcoming Universal Financial Crisis Indicators Themes PDF. This PPT design covers four stages, thus making it a great tool to use. It also caters to a variety of topics including Reduced Bank Capital, Increased Private Debt, Growing Federal Deficit, Student Debt. Download this PPT design now to present a convincing pitch that not only emphasizes the topic but also showcases your presentation skills.
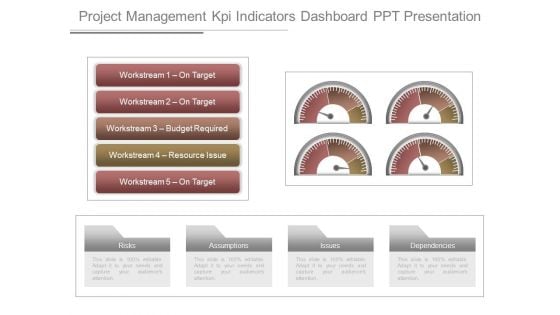
Project Management Kpi Indicators Dashboard Ppt Presentation
This is a project management kpi indicators dashboard ppt presentation. This is a three stage process. The stages in this process are workstream 1 on target, workstream 2 on target, workstream 3 budget required, workstream 4 resource issue, workstream 5 on target.


 Continue with Email

 Home
Home


