Rating Meter

Create A Restaurant Marketing KPI Measuring After Implementing Restaurant
The following slide showcases various key performance indicators KPIs through which marketers can evaluate the success of traditional marketing performance. The metrics mentioned in slide are customer acquisition cost CAC , cross-sells, referrals, sales per square foot, repeat purchase rate, foot traffic, average order value, etc. Crafting an eye-catching presentation has never been more straightforward. Let your presentation shine with this tasteful yet straightforward Create A Restaurant Marketing KPI Measuring After Implementing Restaurant template. It offers a minimalistic and classy look that is great for making a statement. The colors have been employed intelligently to add a bit of playfulness while still remaining professional. Construct the ideal Create A Restaurant Marketing KPI Measuring After Implementing Restaurant that effortlessly grabs the attention of your audience Begin now and be certain to wow your customers The following slide showcases various key performance indicators KPIs through which marketers can evaluate the success of traditional marketing performance. The metrics mentioned in slide are customer acquisition cost CAC , cross-sells, referrals, sales per square foot, repeat purchase rate, foot traffic, average order value, etc.
Relationship Management Automation Impact Of Supplier Relationship Management
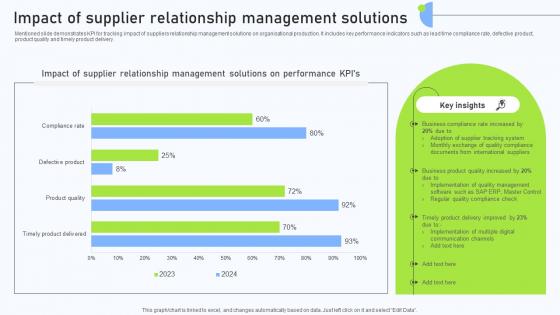
Mentioned slide demonstrates KPI for tracking impact of suppliers relationship management solutions on organisational production. It includes key performance indicators such as lead time compliance rate, defective product, product quality and timely product delivery. Formulating a presentation can take up a lot of effort and time, so the content and message should always be the primary focus. The visuals of the PowerPoint can enhance the presenters message, so our Relationship Management Automation Impact Of Supplier Relationship Management was created to help save time. Instead of worrying about the design, the presenter can concentrate on the message while our designers work on creating the ideal templates for whatever situation is needed. Slidegeeks has experts for everything from amazing designs to valuable content, we have put everything into Relationship Management Automation Impact Of Supplier Relationship Management Mentioned slide demonstrates KPI for tracking impact of suppliers relationship management solutions on organisational production. It includes key performance indicators such as lead time compliance rate, defective product, product quality and timely product delivery.
Relationship Management Strategies Impact On Employee Productivity
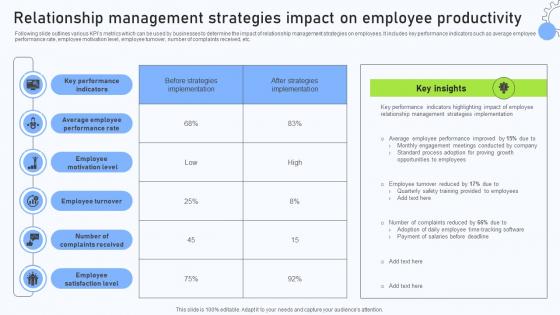
Following slide outlines various KPIs metrics which can be used by businesses to determine the impact of relationship management strategies on employees. It includes key performance indicators such as average employee performance rate, employee motivation level, employee turnover, number of complaints received, etc. If you are looking for a format to display your unique thoughts, then the professionally designed Relationship Management Strategies Impact On Employee Productivity is the one for you. You can use it as a Google Slides template or a PowerPoint template. Incorporate impressive visuals, symbols, images, and other charts. Modify or reorganize the text boxes as you desire. Experiment with shade schemes and font pairings. Alter, share or cooperate with other people on your work. Download Relationship Management Strategies Impact On Employee Productivity and find out how to give a successful presentation. Present a perfect display to your team and make your presentation unforgettable. Following slide outlines various KPIs metrics which can be used by businesses to determine the impact of relationship management strategies on employees. It includes key performance indicators such as average employee performance rate, employee motivation level, employee turnover, number of complaints received, etc.

Post Digitalization Analysing The Impact On Retail Optimizing Retail Operations With Digital DT SS V
This slide help analyses the improving performance of key performance indicators of retail companies after successful digitalization. It includes online sales growth, cart abandonment rate, customer complaints, inventory inaccuracy, time-to-market, supply chain efficiency, foot traffic, and marketing ROI.This Post Digitalization Analysing The Impact On Retail Optimizing Retail Operations With Digital DT SS V is perfect for any presentation, be it in front of clients or colleagues. It is a versatile and stylish solution for organizing your meetings. The Post Digitalization Analysing The Impact On Retail Optimizing Retail Operations With Digital DT SS V features a modern design for your presentation meetings. The adjustable and customizable slides provide unlimited possibilities for acing up your presentation. Slidegeeks has done all the homework before launching the product for you. So, do not wait, grab the presentation templates today This slide help analyses the improving performance of key performance indicators of retail companies after successful digitalization. It includes online sales growth, cart abandonment rate, customer complaints, inventory inaccuracy, time-to-market, supply chain efficiency, foot traffic, and marketing ROI.
Impact Analysis Supply Chain Optimization DT SS V
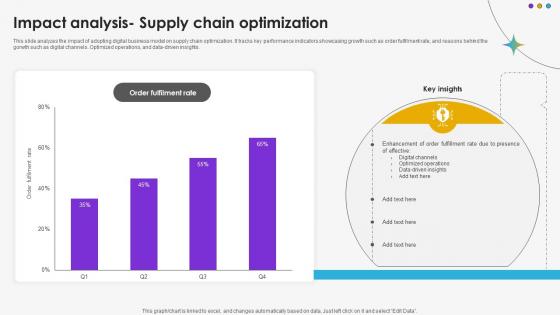
This slide analyzes the impact of adopting digital business model on supply chain optimization. It tracks key performance indicators showcasing growth such as order fulfilment rate, and reasons behind the gorwth such as digital channels. Optimized operations, and data-driven insights.Whether you have daily or monthly meetings, a brilliant presentation is necessary. Impact Analysis Supply Chain Optimization DT SS V can be your best option for delivering a presentation. Represent everything in detail using Impact Analysis Supply Chain Optimization DT SS V and make yourself stand out in meetings. The template is versatile and follows a structure that will cater to your requirements. All the templates prepared by Slidegeeks are easy to download and edit. Our research experts have taken care of the corporate themes as well. So, give it a try and see the results. This slide analyzes the impact of adopting digital business model on supply chain optimization. It tracks key performance indicators showcasing growth such as order fulfilment rate, and reasons behind the gorwth such as digital channels. Optimized operations, and data-driven insights.
Marketing Growth Strategy Kpis To Measure Success Of Field Marketing Campaign Strategy SS V
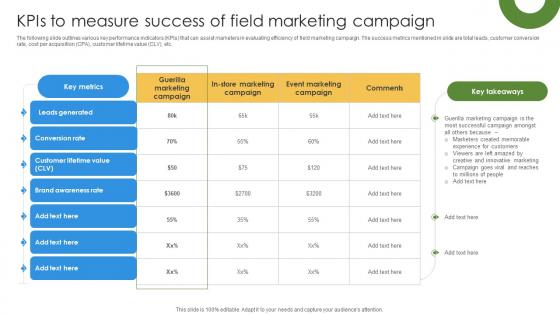
The following slide outlines various key performance indicators KPIs that can assist marketers in evaluating efficiency of field marketing campaign. The success metrics mentioned in slide are total leads, customer conversion rate, cost per acquisition CPA, customer lifetime value CLV, etc. Welcome to our selection of the Marketing Growth Strategy Kpis To Measure Success Of Field Marketing Campaign Strategy SS V. These are designed to help you showcase your creativity and bring your sphere to life. Planning and Innovation are essential for any business that is just starting out. This collection contains the designs that you need for your everyday presentations. All of our PowerPoints are 100Percent editable, so you can customize them to suit your needs. This multi-purpose template can be used in various situations. Grab these presentation templates today. The following slide outlines various key performance indicators KPIs that can assist marketers in evaluating efficiency of field marketing campaign. The success metrics mentioned in slide are total leads, customer conversion rate, cost per acquisition CPA, customer lifetime value CLV, etc.

Digital Content Performance Assessment Top Of The Funnel Digital Content Strategy SS V
The following slide depicts key performance indicators of digital content marketing to monitor results. It includes elements such as page views, social shares, click through rate, blog subscribers, conversions, opportunities influenced, average time on page etc. Find highly impressive Digital Content Performance Assessment Top Of The Funnel Digital Content Strategy SS V on Slidegeeks to deliver a meaningful presentation. You can save an ample amount of time using these presentation templates. No need to worry to prepare everything from scratch because Slidegeeks experts have already done a huge research and work for you. You need to download Digital Content Performance Assessment Top Of The Funnel Digital Content Strategy SS V for your upcoming presentation. All the presentation templates are 100 percent editable and you can change the color and personalize the content accordingly. Download now The following slide depicts key performance indicators of digital content marketing to monitor results. It includes elements such as page views, social shares, click through rate, blog subscribers, conversions, opportunities influenced, average time on page etc.
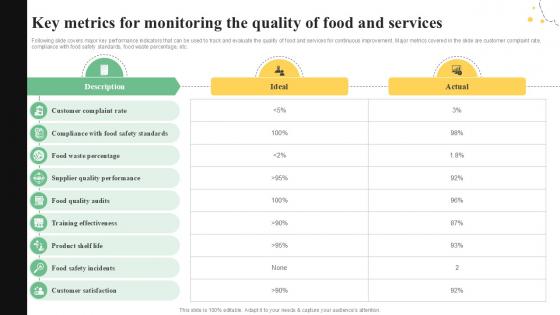
Key Metrics For Monitoring The Quality Control Guide For Food PPT Slide
Following slide covers major key performance indicators that can be used to track and evaluate the quality of food and services for continuous improvement. Major metrics covered in the slide are customer complaint rate, compliance with food safety standards, food waste percentage, etc. Explore a selection of the finest Key Metrics For Monitoring The Quality Control Guide For Food PPT Slide here. With a plethora of professionally designed and pre-made slide templates, you can quickly and easily find the right one for your upcoming presentation. You can use our Key Metrics For Monitoring The Quality Control Guide For Food PPT Slide to effectively convey your message to a wider audience. Slidegeeks has done a lot of research before preparing these presentation templates. The content can be personalized and the slides are highly editable. Grab templates today from Slidegeeks. Following slide covers major key performance indicators that can be used to track and evaluate the quality of food and services for continuous improvement. Major metrics covered in the slide are customer complaint rate, compliance with food safety standards, food waste percentage, etc.

Effective KPIs For Recruitment Employee Attraction And Competency Ppt Presentation
This slide shows main key performance indicators that are used to measure various aspects related to hiring. It include KPIs such as time to hire, cost per hire and attrition rate, etc. Whether you have daily or monthly meetings, a brilliant presentation is necessary. Effective KPIs For Recruitment Employee Attraction And Competency Ppt Presentation can be your best option for delivering a presentation. Represent everything in detail using Effective KPIs For Recruitment Employee Attraction And Competency Ppt Presentation and make yourself stand out in meetings. The template is versatile and follows a structure that will cater to your requirements. All the templates prepared by Slidegeeks are easy to download and edit. Our research experts have taken care of the corporate themes as well. So, give it a try and see the results. This slide shows main key performance indicators that are used to measure various aspects related to hiring. It include KPIs such as time to hire, cost per hire and attrition rate, etc.
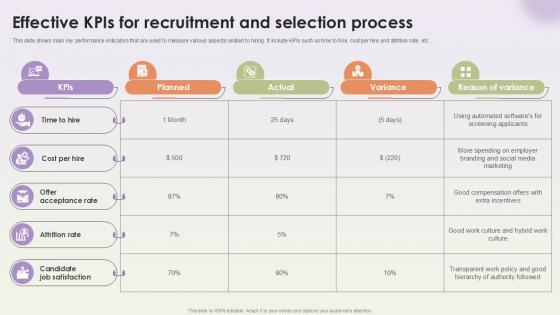
Effective Kpis For Recruitment And Selection Workforce Procurement And Aptitude Evaluation Ppt Presentation
This slide shows main key performance indicators that are used to measure various aspects related to hiring. It include KPIs such as time to hire, cost per hire and attrition rate, etc. Whether you have daily or monthly meetings, a brilliant presentation is necessary. Effective Kpis For Recruitment And Selection Workforce Procurement And Aptitude Evaluation Ppt Presentation can be your best option for delivering a presentation. Represent everything in detail using Effective Kpis For Recruitment And Selection Workforce Procurement And Aptitude Evaluation Ppt Presentation and make yourself stand out in meetings. The template is versatile and follows a structure that will cater to your requirements. All the templates prepared by Slidegeeks are easy to download and edit. Our research experts have taken care of the corporate themes as well. So, give it a try and see the results. This slide shows main key performance indicators that are used to measure various aspects related to hiring. It include KPIs such as time to hire, cost per hire and attrition rate, etc.

Empty Funds Finance PowerPoint Template 0610
Cash gauge on the dashboard approaching empty value Keep the camera trained on you with our Empty Funds Finance PowerPoint Template 0610. Just download, type and present.
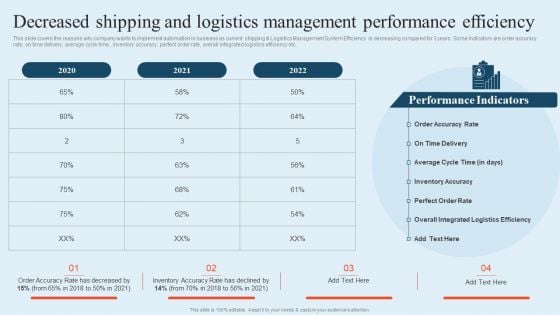
Integrating Logistics Automation Solution Decreased Shipping And Logistics Management Performance Ppt File Background Image PDF
This slide covers the reasons why company wants to implement automation in business as current shipping and Logistics Management System Efficiency is decreasing compared for 3 years. Some indicators are order accuracy rate, on time delivery, average cycle time , inventory accuracy, perfect order rate, overall integrated logistics efficiency etc. Here you can discover an assortment of the finest PowerPoint and Google Slides templates. With these templates, you can create presentations for a variety of purposes while simultaneously providing your audience with an eye-catching visual experience. Download Integrating Logistics Automation Solution Decreased Shipping And Logistics Management Performance Ppt File Background Image PDF to deliver an impeccable presentation. These templates will make your job of preparing presentations much quicker, yet still, maintain a high level of quality. Slidegeeks has experienced researchers who prepare these templates and write high-quality content for you. Later on, you can personalize the content by editing the Integrating Logistics Automation Solution Decreased Shipping And Logistics Management Performance Ppt File Background Image PDF.
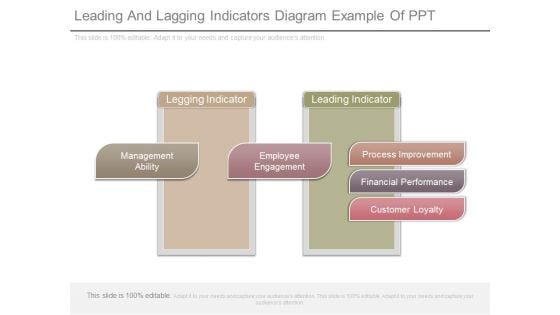
Leading And Lagging Indicators Diagram Example Of Ppt
This is a leading and lagging indicators diagram example of ppt. This is a two stage process. The stages in this process are legging indicator, management ability, employee engagement, leading indicator, process improvement, financial performance, customer loyalty.
Market Leading Indicators Ppt PowerPoint Presentation Model Maker Cpb
This is a market leading indicators ppt powerpoint presentation model maker cpb. This is a three stage process. The stages in this process are market leading indicators.
Company Performance Indicators Ppt PowerPoint Presentation Diagram Images
This is a company performance indicators ppt powerpoint presentation diagram images. This is a six stage process. The stages in this process are company performance indicators.

Key Performance Indicators Company Ppt PowerPoint Presentation Slides Model
This is a key performance indicators company ppt powerpoint presentation slides model. This is a three stage process. The stages in this process are key performance indicators company.
Performance Indicators Business Ppt PowerPoint Presentation Inspiration Design Templates
This is a performance indicators business ppt powerpoint presentation inspiration design templates. This is a four stage process. The stages in this process are performance indicators business.
Business Performance Indicators Ppt PowerPoint Presentation Visual Aids Diagrams Cpb
This is a business performance indicators ppt powerpoint presentation visual aids diagrams cpb. This is a four stage process. The stages in this process are business performance indicators.
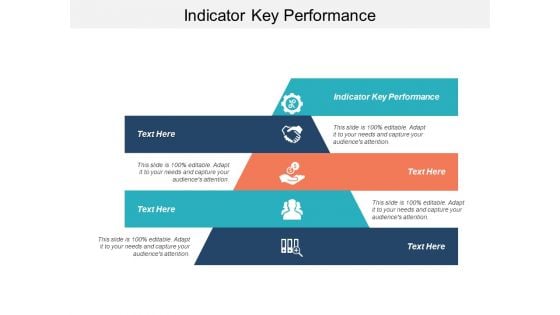
Indicator Key Performance Ppt PowerPoint Presentation Inspiration Mockup
This is a indicator key performance ppt powerpoint presentation inspiration mockup. This is a five stage process. The stages in this process are indicator key performance.

Key Process Indicators Ppt PowerPoint Presentation Portfolio Tips
This is a key process indicators ppt powerpoint presentation portfolio tips. This is a six stage process. The stages in this process are key process indicators.
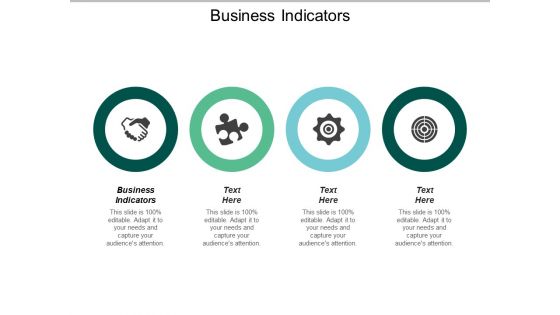
Business Indicators Ppt PowerPoint Presentation Gallery Tips Cpb
This is a business indicators ppt powerpoint presentation gallery tips cpb. This is a four stage process. The stages in this process are business indicators.
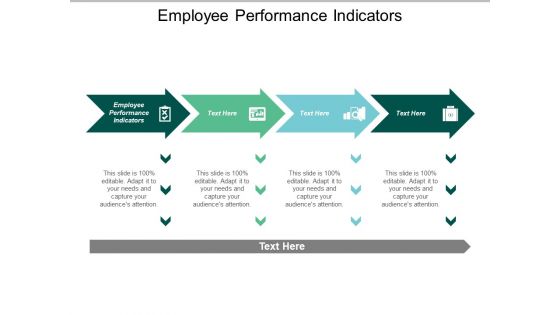
Employee Performance Indicators Ppt PowerPoint Presentation Inspiration Background Cpb
This is a employee performance indicators ppt powerpoint presentation inspiration background cpb. This is a four stage process. The stages in this process are employee performance indicators.
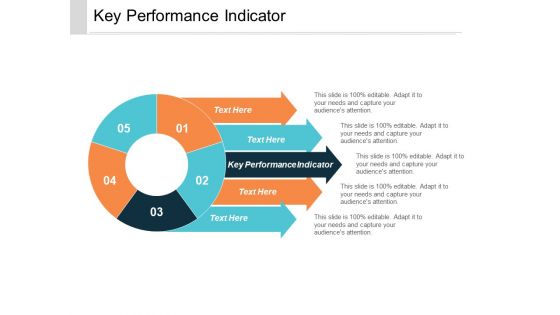
Key Performance Indicator Ppt PowerPoint Presentation Professional Templates Cpb
This is a key performance indicator ppt powerpoint presentation professional templates cpb. This is a five stage process. The stages in this process are key performance indicator.

Key Performance Indicators KPI Ppt PowerPoint Presentation Infographics Cpb
This is a key performance indicators kpi ppt powerpoint presentation infographics cpb. This is a five stage process. The stages in this process are key performance indicators kpi.
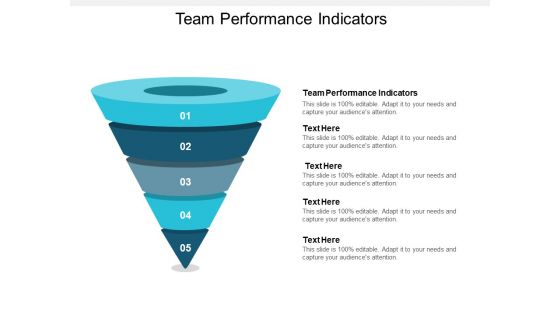
Team Performance Indicators Ppt PowerPoint Presentation Show Guidelines Cpb
This is a team performance indicators ppt powerpoint presentation show guidelines cpb. This is a five stage process. The stages in this process are team performance indicators.
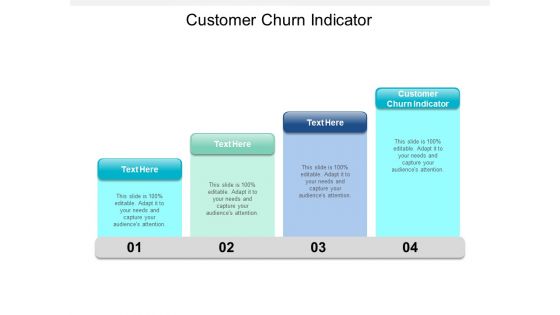
Customer Churn Indicator Ppt PowerPoint Presentation Infographic Template Designs Cpb
This is a customer churn indicator ppt powerpoint presentation infographic template designs cpb. This is a four stage process. The stages in this process are customer churn indicator.
Economic Indicator Forecasts Ppt PowerPoint Presentation Summary Design Ideas Cpb
This is a economic indicator forecasts ppt powerpoint presentation summary design ideas cpb. This is a three stage process. The stages in this process are economic indicator forecasts.
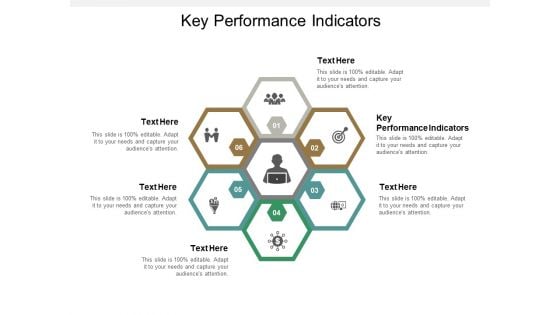
Key Performance Indicators Ppt PowerPoint Presentation Model Format Cpb
This is a key performance indicators ppt powerpoint presentation model format cpb. This is a six stage process. The stages in this process are key performance indicators.
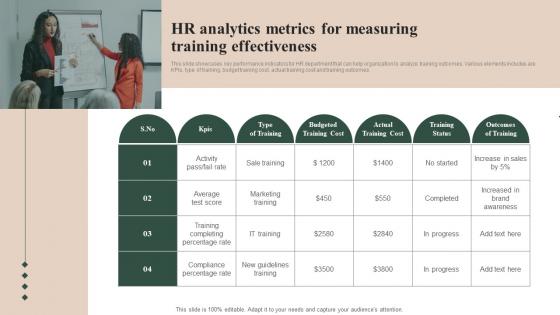
HR Analytics Metrics For Measuring Training Effectiveness Infographics Pdf
This slide showcases key performance indicators for HR department that can help organization to analyze training outcomes. Various elements includes are KPIs, type of training, budget training cost, actual training cost and training outcomes Showcasing this set of slides titled HR Analytics Metrics For Measuring Training Effectiveness Infographics Pdf The topics addressed in these templates are Percentage Rate, Training Completing, Marketing Training All the content presented in this PPT design is completely editable. Download it and make adjustments in color, background, font etc. as per your unique business setting. This slide showcases key performance indicators for HR department that can help organization to analyze training outcomes. Various elements includes are KPIs, type of training, budget training cost, actual training cost and training outcomes.
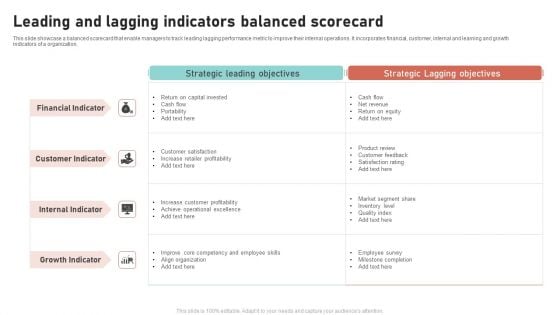
Leading And Lagging Indicators Balanced Scorecard Pictures PDF
This slide showcase a balanced scorecard that enable managers to track leading lagging performance metric to improve their internal operations. It incorporates financial, customer, internal and learning and growth indicators of a organization. Pitch your topic with ease and precision using this Leading And Lagging Indicators Balanced Scorecard Pictures PDF. This layout presents information on Financial Indicator, Customer Indicator, Internal Indicator, Growth Indicator. It is also available for immediate download and adjustment. So, changes can be made in the color, design, graphics or any other component to create a unique layout.
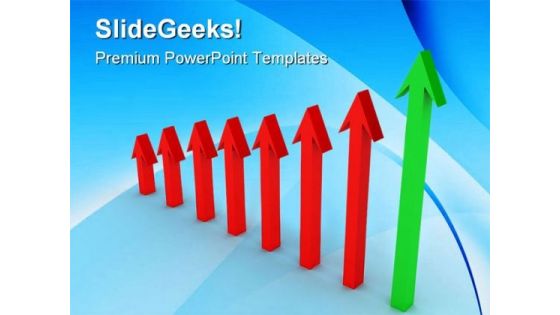
Arrow Indicating Profit Success PowerPoint Templates And PowerPoint Backgrounds 0511
Microsoft PowerPoint Template and Background with three dimensional arrow indicating profit over loss Curb assumptions with our Arrow Indicating Profit Success PowerPoint Templates And PowerPoint Backgrounds 0511. Face up to them with the facts.
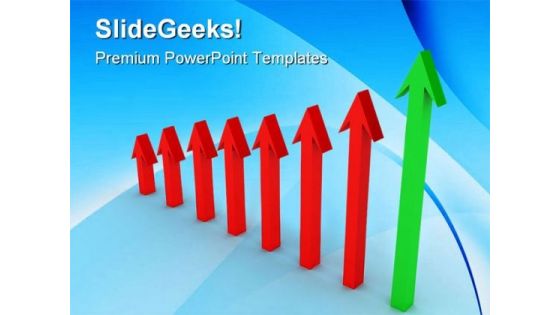
Arrow Indicating Profit Success PowerPoint Themes And PowerPoint Slides 0511
Microsoft PowerPoint Theme and Slide with three dimensional arrow indicating profit over loss Compel your team with our Arrow Indicating Profit Success PowerPoint Themes And PowerPoint Slides 0511. Download without worries with our money back guaranteee.
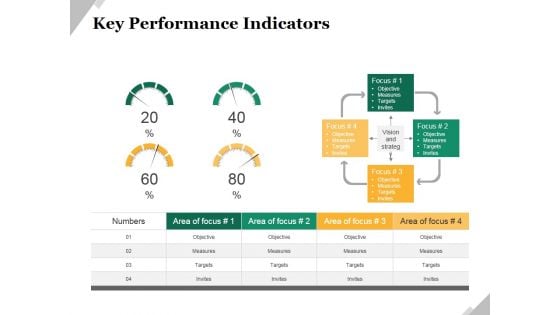
Key Performance Indicators Template 2 Ppt PowerPoint Presentation Model Example
This is a key performance indicators template 2 ppt powerpoint presentation model example. This is a four stage process. The stages in this process are objective, measures, targets, invites, indicators.
Team Performance Indicators Business Finance Ppt PowerPoint Presentation Icon Clipart
This is a team performance indicators business finance ppt powerpoint presentation icon clipart. This is a two stage process. The stages in this process are team, performance, indicators, business, finance.
Kpi Performance Indicators Examples Ppt Powerpoint Presentation Outline Slides Cpb
This is a kpi performance indicators examples ppt powerpoint presentation outline slides cpb. This is a four stage process. The stages in this process are kpi performance indicators examples.
Customer Service Performance Indicators Ppt Powerpoint Presentation Ideas Slide Cpb
This is a customer service performance indicators ppt powerpoint presentation ideas slide cpb. This is a five stage process. The stages in this process are customer service performance indicators.
Key Performance Indicator Example Ppt Powerpoint Presentation Icon Grid Cpb
This is a key performance indicator example ppt powerpoint presentation icon grid cpb. This is a four stage process. The stages in this process are key performance indicator example.
Business Key Performance Indicators Ppt PowerPoint Presentation File Rules Cpb
This is a business key performance indicators ppt powerpoint presentation file rules cpb. This is a four stage process. The stages in this process are business key performance indicators.
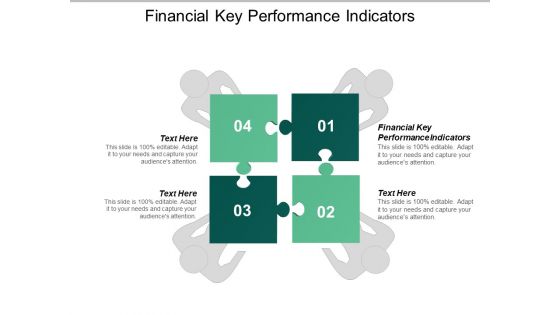
Financial Key Performance Indicators Ppt PowerPoint Presentation Ideas Aids Cpb
This is a financial key performance indicators ppt powerpoint presentation ideas aids cpb. This is a four stage process. The stages in this process are financial key performance indicators.

Key Performance Indicator Examples Ppt PowerPoint Presentation Outline Clipart Cpb
This is a key performance indicator examples ppt powerpoint presentation outline clipart cpb. This is a four stage process. The stages in this process are key performance indicator examples.
Key Performance Indicators Employees Ppt PowerPoint Presentation Icon Samples Cpb
This is a key performance indicators employees ppt powerpoint presentation icon samples cpb. This is a two stage process. The stages in this process are key performance indicators employees.
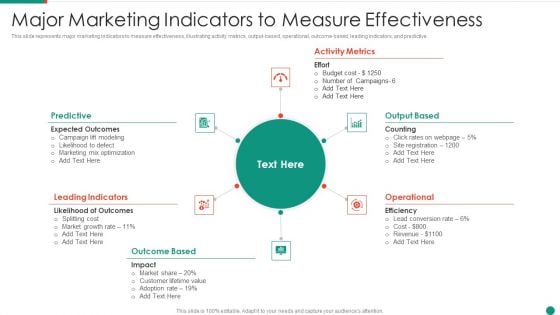
Major Marketing Indicators To Measure Effectiveness Mockup PDF
This slide represents major marketing indicators to measure effectiveness, illustrating activity metrics, output-based, operational, outcome-based, leading indicators, and predictive.Presenting Major Marketing Indicators To Measure Effectiveness Mockup PDF to dispense important information. This template comprises six stages. It also presents valuable insights into the topics including Leading Indicators, Outcome Based, Activity Metrics This is a completely customizable PowerPoint theme that can be put to use immediately. So, download it and address the topic impactfully.
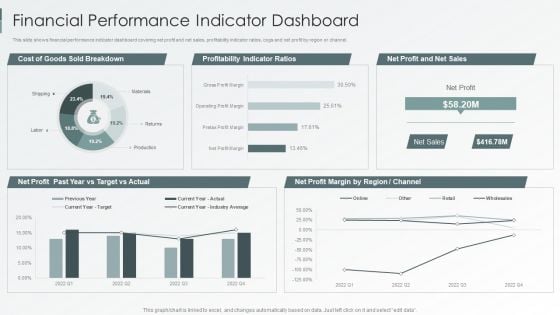
Enterprise Sustainability Performance Metrics Financial Performance Indicator Dashboard Themes PDF
This slide shows financial performance indicator dashboard covering net profit and net sales, profitability indicator ratios, cogs and net profit by region or channel.Deliver an awe inspiring pitch with this creative Enterprise Sustainability Performance Metrics Financial Performance Indicator Dashboard Themes PDF bundle. Topics like Profitability Indicator, Sold Breakdown, Target Actual can be discussed with this completely editable template. It is available for immediate download depending on the needs and requirements of the user.

5S Audit Checklist With Frequency And Location Indicators Background PDF
Deliver an awe inspiring pitch with this creative 5S Audit Checklist With Frequency And Location Indicators Background PDF bundle. Topics like Minimum And Maximum, Quantity Indicators, Location Indicators can be discussed with this completely editable template. It is available for immediate download depending on the needs and requirements of the user.
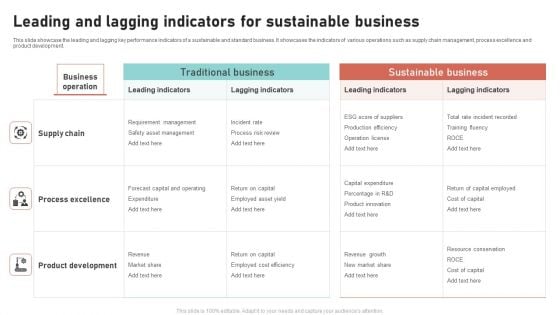
Leading And Lagging Indicators For Sustainable Business Rules PDF
This slide showcase the leading and lagging key performance indicators of a sustainable and standard business. It showcases the indicators of various operations such as supply chain management, process excellence and product development. Showcasing this set of slides titled Leading And Lagging Indicators For Sustainable Business Rules PDF. The topics addressed in these templates are Leading Indicators, Lagging Indicators, Automobile Industries. All the content presented in this PPT design is completely editable. Download it and make adjustments in color, background, font etc. as per your unique business setting.
Dashboard For Tracking Global Share Market Indices Formats PDF
Following slide represent a comprehensive dashboard to track stock market indices of different countries. The indices mentioned in the slide are DOW jones, NASDAQ, S and P along with the highest and lowest price of indices on a particular day. Showcasing this set of slides titled Dashboard For Tracking Global Share Market Indices Formats PDF. The topics addressed in these templates are Global Share, Market Indices, Abbreviations. All the content presented in this PPT design is completely editable. Download it and make adjustments in color, background, font etc. as per your unique business setting.
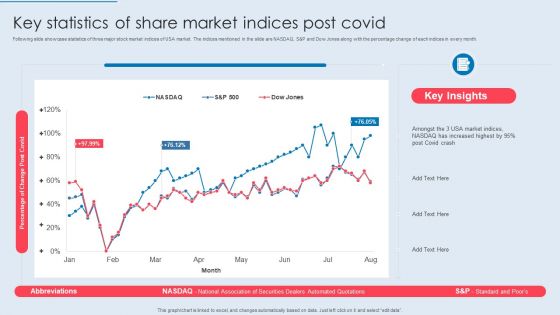
Key Statistics Of Share Market Indices Post Covid Sample PDF
Following slide showcase statistics of three major stock market indices of USA market. The indices mentioned in the slide are NASDAQ, S and P and Dow Jones along with the percentage change of each indices in every month. Showcasing this set of slides titled Key Statistics Of Share Market Indices Post Covid Sample PDF. The topics addressed in these templates are Percentage Change Post Covid, Increased Highest, Indices Post Covid. All the content presented in this PPT design is completely editable. Download it and make adjustments in color, background, font etc. as per your unique business setting.
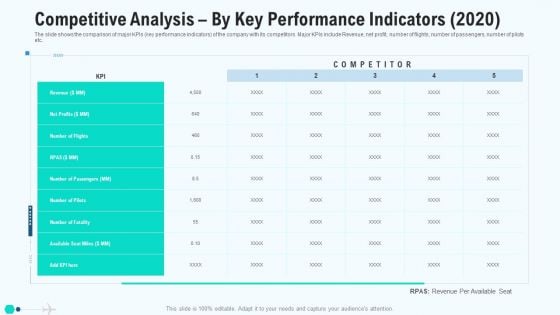
Competitive Analysis By Key Performance Indicators 2020 Elements PDF
The slide shows the comparison of major KPIs key performance indicators of the company with its competitors. Major KPIs include Revenue, net profit, number of flights, number of passengers, number of pilots etc. Deliver an awe inspiring pitch with this creative competitive analysis by key performance indicators 2020 elements pdf bundle. Topics like competitive analysis by key performance indicators can be discussed with this completely editable template. It is available for immediate download depending on the needs and requirements of the user.
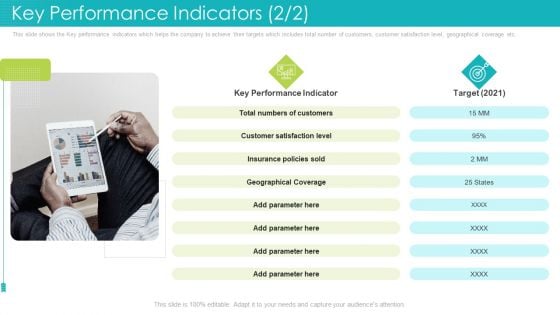
Key Performance Indicators Satisfaction Level Ppt File Deck PDF
This slide shows the Key performance indicators which helps the company to achieve their targets which includes total number of customers, customer satisfaction level, geographical coverage etc. Deliver an awe inspiring pitch with this creative key performance indicators satisfaction level ppt file deck pdf bundle. Topics like key performance indicator, customer satisfaction level, geographical coverage, target can be discussed with this completely editable template. It is available for immediate download depending on the needs and requirements of the user.
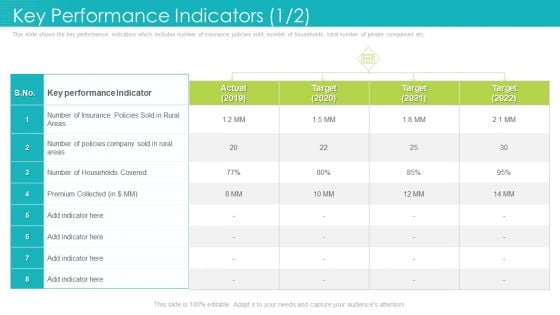
Key Performance Indicators Target Ppt File Graphics Download PDF
This slide shows the key performance indicators which includes number of insurance policies sold, number of households, total number of private companies etc. Deliver and pitch your topic in the best possible manner with this key performance indicators target ppt file graphics download pdf. Use them to share invaluable insights on key performance indicators, 2019 to 2022 and impress your audience. This template can be altered and modified as per your expectations. So, grab it now.
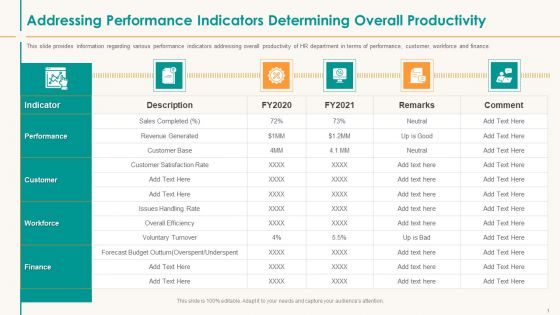
Addressing Performance Indicators Determining Overall Productivity Download PDF
This slide provides information regarding various performance indicators addressing overall productivity of HR department in terms of performance, customer, workforce and finance. Deliver an awe-inspiring pitch with this creative addressing performance indicators determining overall productivity download pdf. bundle. Topics like indicator, performance, customer, workforce, finance can be discussed with this completely editable template. It is available for immediate download depending on the needs and requirements of the user.
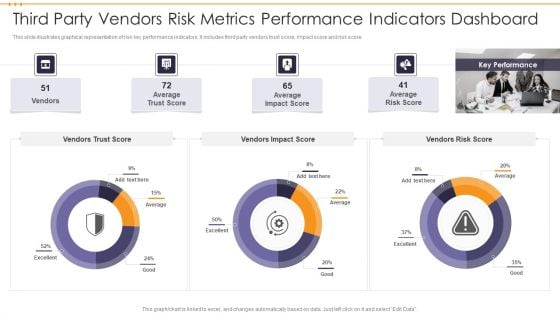
Third Party Vendors Risk Metrics Performance Indicators Dashboard Topics PDF
This slide illustrates graphical representation of risk key performance indicators. It includes third party vendors trust score, impact score and risk score. Pitch your topic with ease and precision using this Third Party Vendors Risk Metrics Performance Indicators Dashboard Topics PDF. This layout presents information on Third Party Vendors Risk Metrics Performance Indicators Dashboard. It is also available for immediate download and adjustment. So, changes can be made in the color, design, graphics or any other component to create a unique layout.
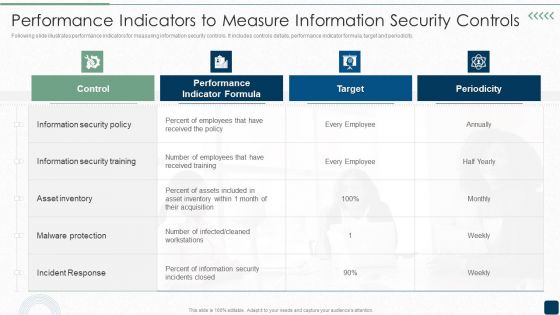
Performance Indicators To Measure Information Security Controls Brochure PDF
Following slide illustrates performance indicators for measuring information security controls. It includes controls details, performance indicator formula, target and periodicity.Deliver an awe inspiring pitch with this creative Performance Indicators To Measure Information Security Controls Brochure PDF bundle. Topics like Information Security, Security Training, Malware Protection can be discussed with this completely editable template. It is available for immediate download depending on the needs and requirements of the user.
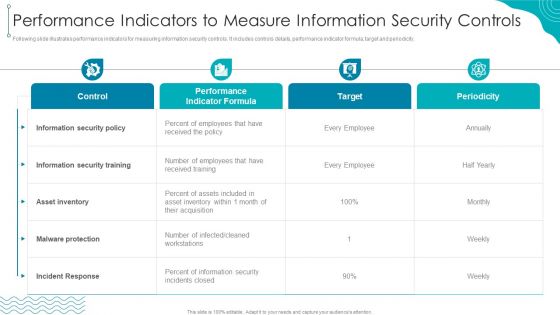
Performance Indicators To Measure Information Security Controls Designs PDF
Following slide illustrates performance indicators for measuring information security controls. It includes controls details, performance indicator formula, target and periodicity.Deliver an awe inspiring pitch with this creative Performance Indicators To Measure Information Security Controls Designs PDF bundle. Topics like Information security, received training, Incident Response can be discussed with this completely editable template. It is available for immediate download depending on the needs and requirements of the user.
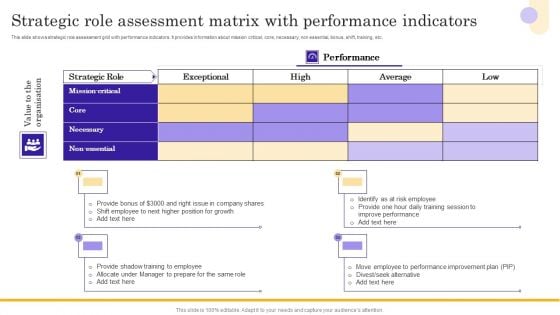
Strategic Role Assessment Matrix With Performance Indicators Themes PDF
This slide shows strategic role assessment grid with performance indicators. It provides information about mission critical, core, necessary, non essential, bonus, shift, training, etc. Pitch your topic with ease and precision using this Strategic Role Assessment Matrix With Performance Indicators Themes PDF. This layout presents information on Strategic Role Assessment, Matrix With Performance Indicators. It is also available for immediate download and adjustment. So, changes can be made in the color, design, graphics or any other component to create a unique layout.
Ppt Slide 3 Different Arrows For Indication Consulting Firms
Get Out Of The Dock With Our PPT Slide 3 different arrows for indication consulting firms Powerpoint Templates. Your Mind Will Be Set Free.
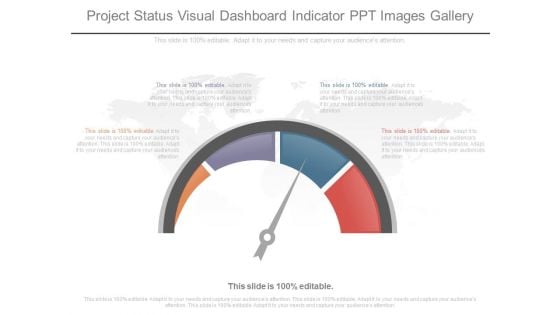
Project Status Visual Dashboard Indicator Ppt Images Gallery
This is a project status visual dashboard indicator ppt images gallery. This is a four stage process. The stages in this process are business, marketing, dashboard, measure, presentation.
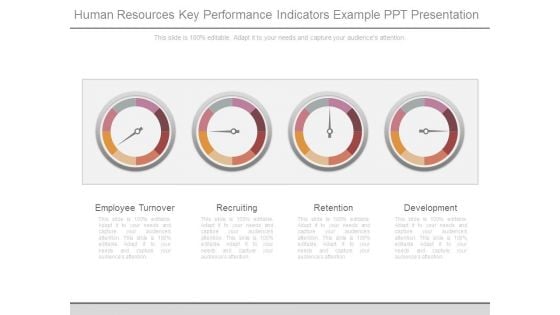
Human Resources Key Performance Indicators Example Ppt Presentation
This is a human resources key performance indicators example ppt presentation. This is a four stage process. The stages in this process are employee turnover, recruiting, retention, development.

Performance Indicators For Web Strategy Example Of Ppt
This is a performance indicators for web strategy example of ppt. This is a three stage process. The stages in this process are market, strategy, culture.

The Problem Analysis And Solution Indication Ppt Examples
This is a the problem analysis and solution indication ppt examples. This is a four stage process. The stages in this process are icons, problem, business, management, finding.


 Continue with Email

 Home
Home


