Score Meter
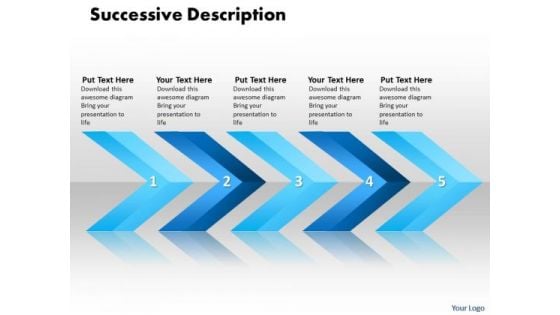
Ppt Linear Arrows 5 State PowerPoint Project Diagram Templates
PPT linear arrows 5 state powerpoint project diagram Templates-This PPT is made of Linear arrows. This graphics is of superlative quality that makes an attractive presentation. This template is quite a remedy to present any process-PPT linear arrows 5 state powerpoint project diagram Templates-Aim, Arrow, Arrowheads, Badge, Border, Click, Connection, Curve, Design, Direction, Download, Element, Fuchsia, Icon, Illustration, Indicator, Internet, Magenta, Mark, Object, Orientation, Pointer, Shadow, Shape, Sign Clever is the basic for our Ppt Linear Arrows 5 State PowerPoint Project Diagram Templates. Brilliance is what your thoughts will achieve.
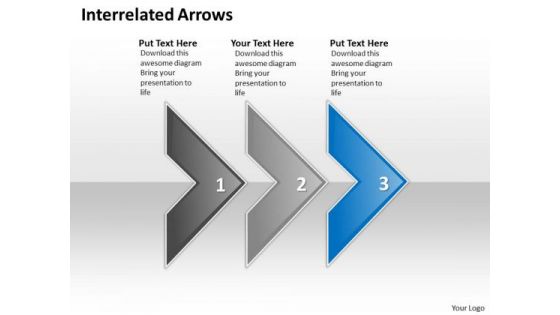
Ppt Interrelated Arrows Three Stages Fashion Design PowerPoint Presentation Templates
PPT interrelated arrows three stages fashion design powerpoint presentation Templates-Aesthetically designed to make a great first impression this template highlights three stages Involved in development process. This PPT image is so perfectly designed to illustrate your ability.-PPT interrelated arrows three stages fashion design powerpoint presentation Templates-Aim, Arrow, Arrowheads, Badge, Border, Click, Connection, Curve, Design, Direction, Download, Element, Fuchsia, Icon, Illustration, Indicator, Internet, Magenta, Mark, Object, Orientation, Pointer, Shadow, Shape, Sign Ecology is a common concern. Express your beliefs with our Ppt Interrelated Arrows Three Stages Fashion Design PowerPoint Presentation Templates.
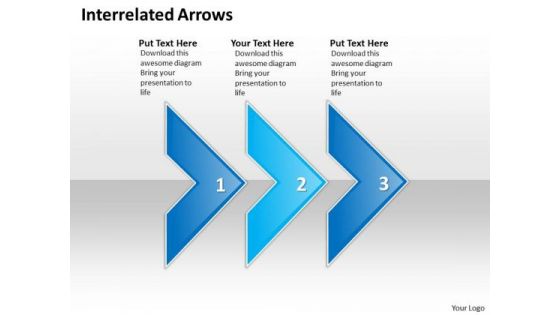
Ppt Linear Arrows Modifying Slide Layouts PowerPoint Three State Diagram Templates
PPT linear arrows modifying slide layouts powerpoint three state diagram Templates-Visually support your ideas and define your message with our above template. This image identifies the concept of stages in process. This attractive image makes your presentations professional and interactive. Deliver amazing presentations to mesmerize your audience.-PPT linear arrows modifying slide layouts powerpoint three state diagram Templates-Aim, Arrow, Arrowheads, Badge, Border, Click, Connection, Curve, Design, Direction, Download, Element, Fuchsia, Icon, Illustration, Indicator, Internet, Magenta, Mark, Object, Orientation, Pointer, Shadow, Shape, Sign Consumer connect with our Ppt Linear Arrows Modifying Slide Layouts PowerPoint Three State Diagram Templates. Enhance customer connectivity of your thoughts.
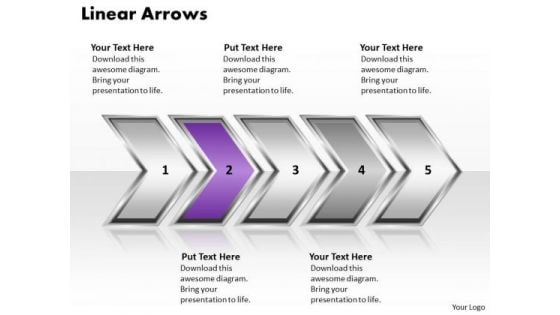
Ppt Linear Demonstration Of Arrows Diagram PowerPoint Slide Text Templates
PPT linear demonstration of arrows diagram powerpoint slide text Templates-This disarm can be used to organize information so that it can be accessed more easily. Pin-point the manner and processes for your team to follow an order. Step by step develop the entire picture and project it onto their minds-PPT linear demonstration of arrows diagram powerpoint slide text Templates-Aim, Arrow, Arrowheads, Badge, Border, Click, Connection, Curve, Design, Direction, Download, Element, Fuchsia, Icon, Illustration, Indicator, Internet, Magenta, Mark, Object, Orientation, Pointer, Shadow, Shape, Sign Search everywhere but find it here. Our Ppt Linear Demonstration Of Arrows Diagram PowerPoint Slide Text Templates catalogue will have it right there.
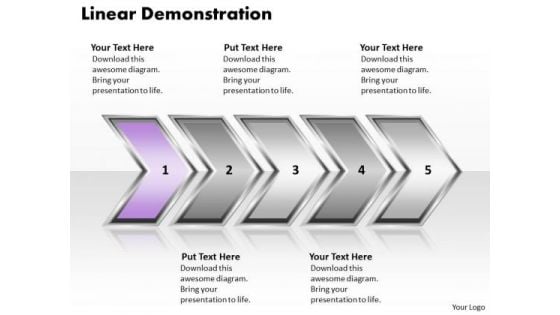
Ppt Linear Demonstration Of Arrows PowerPoint 2010 Org Chart Templates
PPT linear demonstration of arrows powerpoint 2010 org chart Templates-Life and Business is made up of processes comprising stages that flow from one to another. An excellent graphic to attract the attention of and understanding by your audience to improve earnings.-PPT linear demonstration of arrows powerpoint 2010 org chart Templates-Aim, Arrow, Arrowheads, Badge, Border, Click, Connection, Curve, Design, Direction, Download, Element, Fuchsia, Icon, Illustration, Indicator, Internet, Magenta, Mark, Object, Orientation, Pointer, Shadow, Shape, Sign Encourage creativity with our Ppt Linear Demonstration Of Arrows PowerPoint 2010 Org Chart Templates. You will come out on top.
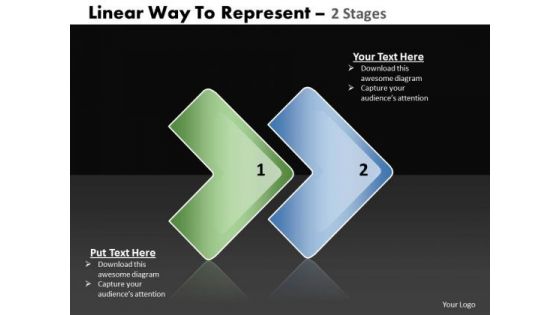
Ppt Linear Way To Show 2 Stages PowerPoint Templates
PPT linear way to show 2 stages PowerPoint Templates-Aesthetically designed to make a great first impression this template highlights two steps Involved in development process. This PPT image is so perfectly designed to illustrate your ability.-PPT linear way to show 2 stages PowerPoint Templates-Aim, Arrow, Arrowheads, Badge, Border, Click, Connection, Curve, Design, Direction, Download, Element, Fuchsia, Icon, Illustration, Indicator, Internet, Magenta, Mark, Object, Orientation, Pointer, Shadow, Shape, Sign Do not leave it all up to fate. Fashion your destiny with our Ppt Linear Way To Show 2 Stages PowerPoint Templates.
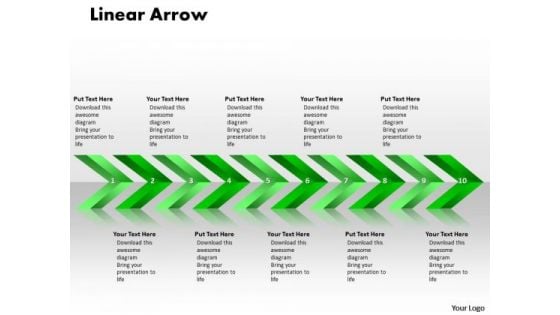
Business Ppt Background Linear Arrows 10 Stages Communication PowerPoint Image
Business PPT Background linear arrows 10 stages communication powerpoint Image-This linear arrow diagram provides a systematic approach to business development process.Strengthen your relationship with your present customers and likely future ones as the occasion has an intrinsic business potential.-Business PPT Background linear arrows 10 stages communication powerpoint Image-Aim, Angle, Arrow, Arrowheads, Badge, Banner, Connection, Curve, Design, Direction, Download, Element, Fuchsia, Icon, Illustration, Indicator, Internet, Label, Link, Magenta, Mark, Marker, Next, Object, Orange, Orientation, Pointer, Shadow, Shape, Signs Symbol Correct the errant with our Business Ppt Background Linear Arrows 10 Stages Communication PowerPoint Image. They will willingly accept your advice.
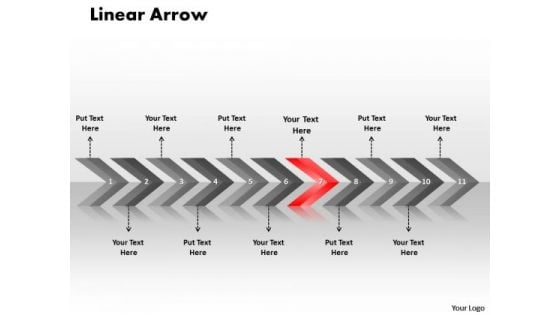
Business Ppt Theme Linear Arrows 11 Power Point Stage Strategy PowerPoint 8 Graphic
Business PPT Theme linear arrows 11 power point stage strategy powerpoint 8 Graphic-Use these Linear Arrows to Illustrate Processes Step by Step in PowerPoint Presentations. This diagram has the unique ability to drive home your ideas and show how they mesh to guarantee success.-Business PPT Theme linear arrows 11 power point stage strategy powerpoint 8 Graphic-Aim, Angle, Arrow, Arrowheads, Badge, Banner, Connection, Curve, Design, Direction, Download, Element, Fuchsia, Icon, Illustration, Indicator, Internet, Label, Link, Magenta, Mark, Marker, Next, Object, Orange, Orientation, Pointer, Shadow, Shape, Signs Symbol Alert your team to possibilities with our Business Ppt Theme Linear Arrows 11 Power Point Stage Strategy PowerPoint 8 Graphic. You will come out on top.
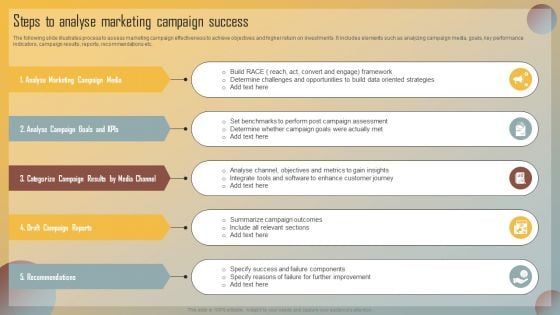
Guide For Marketing Analytics To Improve Decisions Steps To Analyse Marketing Campaign Success Portrait PDF
The following slide illustrates process to assess marketing campaign effectiveness to achieve objectives and higher return on investments. It includes elements such as analyzing campaign media, goals, key performance indicators, campaign results, reports, recommendations etc. If your project calls for a presentation, then Slidegeeks is your go to partner because we have professionally designed, easy to edit templates that are perfect for any presentation. After downloading, you can easily edit Guide For Marketing Analytics To Improve Decisions Steps To Analyse Marketing Campaign Success Portrait PDF and make the changes accordingly. You can rearrange slides or fill them with different images. Check out all the handy templates
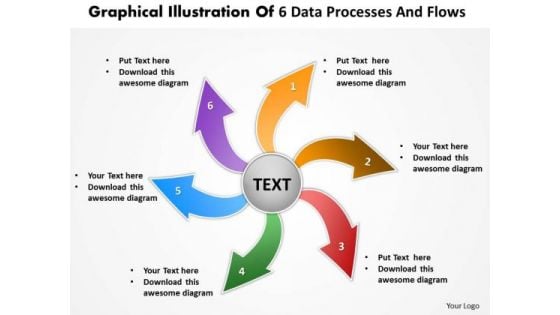
Illustration Of 6 Data Processes And Flows Circular Chart PowerPoint Templates
We present our illustration of 6 data processes and flows Circular Chart PowerPoint templates.Present our Arrows PowerPoint Templates because they are the indicators of the path you have in mind. Download our Circle Charts PowerPoint Templates because the ideas and plans are on your finger tips. Present our Shapes PowerPoint Templates because it shows how one can contribute to the overall feeling of well-being. Download our Business PowerPoint Templates because it will demonstrate the strength of character under severe stress. Shine the torch ahead and bring the light to shine on all. Present our Flow Charts PowerPoint Templates because you know what it takes to keep it fit and healthy.Use these PowerPoint slides for presentations relating to achievement, aim, around, arrow, blue, center, chart, circle, circular, connection, cursor, cycle, cyclic, decisions, direction, flow, graph, graphic, group, icon, illustration, isolated, loop, motion, movement, point, pointer, recycle, recycling, reuse, ring, rotation, round, sign, spin, symbol, target, team, teamwork, technology, turn, wheel, white. The prominent colors used in the PowerPoint template are Red, Green, Blue. Presenters tell us our illustration of 6 data processes and flows Circular Chart PowerPoint templates are Perfect. You can be sure our arrow PowerPoint templates and PPT Slides are Ultra. Professionals tell us our illustration of 6 data processes and flows Circular Chart PowerPoint templates are Nifty. People tell us our center PowerPoint templates and PPT Slides are Handsome. People tell us our illustration of 6 data processes and flows Circular Chart PowerPoint templates are Youthful. Professionals tell us our around PowerPoint templates and PPT Slides are Fancy. Address problems with our Illustration Of 6 Data Processes And Flows Circular Chart PowerPoint Templates. Download without worries with our money back guaranteee.
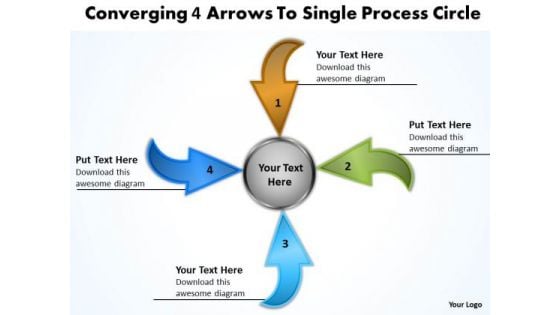
Converging 4 Arrows To Single Process Circle Pie Diagram PowerPoint Templates
We present our converging 4 arrows to single process circle Pie Diagram PowerPoint templates.Download and present our Arrows PowerPoint Templates because you will be able to Highlight your ideas broad-based on strong fundamentals and illustrate how they step by step acheive the set growth factor. Use our Circle Charts PowerPoint Templates because you can present your opinions in this field using our impressive templates. Download our Shapes PowerPoint Templates because displaying your ideas and highlighting your ability will accelerate the growth of your company and yours. Download and present our Business PowerPoint Templates because your ideas too are pinpointedly focused on you goals. Present our Flow Charts PowerPoint Templates because you can Unravel the desired and essential elements of your overall strategy.Use these PowerPoint slides for presentations relating to arrow, arrowheads, badge, banner, blue, button, cerulean, cobalt, colored, colorful, connection, cursor, cyan, design element, designator, directional, download, emblem, gray shadow, green, icon, indicator, interface, internet, link, load, magenta, marker, matted, menu tool, navigation panel, next, orientation, page site, pictogram, pink, pointer, red, right, satined, sign, signpost, smooth, symbol, upload, vector illustration, web, web 2.0, white background. The prominent colors used in the PowerPoint template are Blue, Brown, Green. Presenters tell us our converging 4 arrows to single process circle Pie Diagram PowerPoint templates are Nostalgic. You can be sure our banner PowerPoint templates and PPT Slides are Radiant. Professionals tell us our converging 4 arrows to single process circle Pie Diagram PowerPoint templates are Stylish. People tell us our colored PowerPoint templates and PPT Slides will generate and maintain the level of interest you desire. They will create the impression you want to imprint on your audience. People tell us our converging 4 arrows to single process circle Pie Diagram PowerPoint templates are Handsome. Professionals tell us our banner PowerPoint templates and PPT Slides are Efficient. Carry your thoughts on our Converging 4 Arrows To Single Process Circle Pie Diagram PowerPoint Templates. They will take them that much further.
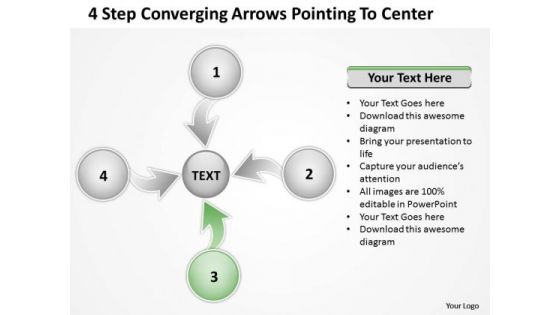
Step Converging Arrows Poiting To Center Ppt Relative Circular Process PowerPoint Templates
We present our step converging arrows poiting to center ppt Relative Circular Process PowerPoint templates.Use our Arrows PowerPoint Templates because Our PowerPoint Templates and Slides come in all colours, shades and hues. They help highlight every nuance of your views. Use our Circle Charts PowerPoint Templates because you have the right arrows in your quiver. Download and present our Shapes PowerPoint Templates because you have the ability to judge Which out of late have been proving to be a hassle. Download and present our Business PowerPoint Templates because you have secured a name for yourself in the domestic market. Now the time is right to spread your reach to other countries. Download and present our Flow Charts PowerPoint Templates because the ideas and plans are on your finger tips.Use these PowerPoint slides for presentations relating to 3d, abstract, all, around, arrow, aspect, attention, attract, blue, center, collect, colorful, conceptual, converge, course, cutout, direct, direction, factor, gather, globalization, go, green, guide, illustration, indicate, integration, isolated, location, many, movement, point, pointer, rainbow, reach, red, round, show, sides, sign, source, sphere, strategy, summon, symbol, target, unity, way, white, yellow. The prominent colors used in the PowerPoint template are Green, Gray, Black. Presenters tell us our step converging arrows poiting to center ppt Relative Circular Process PowerPoint templates are Romantic. The feedback we get is that our arrow PowerPoint templates and PPT Slides are Bold. Presenters tell us our step converging arrows poiting to center ppt Relative Circular Process PowerPoint templates are the best it can get when it comes to presenting. You can be sure our blue PowerPoint templates and PPT Slides look good visually. People tell us our step converging arrows poiting to center ppt Relative Circular Process PowerPoint templates are Fantastic. PowerPoint presentation experts tell us our around PowerPoint templates and PPT Slides are Chic. Rebuild your team with our Step Converging Arrows Poiting To Center Ppt Relative Circular Process PowerPoint Templates. Download without worries with our money back guaranteee.
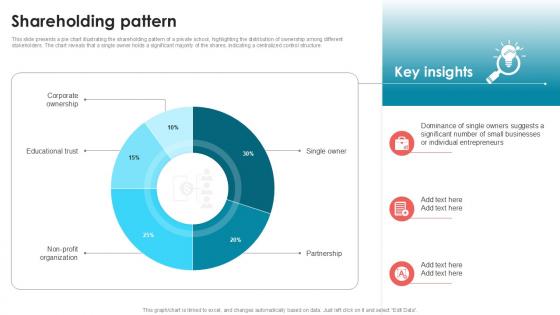
Shareholding Pattern Private School Investor Funding Elevator Pitch Deck PPT Template
This slide presents a pie chart illustrating the shareholding pattern of a private school, highlighting the distribution of ownership among different stakeholders. The chart reveals that a single owner holds a significant majority of the shares, indicating a centralized control structure. Coming up with a presentation necessitates that the majority of the effort goes into the content and the message you intend to convey. The visuals of a PowerPoint presentation can only be effective if it supplements and supports the story that is being told. Keeping this in mind our experts created Shareholding Pattern Private School Investor Funding Elevator Pitch Deck PPT Template to reduce the time that goes into designing the presentation. This way, you can concentrate on the message while our designers take care of providing you with the right template for the situation. This slide presents a pie chart illustrating the shareholding pattern of a private school, highlighting the distribution of ownership among different stakeholders. The chart reveals that a single owner holds a significant majority of the shares, indicating a centralized control structure.
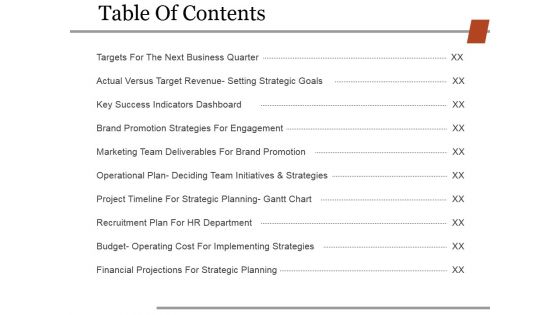
Table Of Contents Template 1 Ppt PowerPoint Presentation Infographic Template Gridlines
This is a table of contents template 1 ppt powerpoint presentation infographic template gridlines. This is a ten stage process. The stages in this process are targets for the next business quarter, actual versus target revenue setting strategic goals, key success indicators dashboard.
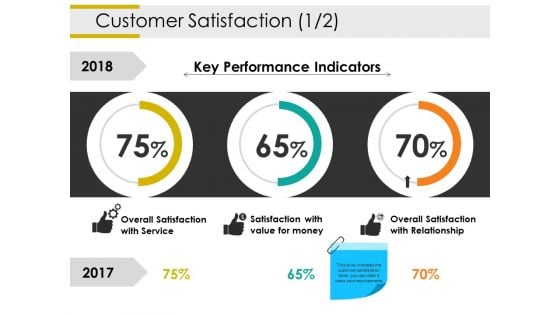
Customer Satisfaction Template 1 Ppt PowerPoint Presentation Portfolio Graphics Example
This is a customer satisfaction template 1 ppt powerpoint presentation portfolio graphics example. This is a three stage process. The stages in this process are overall satisfaction with service, satisfaction with value for money, overall satisfaction with relationship, key performance indicators, business, percentage.
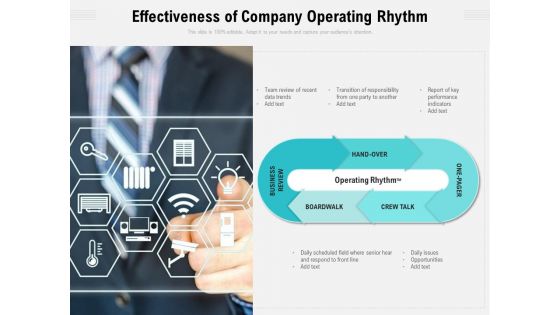
Effectiveness Of Company Operating Rhythm Ppt PowerPoint Presentation Professional Slide Portrait PDF
Presenting this set of slides with name effectiveness of company operating rhythm ppt powerpoint presentation professional slide portrait pdf. This is a one stage process. The stages in this process are team review, data trends, transition, responsibility, boardwalk, business review, performance indicators. This is a completely editable PowerPoint presentation and is available for immediate download. Download now and impress your audience.
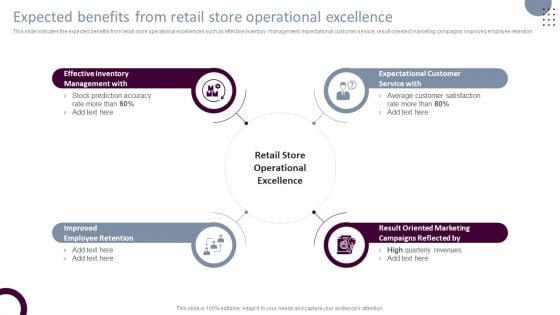
Retail Store Operations Expected Benefits From Retail Store Operational Excellence Clipart PDF
This slide indicates the expected benefits from retail store operational excellences such as effective inventory management, expectational customer service, result oriented marketing campaigns, improved employee retention. This Retail Store Operations Expected Benefits From Retail Store Operational Excellence Clipart PDF is perfect for any presentation, be it in front of clients or colleagues. It is a versatile and stylish solution for organizing your meetings. The Retail Store Operations Expected Benefits From Retail Store Operational Excellence Clipart PDF features a modern design for your presentation meetings. The adjustable and customizable slides provide unlimited possibilities for acing up your presentation. Slidegeeks has done all the homework before launching the product for you. So, dont wait, grab the presentation templates today
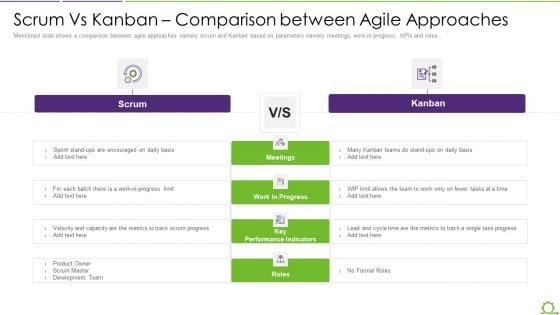
Comparison Between Agile And Scrum IT Scrum Vs Kanban Comparison Between Agile Approaches Slides PDF
Mentioned slide shows a comparison between agile approaches namely scrum and Kanban based on parameters namely meetings, work-in-progress, KPIs and roles. This is a comparison between agile and scrum it scrum vs kanban comparison between agile approaches slides pdf template with various stages. Focus and dispense information on two stages using this creative set, that comes with editable features. It contains large content boxes to add your information on topics like scrum, kanban, meetings work progress, key performance indicators, roles. You can also showcase facts, figures, and other relevant content using this PPT layout. Grab it now.
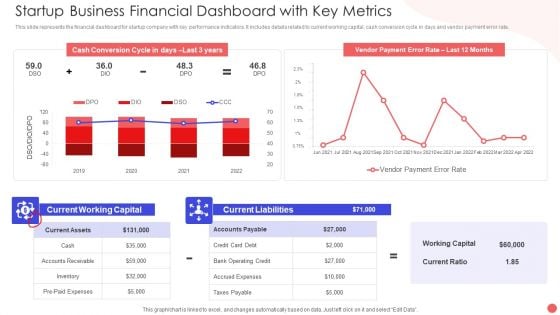
Startup Business Financial Dashboard With Key Metrics Sample PDF
This slide represents the financial dashboard for startup company with key performance indicators. It includes details related to current working capital, cash conversion cycle in days and vendor payment error rate. Pitch your topic with ease and precision using this Startup Business Financial Dashboard With Key Metrics Sample PDF. This layout presents information on Cash Conversion Cycle, Current Working Capital, Current Liabilities Debt. It is also available for immediate download and adjustment. So, changes can be made in the color, design, graphics or any other component to create a unique layout.
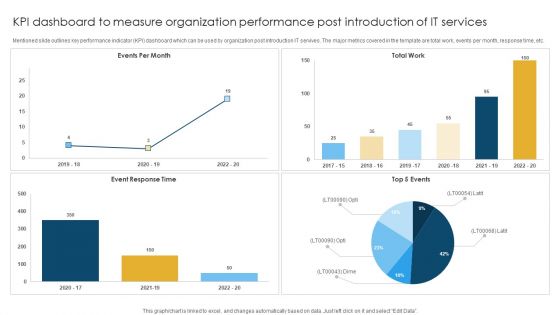
KPI Dashboard To Measure Organization Performance Post Introduction Of IT Services Rules PDF
Mentioned slide outlines key performance indicator KPI dashboard which can be used by organization post introduction IT servives. The major metrics covered in the template are total work, events per month, response time, etc. Showcasing this set of slides titled KPI Dashboard To Measure Organization Performance Post Introduction Of IT Services Rules PDF. The topics addressed in these templates are Event Response, Total Work, Events Per. All the content presented in this PPT design is completely editable. Download it and make adjustments in color, background, font etc. as per your unique business setting.
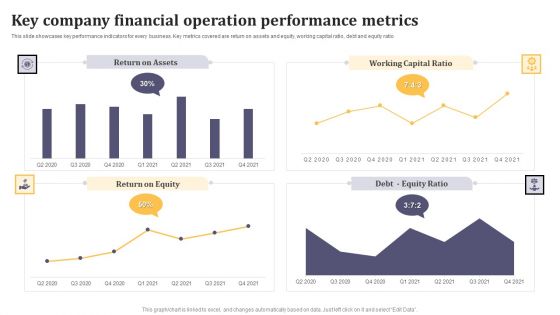
Key Company Financial Operation Performance Metrics Ppt Infographic Template Example Introduction PDF
This slide showcases key performance indicators for every business. Key metrics covered are return on assets and equity, working capital ratio, debt and equity ratio. Showcasing this set of slides titled Key Company Financial Operation Performance Metrics Ppt Infographic Template Example Introduction PDF. The topics addressed in these templates are Return on Assets, Working Capital Ratio, Return on Equity. All the content presented in this PPT design is completely editable. Download it and make adjustments in color, background, font etc. as per your unique business setting.
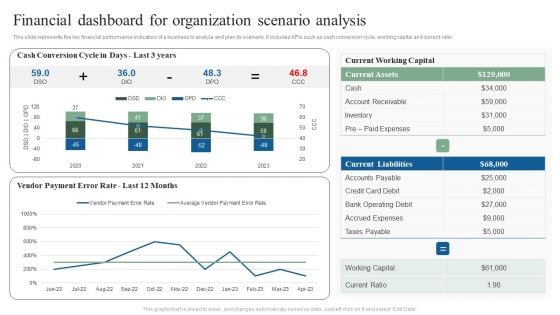
Financial Dashboard For Organization Scenario Analysis Ppt Show Ideas PDF
This slide represents the key financial performance indicators of a business to analyze and plan its scenario. It includes KPIs such as cash conversion cycle, working capital and current ratio. Showcasing this set of slides titled Financial Dashboard For Organization Scenario Analysis Ppt Show Ideas PDF. The topics addressed in these templates are Current Working Capital, Current Liabilities, Current Assets. All the content presented in this PPT design is completely editable. Download it and make adjustments in color, background, font etc. as per your unique business setting.
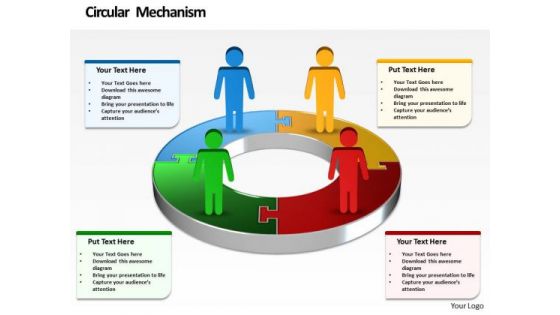
Ppt Symbol Business Men Standing On Financial Colorful Pie Chart PowerPoint Templates
PPT symbol business men standing on financial colorful pie chart PowerPoint Templates-Use this Business based PowerPoint Diagram to represent the Business issues Graphically. It indicates arrange, block out, blueprint, cast, delineate, design, devise, draft, graph , lay out, outline, plot, project, shape, sketch etc.-PPT symbol business men standing on financial colorful pie chart PowerPoint Templates-Adult, Art, Background, Business, Career, Chart, Communication, Concept, Conference, Corporate, Creative, Design, Economy, Executive, Finance, Group, Growth, Idea, Illustration, Leadership, Meeting, New, Occupation, Office, People, Person, Progress, Silhouette, Space, Speaking, Standing, Success Entertain your audience with your thoughts. Capture their imagination with our Ppt Symbol Business Men Standing On Financial Colorful Pie Chart PowerPoint Templates.
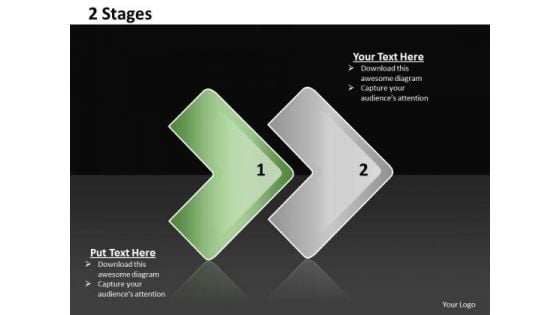
Ppt Linear Way To Show 2 State PowerPoint Presentation Diagram Templates
PPT linear way to show 2 state powerpoint presentation diagram Templates-Emphatically define your message with our above Diagram which contains a graphic of Linear model with its components. It symbolizes affiliation, affinity, alliance, association, connection etc. It shows the ninth stage with pink color.-PPT linear way to show 2 state powerpoint presentation diagram Templates-Aim, Arrow, Arrowheads, Badge, Border, Click, Connection, Curve, Design, Direction, Download, Element, Fuchsia, Icon, Illustration, Indicator, Internet, Magenta, Mark, Object, Orientation, Pointer, Shadow, Shape, Sign Performance evaluation is easier with our Ppt Linear Way To Show 2 State PowerPoint Presentation Diagram Templates. They help you assess results accurately.
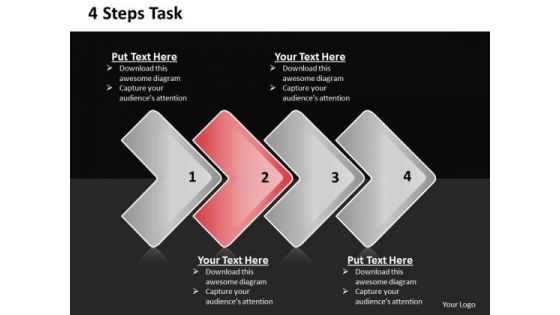
Ppt Direct Description Of 4 Create PowerPoint Macro Included An Action Templates
PPT direct description of 4 create powerpoint macro included an action Templates-This PowerPoint Diagram allows quick visual View of four Steps in an action. This is the most efficient method of transferring knowledge from the presenter to the audience. Transmit your thoughts via this slide and prod your team to action.-PPT direct description of 4 create powerpoint macro included an action Templates-Aim, Arrow, Arrowheads, Badge, Border, Click, Connection, Curve, Design, Direction, Download, Element, Fuchsia, Icon, Illustration, Indicator, Internet, Magenta, Mark, Object, Orientation, Pointer, Shadow, Shape, Sign Exhibit distinguished performance with our Ppt Direct Description Of 4 Create PowerPoint Macro Included An Action Templates. They will make you look good.
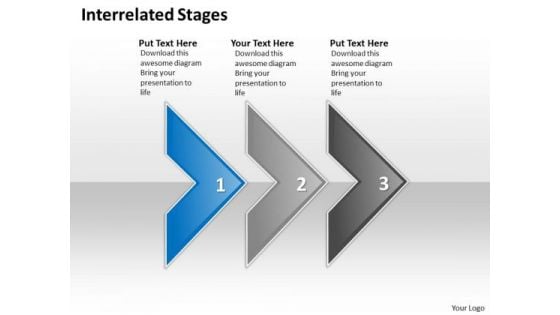
Ppt Interrelated Three Power Point Stage PowerPoint Templates
PPT interrelated three power point stage PowerPoint Templates-Visually support your ideas and emphatically define your message with our above template. This Template is designed to help bullet-point your views and thoughts. Get creative and add charm at your presentations with this high quality PPt design-PPT interrelated three power point stage PowerPoint Templates-Aim, Arrow, Arrowheads, Badge, Border, Click, Connection, Curve, Design, Direction, Download, Element, Fuchsia, Icon, Illustration, Indicator, Internet, Magenta, Mark, Object, Orientation, Pointer, Shadow, Shape, Sign Cast our Ppt Interrelated Three Power Point Stage PowerPoint Templates in your act. The audience will call for an encore.
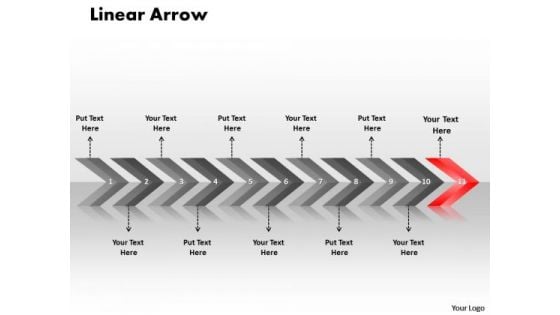
Flow PowerPoint Template Linear Ppt Arrows 11 States Diagram 12 Design
flow PowerPoint template linear ppt arrows 11 states diagram 12 design-This image has been professionally designed to emphasize the concept of interconnected relationships. You can easily edit the size, position and text and change the colors as per your need. Deliver amazing presentations to mesmerize your audience.-flow PowerPoint template linear ppt arrows 11 states diagram 12 design-Aim, Angle, Arrow, Arrowheads, Badge, Banner, Connection, Curve, Design, Direction, Download, Element, Fuchsia, Icon, Illustration, Indicator, Internet, Label, Link, Magenta, Mark, Marker, Next, Object, Orange, Orientation, Pointer, Shadow, Shape, Signs Symbol Employ creativity with our Flow PowerPoint Template Linear Ppt Arrows 11 States Diagram 12 Design. You will come out on top.
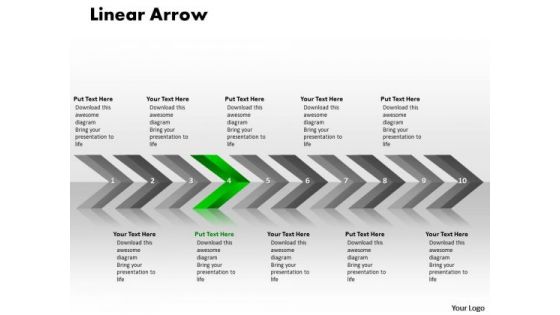
Business PowerPoint Template Linear Arrows 10 Stages Plan Image
Business PowerPoint template linear arrows 10 stages plan Image- The above template has the theme of linear arrows. Use this diagram to highlight the important timelines and milestones of this exciting journey. Focus the light on the path to sure shot success. It enhances the essence of your viable ideas-Business PowerPoint template linear arrows 10 stages plan Image-Aim, Angle, Arrow, Arrowheads, Badge, Banner, Connection, Curve, Design, Direction, Download, Element, Fuchsia, Icon, Illustration, Indicator, Internet, Label, Link, Magenta, Mark, Marker, Next, Object, Orange, Orientation, Pointer, Shadow, Shape, Signs Symbol Enhance feasibility with our Business PowerPoint Template Linear Arrows 10 Stages Plan Image. Exhort your team to eventual success.
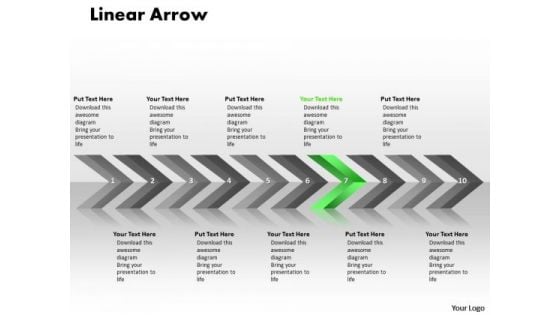
Marketing Ppt Linear Arrows 10 Stages Business Communication PowerPoint 8 Image
marketing PPT linear arrows 10 stages business communication powerpoint 8 Image-This Linear Arrow design provides a graphic tool that allows users to easily draft the strategy map and monitor performance through the same. Use this impressive template to unravel your recipe for a mouth watering result.-marketing PPT linear arrows 10 stages business communication powerpoint 8 Image-Aim, Angle, Arrow, Arrowheads, Badge, Banner, Connection, Curve, Design, Direction, Download, Element, Fuchsia, Icon, Illustration, Indicator, Internet, Label, Link, Magenta, Mark, Marker, Next, Object, Orange, Orientation, Pointer, Shadow, Shape, Signs Symbol Spice up the discourse with our Marketing Ppt Linear Arrows 10 Stages Business Communication PowerPoint 8 Image. Strengthen the flavour of your thoughts.
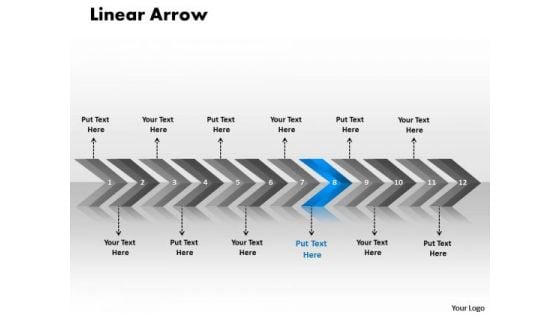
Marketing Ppt Linear Arrows 12 Power Point Stages Communication Skills PowerPoint 9 Image
marketing PPT linear arrows 12 power point stages communication skills powerpoint 9 Image-Create visually amazing Microsoft office PPT Presentations with our above template. This premium graphics is especially suitable for sequences. It provides the means to project your views.-marketing PPT linear arrows 12 power point stages communication skills powerpoint 9 Image-Aim, Angle, Arrow, Arrowheads, Badge, Banner, Connection, Curve, Design, Direction, Download, Element, Fuchsia, Icon, Illustration, Indicator, Internet, Label, Link, Magenta, Mark, Marker, Next, Object, Orange, Orientation, Pointer, Shadow, Shape, Signs Symbol Make your ascent a delightful one. Give your career a booster dose with our Marketing Ppt Linear Arrows 12 Power Point Stages Communication Skills PowerPoint 9 Image.
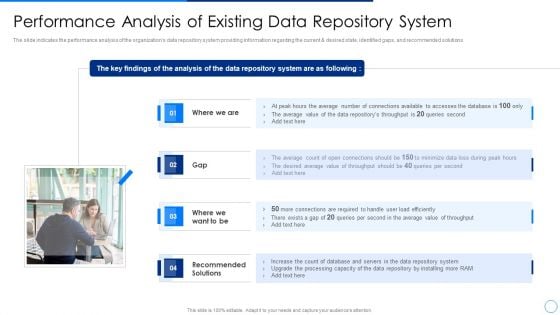
Scale Up Plan For Data Inventory Model Performance Analysis Of Existing Data Repository System Background PDF
The slide indicates the performance analysis of the organizations data repository system providing information regarding the current and desired state, identified gaps, and recommended solutions. This is a scale up plan for data inventory model performance analysis of existing data repository system background pdf template with various stages. Focus and dispense information on four stages using this creative set, that comes with editable features. It contains large content boxes to add your information on topics like performance analysis of existing data repository system. You can also showcase facts, figures, and other relevant content using this PPT layout. Grab it now.

Healthcare After Adopting Iot And Digital Twin Sample PDF Guidelines PDF
This slide represents the status of healthcare industry after adopting IoT and digital twin technology such as patient monitoring, cost savings and personalized healthcare. Presenting healthcare after adopting iot and digital twin sample pdf guidelines pdf to provide visual cues and insights. Share and navigate important information on five stages that need your due attention. This template can be used to pitch topics like monitoring, accurate, analytics, capabilities, indications, measures. In addtion, this PPT design contains high resolution images, graphics, etc, that are easily editable and available for immediate download.
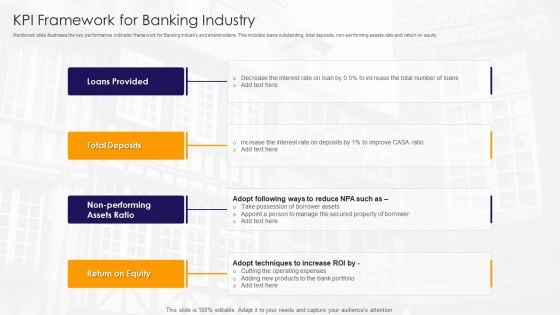
KPI Framework For Banking Industry Ppt PowerPoint Presentation File Format PDF
Mentioned slide illustrates the key performance indicator framework for Banking industry and shareholders. This includes loans outstanding, total deposits, non-performing assets ratio and return on equity. Presenting kpi framework for banking industry ppt powerpoint presentation file format pdf to dispense important information. This template comprises three stages. It also presents valuable insights into the topics including loans provided, total deposits, return on equity This is a completely customizable PowerPoint theme that can be put to use immediately. So, download it and address the topic impactfully.
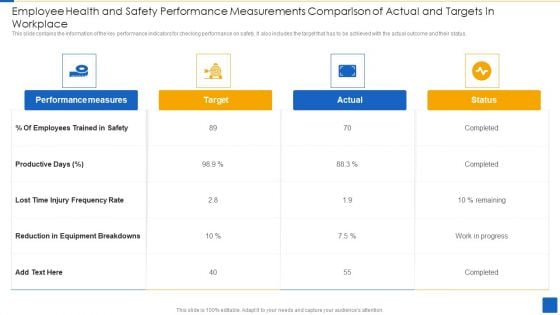
Employee Health And Safety Performance Measurements Comparison Of Actual And Targets In Workplace Mockup PDF
This slide contains the information of the key performance indicators for checking performance on safety. It also includes the target that has to be achieved with the actual outcome and their status. Persuade your audience using this Employee Health And Safety Performance Measurements Comparison Of Actual And Targets In Workplace Mockup PDF This PPT design covers five stages, thus making it a great tool to use. It also caters to a variety of topics including Performance Measures, Reduction Equipment Breakdowns, Employees Trained Download this PPT design now to present a convincing pitch that not only emphasizes the topic but also showcases your presentation skills.

Various Kpis To Measure Computer Security System Portrait PDF
This slide shows the different KPIs used to measure IT security system. These are level of preparedness, intrusion attempts, days to patch, incidents reported etc. Persuade your audience using this Various Kpis To Measure Computer Security System Portrait PDF This PPT design covers three stages, thus making it a great tool to use. It also caters to a variety of topics including Performance Indicators, Excepted Results, Actual Results Download this PPT design now to present a convincing pitch that not only emphasizes the topic but also showcases your presentation skills.
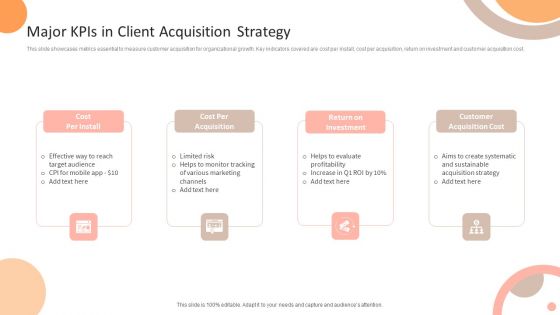
Major Kpis In Client Acquisition Strategy Ppt Layouts Graphics Template PDF
This slide showcases metrics essential to measure customer acquisition for organizational growth. Key indicators covered are cost per install, cost per acquisition, return on investment and customer acquisition cost. Presenting Major Kpis In Client Acquisition Strategy Ppt Layouts Graphics Template PDF to dispense important information. This template comprises four stages. It also presents valuable insights into the topics including Cost Per Install, Cost Per Acquisition, Return on Investment, Customer Acquisition Cost. This is a completely customizable PowerPoint theme that can be put to use immediately. So, download it and address the topic impactfully.
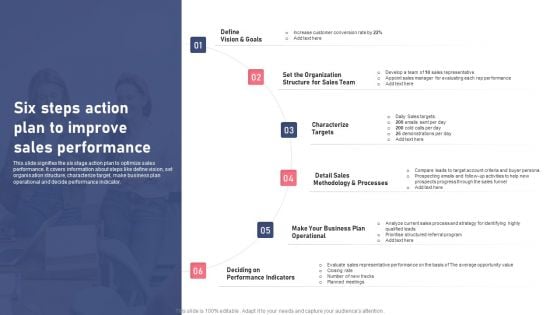
Six Steps Action Plan To Improve Sales Performance Ppt Pictures Show PDF
This slide signifies the six stage action plan to optimize sales performance. It covers information about steps like define vision, set organisation structure, characterize target, make business plan operational and decide performance indicator. Presenting Six Steps Action Plan To Improve Sales Performance Ppt Pictures Show PDF to dispense important information. This template comprises six stages. It also presents valuable insights into the topics including Organization Structure, Sales Team, Characterize Targets. This is a completely customizable PowerPoint theme that can be put to use immediately. So, download it and address the topic impactfully.

Kpis To Analyse Content Performance Data Rules PDF
This slide shows KPIs to track and analyse performance of different types of content. It includes various indicators such as views, subscriptions, click through rates etc. for different contents articles, emails, social media, videos, podcasts and campaigns. Persuade your audience using this Kpis To Analyse Content Performance Data Rules PDF. This PPT design covers Six stages, thus making it a great tool to use. It also caters to a variety of topics including Articles, Email, Videos, Campaigns. Download this PPT design now to present a convincing pitch that not only emphasizes the topic but also showcases your presentation skills.
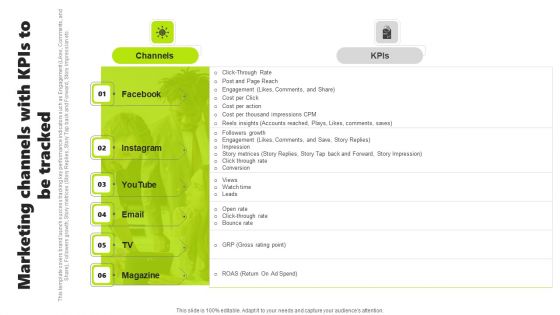
Rebrand Kick Off Plan Marketing Channels With Kpis To Be Tracked Graphics PDF
This template covers brand launch success tracking key performance indicators such as Engagement Likes, Comments, and Share, Followers growth, Story metrices Story Replies, Story Tap back and Forward, Story Impression etc. There are so many reasons you need a Rebrand Kick Off Plan Marketing Channels With Kpis To Be Tracked Graphics PDF. The first reason is you can not spend time making everything from scratch, Thus, Slidegeeks has made presentation templates for you too. You can easily download these templates from our website easily.
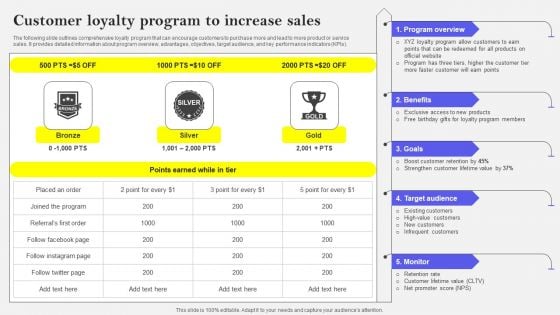
Customer Loyalty Program To Increase Sales Graphics PDF
The following slide outlines comprehensive loyalty program that can encourage customers to purchase more and lead to more product or service sales. It provides detailed information about program overview, advantages, objectives, target audience, and key performance indicators KPIs. There are so many reasons you need a Customer Loyalty Program To Increase Sales Graphics PDF. The first reason is you can not spend time making everything from scratch, Thus, Slidegeeks has made presentation templates for you too. You can easily download these templates from our website easily.
Power Point Arrows Stages Directional Process PowerPoint Templates Ppt Backgrounds For Slides
We present our power point arrows stages directional process PowerPoint templates PPT backgrounds for slides.Download our Arrows PowerPoint Templates because our PowerPoint Templates and Slides are the string of your bow. Fire of your ideas and conquer the podium. Present our Marketing PowerPoint Templates because You have gained great respect for your brilliant ideas. Use our PowerPoint Templates and Slides to strengthen and enhance your reputation. Download and present our Business PowerPoint Templates because Our PowerPoint Templates and Slides are aesthetically designed to attract attention. We gaurantee that they will grab all the eyeballs you need. Download and present our Process and Flows PowerPoint Templates because You should Bet on your luck with our PowerPoint Templates and Slides. Be assured that you will hit the jackpot. Download our Shapes PowerPoint Templates because It will Strengthen your hand with your thoughts. They have all the aces you need to win the day.Use these PowerPoint slides for presentations relating to Arrow, Banner, Bar, Collection, Completion, Concept, Confirmation, Design, Flow, Graph, Graphic, Illustration, Indication, Information, Instruction, Interface, Internet, Layout, Measurement, Modern, Number, Order, Phase, Pointer, Process, Progress, Reflection, Scale, Shape, Stage, Status, Step, Template, Two, Vector, Web, Web . The prominent colors used in the PowerPoint template are Yellow, Brown, White. Customers tell us our power point arrows stages directional process PowerPoint templates PPT backgrounds for slides are designed by professionals We assure you our Design PowerPoint templates and PPT Slides will help them to explain complicated concepts. Use our power point arrows stages directional process PowerPoint templates PPT backgrounds for slides will make you look like a winner. You can be sure our Concept PowerPoint templates and PPT Slides look good visually. PowerPoint presentation experts tell us our power point arrows stages directional process PowerPoint templates PPT backgrounds for slides provide great value for your money. Be assured of finding the best projection to highlight your words. The feedback we get is that our Bar PowerPoint templates and PPT Slides provide great value for your money. Be assured of finding the best projection to highlight your words. Endure setbacks with our Power Point Arrows Stages Directional Process PowerPoint Templates Ppt Backgrounds For Slides. Download without worries with our money back guaranteee.

Key Requirements For Aviation Fuel Sustainability Rating System Formats PDF
This slide covers various requirements in the process of obtaining sustainable rating for aviation fuel. It includes elements such as stakeholders such as companies, trade association, government agencies, government regulations, international standards bureau resulting in supplier certification, suppliers declarations, etc. Showcasing this set of slides titled Key Requirements For Aviation Fuel Sustainability Rating System Formats PDF. The topics addressed in these templates are Criteria Indicator, Inputs, Rating System Operator. All the content presented in this PPT design is completely editable. Download it and make adjustments in color, background, font etc. as per your unique business setting.
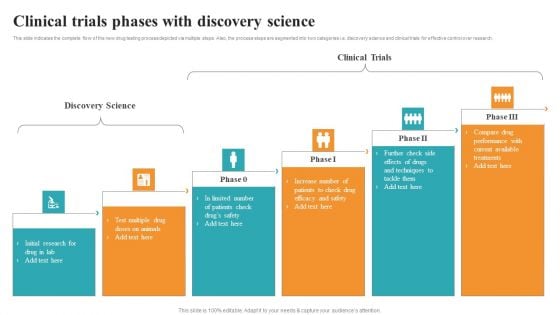
Clinical Trials Phases With Discovery Science Medical Research Phases For Clinical Tests Topics PDF
This slide indicates the complete flow of the new drug testing process depicted via multiple steps. Also, the process steps are segmented into two categories i.e. discovery science and clinical trials for effective control over research. Slidegeeks is here to make your presentations a breeze with Clinical Trials Phases With Discovery Science Medical Research Phases For Clinical Tests Topics PDF With our easy to use and customizable templates, you can focus on delivering your ideas rather than worrying about formatting. With a variety of designs to choose from, you are sure to find one that suits your needs. And with animations and unique photos, illustrations, and fonts, you can make your presentation pop. So whether you are giving a sales pitch or presenting to the board, make sure to check out Slidegeeks first.
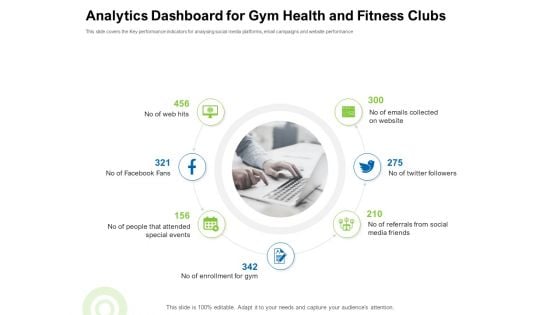
Strategies To Enter Physical Fitness Club Business Analytics Dashboard For Gym Health And Fitness Clubs Brochure PDF
This slide covers the Key performance indicators for analysing social media platforms, email campaigns and website performance This is a strategies to enter physical fitness club business analytics dashboard for gym health and fitness clubs brochure pdf template with various stages. Focus and dispense information on seven stages using this creative set, that comes with editable features. It contains large content boxes to add your information on topics like web, facebook, twitter, followers, friends. You can also showcase facts, figures, and other relevant content using this PPT layout. Grab it now.
KPI To Track Success Of Strategy Implementation Ppt Gallery Icon PDF
The slide shows the key Performance Indicator KPI s which will help the company to track the success rate of implemented strategies. Major KPIs include number of products sold, products manufactures, research and development expenses per year, customer satisfaction level, etc. Presenting kpi to track success of strategy implementation ppt gallery icon pdf to provide visual cues and insights. Share and navigate important information on one stage that need your due attention. This template can be used to pitch topics like products manufactured, development, target. In addtion, this PPT design contains high resolution images, graphics, etc, that are easily editable and available for immediate download.
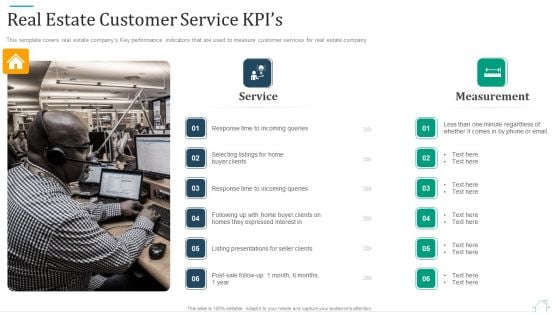
Promotional Strategy For Real Estate Project Real Estate Customer Service Kpis Rules PDF
This template covers real estate companys Key performance indicators that are used to measure customer services for real estate company. Presenting promotional strategy for real estate project real estate customer service kpis rules pdf to provide visual cues and insights. Share and navigate important information on two stages that need your due attention. This template can be used to pitch topics like expressed, measurement, service. In addtion, this PPT design contains high resolution images, graphics, etc, that are easily editable and available for immediate download.
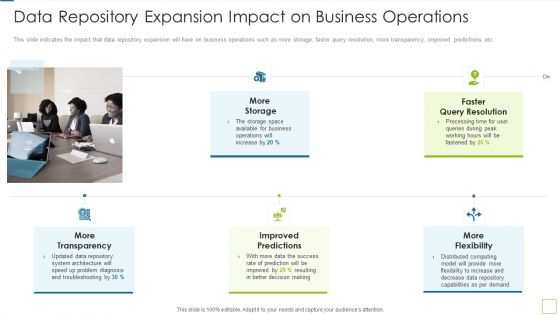
Database Expansion And Optimization Data Repository Expansion Impact On Business Operations Ppt Outline Layouts
This slide indicates the impact that data repository expansion will have on business operations such as more storage, faster query resolution, more transparency, improved predictions, etc. Presenting database expansion and optimization data repository expansion impact on business operations ppt outline layouts to provide visual cues and insights. Share and navigate important information on five stages that need your due attention. This template can be used to pitch topics like more transparency, improved predictions, more flexibility, faster query resolution, more storage. In addtion, this PPT design contains high resolution images, graphics, etc, that are easily editable and available for immediate download.
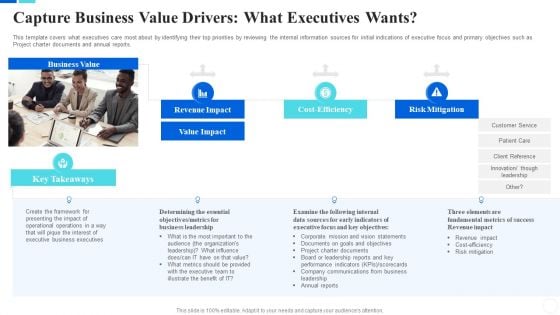
Communicate Company Value To Your Stakeholders Capture Business Value Drivers Graphics PDF
This template covers what executives care most about by identifying their top priorities by reviewing the internal information sources for initial indications of executive focus and primary objectives such as Project charter documents and annual reports. This is a communicate company value to your stakeholders capture business value drivers graphics pdf template with various stages. Focus and dispense information on three stages using this creative set, that comes with editable features. It contains large content boxes to add your information on topics like value impact, revenue impact, risk mitigation, business executives. You can also showcase facts, figures, and other relevant content using this PPT layout. Grab it now.
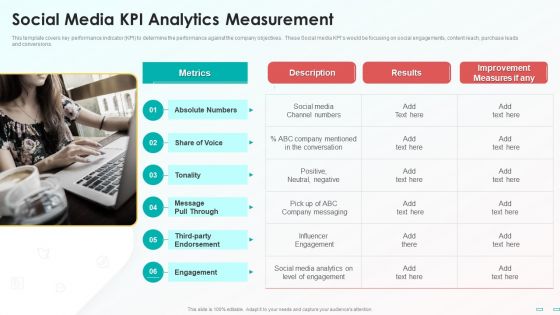
Social Media Kpi Analytics Measurement Demonstration PDF
This template covers key performance indicator KPI to determine the performance against the company objectives. These Social media KPIs would be focusing on social engagements, content reach, purchase leads and conversions. Presenting Social Media Kpi Analytics Measurement Demonstration PDF to provide visual cues and insights. Share and navigate important information on one stages that need your due attention. This template can be used to pitch topics like Metrics, Social Media, Improvement Measures. In addtion, this PPT design contains high resolution images, graphics, etc, that are easily editable and available for immediate download.
Inbound Promotion Techniques Icon To Attract Customers Portrait PDF
Following slide provides information regarding marketing strategies employed by professional firms to increase visibility and reputation. Purpose, objectives, initiatives and key performing indicators are few of the elements demonstrated in this slide. Presenting Inbound Promotion Techniques Icon To Attract Customers Portrait PDF to dispense important information. This template comprises three stages. It also presents valuable insights into the topics including Inbound Promotion, Techniques Icon, Attract Customers. This is a completely customizable PowerPoint theme that can be put to use immediately. So, download it and address the topic impactfully.
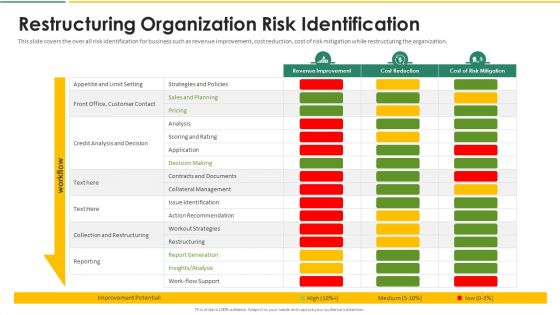
Organization Chart And Corporate Model Transformation Restructuring Organization Risk Identification Inspiration PDF
This slide covers the challenge in reporting several performance indices is to assess whether an improvement in one is comparable with that in another. The indices in the chosen set are each given a usually estimated weighting to reflect their relative importance. Deliver an awe inspiring pitch with this creative organization chart and corporate model transformation restructuring organization risk identification inspiration pdf bundle. Topics like financials, customers, internal processes, learning and growth can be discussed with this completely editable template. It is available for immediate download depending on the needs and requirements of the user.
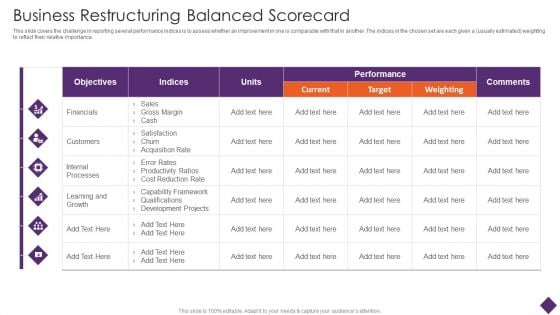
Business Restructuring Business Restructuring Balanced Scorecard Ppt Infographics Skills PDF
This slide covers the challenge in reporting several performance indices is to assess whether an improvement in one is comparable with that in another. The indices in the chosen set are each given a usually estimated weighting to reflect their relative importance. Deliver and pitch your topic in the best possible manner with this Business Restructuring Business Restructuring Balanced Scorecard Ppt Infographics Skills PDF. Use them to share invaluable insights on Objectives Financials Customers, Internal Processes Units and impress your audience. This template can be altered and modified as per your expectations. So, grab it now.
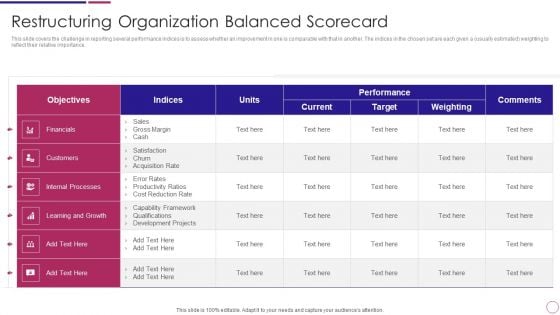
Restructuring Organization Balanced Scorecard Ppt PowerPoint Presentation Gallery Designs PDF
This slide covers the challenge in reporting several performance indices is to assess whether an improvement in one is comparable with that in another. The indices in the chosen set are each given a usually estimated weighting to reflect their relative importance. Deliver an awe inspiring pitch with this creative Restructuring Organization Balanced Scorecard Ppt PowerPoint Presentation Gallery Designs PDF bundle. Topics like Financials Customers, Internal Processes, Learning Growth can be discussed with this completely editable template. It is available for immediate download depending on the needs and requirements of the user.
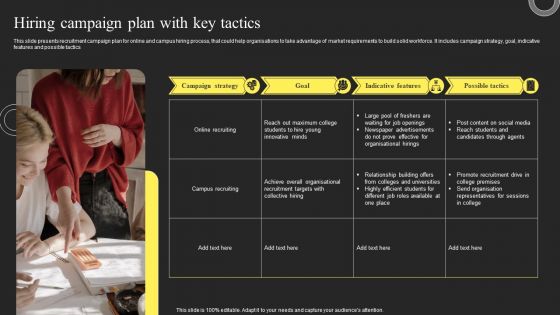
Hiring Campaign Plan With Key Tactics Sample PDF
This slide presents recruitment campaign plan for online and campus hiring process, that could help organisations to take advantage of market requirements to build solid workforce. It includes campaign strategy, goal, indicative features and possible tactics. Persuade your audience using this Hiring Campaign Plan With Key Tactics Sample PDF. This PPT design covers one stages, thus making it a great tool to use. It also caters to a variety of topics including Campaign Strategy, Indicative Features, Goal. Download this PPT design now to present a convincing pitch that not only emphasizes the topic but also showcases your presentation skills.
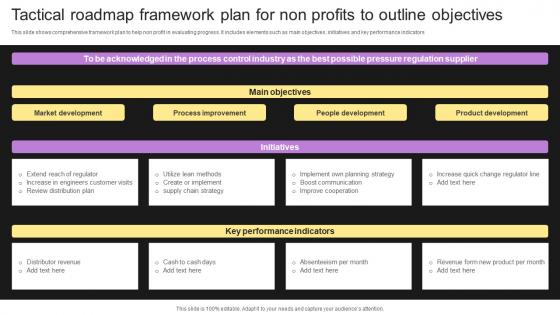
Tactical Roadmap Framework Plan For Non Profits To Outline Objectives Structure Pdf
This slide shows comprehensive framework plan to help non profit in evaluating progress. It includes elements such as main objectives, initiatives and key performance indicators Showcasing this set of slides titled Tactical Roadmap Framework Plan For Non Profits To Outline Objectives Structure Pdf The topics addressed in these templates are Market Development, Process Improvement, People Development All the content presented in this PPT design is completely editable. Download it and make adjustments in color, background, font etc. as per your unique business setting. This slide shows comprehensive framework plan to help non profit in evaluating progress. It includes elements such as main objectives, initiatives and key performance indicators
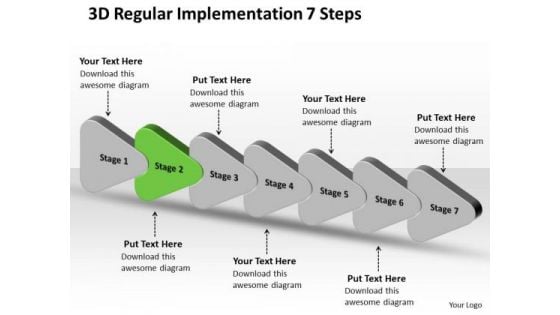
3d Regular Implementation 7 Steps Ppt Free Flowchart PowerPoint Slides
We present our 3d regular implementation 7 steps ppt free flowchart PowerPoint Slides. Use our Business PowerPoint Templates because; Show them how to churn out fresh ideas. Use our Design PowerPoint Templates because, they are indicators of the path you have in mind. Use our Finance PowerPoint Templates because, anticipate the doubts and questions in the minds of your colleagues and enlighten them with your inspired strategy to garner desired success. Use our Shapes PowerPoint Templates because; amplify your thoughts via our appropriate templates. Use our Process and Flows PowerPoint Templates because, Demonstrate to your audience how the best and most refined ideas pass through. Use these PowerPoint slides for presentations relating to analysis, art, blank, blue, business, categories, chart, chief, circle, clip, clipart, corporate, design, diagram, directors, element, executive, financial, graph, graphic, green, heading, icon, illustration, implementation, isolated, managers, media, network, officer, perspective, pie, president, red, relations, role, round, sales, segments, set, six, staff, strategic, title, vector, vice, wheel. The prominent colors used in the PowerPoint template are Green, Gray, and Black Project your exercise regimen on our 3d Regular Implementation 7 Steps Ppt Free Flowchart PowerPoint Slides. Elaborate on the benefits of each set.

Inventory KPI Powerpoint Ppt Template Bundles
This Inventory Key Performance Indicators, Stock KPIs, Stock Metrics, Supply Chain KPIs, Metrics-slide Inventory KPI Powerpoint Ppt Template Bundles is your content ready tool to impress the stakeholders with your business planning and its manner of execution. Showcase your ideas and how you plan to make them real in detail with this PPT Template Bundle. The slides have the conceptual bandwidth to present the crucial aspects of your plan, such as funding, marketing, resource allocation, timeline, roadmap, and more. When you present your plans with this PPT Layout, the stakeholders are sure to come on board because you will be able to present a succinct, thought-out, winning project. Download this Complete Deck now to take control into your hands. The 100 percent customizable offer is just too good to be resisted. Key performance indicators KPIs in inventory management are measures that assists to monitor and make choices about your stock. Our Inventory KPI Powerpoint PPT Template Bundles are topically designed to provide an attractive backdrop to any subject.
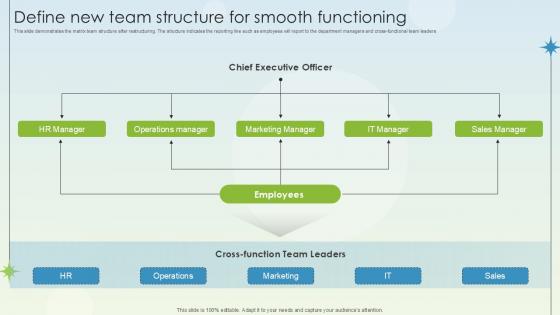
Define New Team Structure For Smooth Functioning Business Growth Ppt Sample
This slide demonstrates the matrix team structure after restructuring. The structure indicates the reporting line such as employees will report to the department managers and cross-functional team leaders Do you have an important presentation coming up Are you looking for something that will make your presentation stand out from the rest Look no further than Define New Team Structure For Smooth Functioning Business Growth Ppt Sample With our professional designs, you can trust that your presentation will pop and make delivering it a smooth process. And with Slidegeeks, you can trust that your presentation will be unique and memorable. So why wait Grab Define New Team Structure For Smooth Functioning Business Growth Ppt Sample today and make your presentation stand out from the rest This slide demonstrates the matrix team structure after restructuring. The structure indicates the reporting line such as employees will report to the department managers and cross functional team leaders
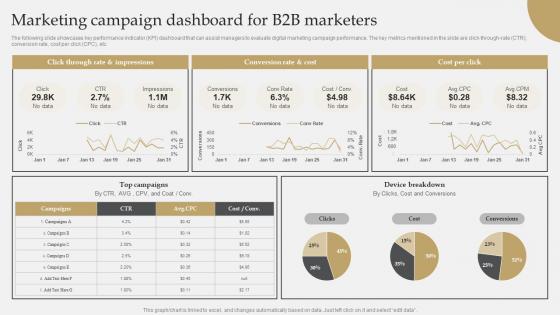
IT Industry Market Research Marketing Campaign Dashboard For B2b Marketers Demonstration Pdf
The following slide showcases key performance indicator KPI dashboard that can assist managers to evaluate digital marketing campaign performance. The key metrics mentioned in the slide are click-through-rate CTR, conversion rate, cost per click CPC, etc. Are you in need of a template that can accommodate all of your creative concepts This one is crafted professionally and can be altered to fit any style. Use it with Google Slides or PowerPoint. Include striking photographs, symbols, depictions, and other visuals. Fill, move around, or remove text boxes as desired. Test out color palettes and font mixtures. Edit and save your work, or work with colleagues. Download IT Industry Market Research Marketing Campaign Dashboard For B2b Marketers Demonstration Pdf and observe how to make your presentation outstanding. Give an impeccable presentation to your group and make your presentation unforgettable. The following slide showcases key performance indicator KPI dashboard that can assist managers to evaluate digital marketing campaign performance. The key metrics mentioned in the slide are click-through-rate CTR, conversion rate, cost per click CPC, etc.
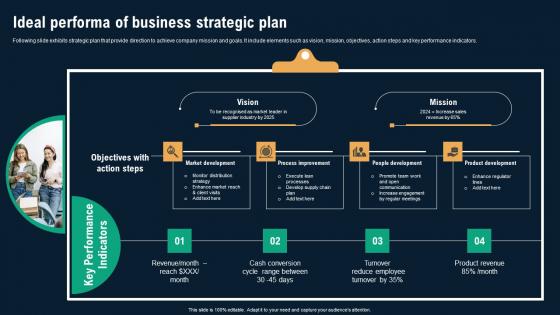
Ideal Performa Of Business Strategic Plan Business Environmental Analysis Clipart Pdf
Following slide exhibits strategic plan that provide direction to achieve company mission and goals. It include elements such as vision, mission, objectives, action steps and key performance indicators. Formulating a presentation can take up a lot of effort and time, so the content and message should always be the primary focus. The visuals of the PowerPoint can enhance the presenters message, so our Ideal Performa Of Business Strategic Plan Business Environmental Analysis Clipart Pdf was created to help save time. Instead of worrying about the design, the presenter can concentrate on the message while our designers work on creating the ideal templates for whatever situation is needed. Slidegeeks has experts for everything from amazing designs to valuable content, we have put everything into Ideal Performa Of Business Strategic Plan Business Environmental Analysis Clipart Pdf Following slide exhibits strategic plan that provide direction to achieve company mission and goals. It include elements such as vision, mission, objectives, action steps and key performance indicators.


 Continue with Email

 Home
Home


