Score Meter
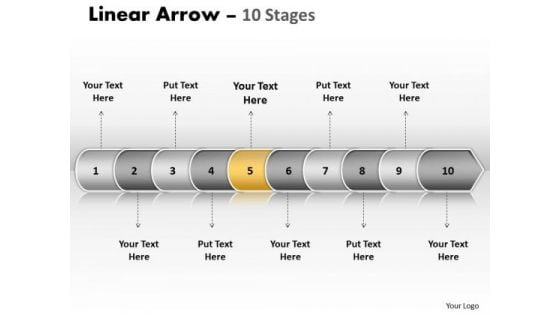
Usa Ppt Background Linear Arrow 10 State PowerPoint Project Diagram 6 Image
USA PPT Background linear arrow 10 state powerpoint project diagram 6 Image-Use this diagram to display your ideas and highlight their ability to accelerate the growth of your company and you. Impress upon the audience how your strategy will carry all to the top of the corporate heap.-USA PPT Background linear arrow 10 state powerpoint project diagram 6 Image-Arrow, Background, Collection, Completed, Concept, Confirmation, Design, Flow, Graph, Graphic, Illustration, Indication, Indicator, Information, Instruction, Interface, Internet, Layout, Measurement, Order, Phase, Pointer, Process, Progress, Reflection, Scale, Shape, Sign Our Usa Ppt Background Linear Arrow 10 State PowerPoint Project Diagram 6 Image will go on till blue in the face. They will keep at it till you achieve your aim.
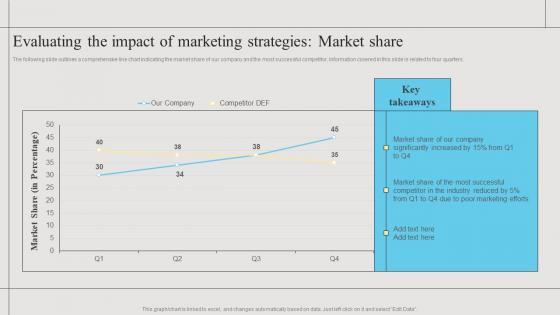
Evaluating The Impact Of Marketing Branding Strategies To Get Competitive Background Pdf
The following slide outlines a comprehensive line chart indicating the market share of our company and the most successful competitor. Information covered in this slide is related to four quarters.Do you have an important presentation coming up Are you looking for something that will make your presentation stand out from the rest Look no further than Evaluating The Impact Of Marketing Branding Strategies To Get Competitive Background Pdf. With our professional designs, you can trust that your presentation will pop and make delivering it a smooth process. And with Slidegeeks, you can trust that your presentation will be unique and memorable. So why wait Grab Evaluating The Impact Of Marketing Branding Strategies To Get Competitive Background Pdf today and make your presentation stand out from the rest. The following slide outlines a comprehensive line chart indicating the market share of our company and the most successful competitor. Information covered in this slide is related to four quarters.
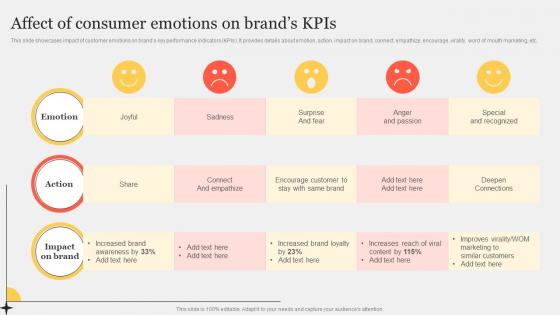
Affect Of Consumer Emotions On Brands Improving Customer Interaction Through Guidelines Pdf
This slide showcases impact of customer emotions on brands key performance indicators KPIs. It provides details about emotion, action, impact on brand, connect, empathize, encourage, virality, word of mouth marketing, etc.Do you have an important presentation coming up Are you looking for something that will make your presentation stand out from the rest Look no further than Affect Of Consumer Emotions On Brands Improving Customer Interaction Through Guidelines Pdf. With our professional designs, you can trust that your presentation will pop and make delivering it a smooth process. And with Slidegeeks, you can trust that your presentation will be unique and memorable. So why wait Grab Affect Of Consumer Emotions On Brands Improving Customer Interaction Through Guidelines Pdf today and make your presentation stand out from the rest. This slide showcases impact of customer emotions on brands key performance indicators KPIs. It provides details about emotion, action, impact on brand, connect, empathize, encourage, virality, word of mouth marketing, etc.
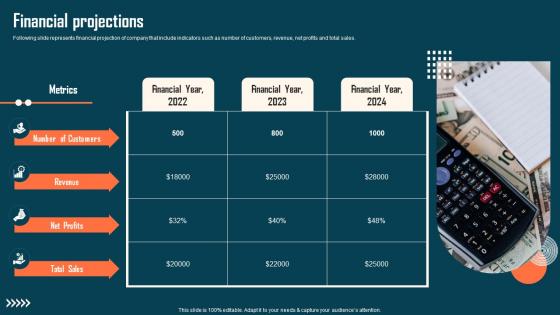
Financial Projections Astroprint Capital Raising Pitch Deck Rules Pdf
Following slide represents financial projection of company that include indicators such as number of customers, revenue, net profits and total sales. Do you have an important presentation coming up Are you looking for something that will make your presentation stand out from the rest Look no further than Financial Projections Astroprint Capital Raising Pitch Deck Rules Pdf. With our professional designs, you can trust that your presentation will pop and make delivering it a smooth process. And with Slidegeeks, you can trust that your presentation will be unique and memorable. So why wait Grab Financial Projections Astroprint Capital Raising Pitch Deck Rules Pdf today and make your presentation stand out from the rest Following slide represents financial projection of company that include indicators such as number of customers, revenue, net profits and total sales.

Performance Analysis Of Binance Platform Globally Complete Roadmap To Blockchain BCT SS V
This slide covers key performance metrics and indicators for assessing performance of Binance exchange platform. It includes performance related revenue earned, profit generation along with Binance annual users for year 2017-2021. Do you have an important presentation coming up Are you looking for something that will make your presentation stand out from the rest Look no further than Performance Analysis Of Binance Platform Globally Complete Roadmap To Blockchain BCT SS V. With our professional designs, you can trust that your presentation will pop and make delivering it a smooth process. And with Slidegeeks, you can trust that your presentation will be unique and memorable. So why wait Grab Performance Analysis Of Binance Platform Globally Complete Roadmap To Blockchain BCT SS V today and make your presentation stand out from the rest This slide covers key performance metrics and indicators for assessing performance of Binance exchange platform. It includes performance related revenue earned, profit generation along with Binance annual users for year 2017-2021.
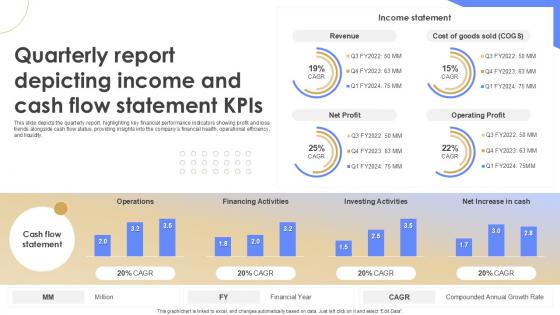
Quarterly Report Depicting Income And Cash Flow Statement KPIS Quarterly Report Ppt Example
This slide depicts the quarterly report, highlighting key financial performance indicators showing profit and loss trends alongside cash flow status, providing insights into the companys financial health, operational efficiency, and liquidity. Do you have an important presentation coming up Are you looking for something that will make your presentation stand out from the rest Look no further than Quarterly Report Depicting Income And Cash Flow Statement KPIS Quarterly Report Ppt Example With our professional designs, you can trust that your presentation will pop and make delivering it a smooth process. And with Slidegeeks, you can trust that your presentation will be unique and memorable. So why wait Grab Quarterly Report Depicting Income And Cash Flow Statement KPIS Quarterly Report Ppt Example today and make your presentation stand out from the rest This slide depicts the quarterly report, highlighting key financial performance indicators showing profit and loss trends alongside cash flow status, providing insights into the companys financial health, operational efficiency, and liquidity.
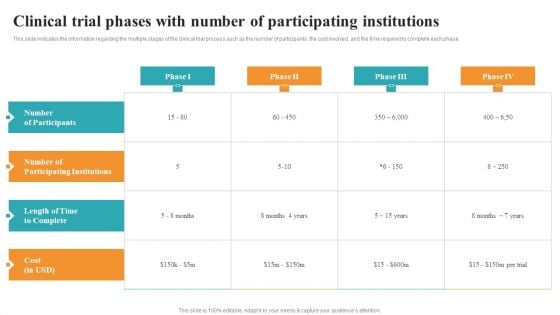
Clinical Trial Phases With Number Of Participating Institutions Medical Research Phases For Clinical Tests Mockup PDF
This slide indicates the information regarding the multiple stages of the clinical trial process such as the number of participants, the cost involved, and the time required to complete each phase. Boost your pitch with our creative Clinical Trial Phases With Number Of Participating Institutions Medical Research Phases For Clinical Tests Mockup PDF. Deliver an awe-inspiring pitch that will mesmerize everyone. Using these presentation templates you will surely catch everyones attention. You can browse the ppts collection on our website. We have researchers who are experts at creating the right content for the templates. So you do not have to invest time in any additional work. Just grab the template now and use them.
Clinical Trial Phases With Number Of Participating Institutions Clinical Research Trial Phases Icons PDF
This slide indicates the information regarding the multiple stages of the clinical trial process such as the number of participants, the cost involved, and the time required to complete each phase. Formulating a presentation can take up a lot of effort and time, so the content and message should always be the primary focus. The visuals of the PowerPoint can enhance the presenters message, so our Clinical Trial Phases With Number Of Participating Institutions Clinical Research Trial Phases Icons PDF was created to help save time. Instead of worrying about the design, the presenter can concentrate on the message while our designers work on creating the ideal templates for whatever situation is needed. Slidegeeks has experts for everything from amazing designs to valuable content, we have put everything into Clinical Trial Phases With Number Of Participating Institutions Clinical Research Trial Phases Icons PDF
Cost And Purchase Order Procurement Dashboard Icons PDF
This slide provides an overview of the cost and purchase order-related performance indicators to improve efficiency and optimize processes. The dashboard includes the cost of the purchase order, cost reduction, savings, procurement ROI and top 5 suppliers. If you are looking for a format to display your unique thoughts, then the professionally designed Cost And Purchase Order Procurement Dashboard Icons PDF is the one for you. You can use it as a Google Slides template or a PowerPoint template. Incorporate impressive visuals, symbols, images, and other charts. Modify or reorganize the text boxes as you desire. Experiment with shade schemes and font pairings. Alter, share or cooperate with other people on your work. Download Cost And Purchase Order Procurement Dashboard Icons PDF and find out how to give a successful presentation. Present a perfect display to your team and make your presentation unforgettable.
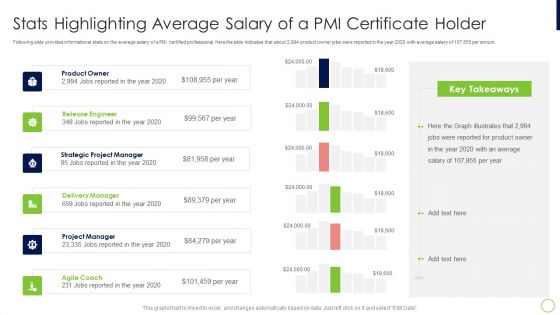
Agile Professional Certification PMI IT Stats Highlighting Average Salary Elements PDF
Following slide provides informational stats on the average salary of a PMI certified professional. Here the slide indicates that about 2,994 product owner jobs were reported in the year 2020 with average salary of 107,855 per annum.Deliver an awe inspiring pitch with this creative agile professional certification pmi it stats highlighting average salary elements pdf bundle. Topics like release engineer, strategic project manager, delivery manager can be discussed with this completely editable template. It is available for immediate download depending on the needs and requirements of the user.
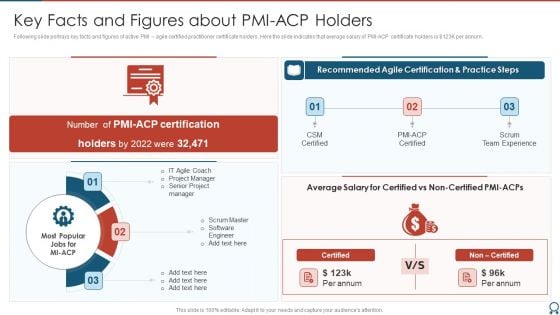
Agile Certified Professional Key Facts And Figures About PMI ACP Holders Ideas PDF
Following slide portrays key facts and figures of active PMI agile certified practitioner certificate holders. Here the slide indicates that average salary of PMI ACP certificate holders is dollar 123K per annum. Presenting Agile Certified Professional Key Facts And Figures About PMI ACP Holders Ideas PDF to provide visual cues and insights. Share and navigate important information on three stages that need your due attention. This template can be used to pitch topics like IT Agile Coach, Project Manager, Senior Project Manager. In addtion, this PPT design contains high resolution images, graphics, etc, that are easily editable and available for immediate download.
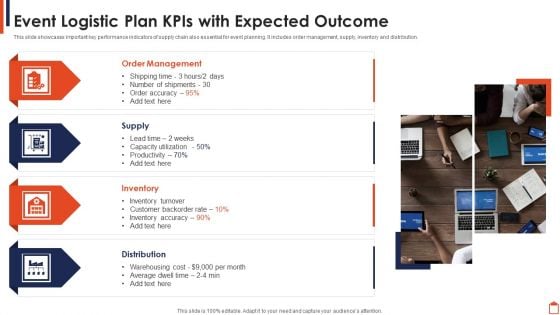
Event Logistic Plan Kpis With Expected Outcome Infographics PDF
This slide showcases important key performance indicators of supply chain also essential for event planning. It includes order management, supply, inventory and distribution.Persuade your audience using this Event Logistic Plan Kpis With Expected Outcome Infographics PDF This PPT design covers four stages, thus making it a great tool to use. It also caters to a variety of topics including Order Management, Inventory Turnover, Distribution Download this PPT design now to present a convincing pitch that not only emphasizes the topic but also showcases your presentation skills.
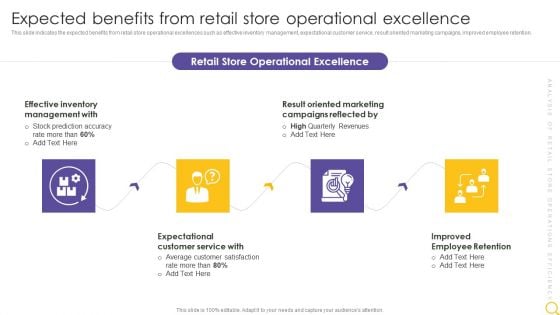
Retail Outlet Operational Efficiency Analytics Expected Benefits From Retail Store Professional PDF
This slide indicates the expected benefits from retail store operational excellences such as effective inventory management, expectational customer service, result oriented marketing campaigns, improved employee retention. This is a Retail Outlet Operational Efficiency Analytics Expected Benefits From Retail Store Professional PDF template with various stages. Focus and dispense information on four stages using this creative set, that comes with editable features. It contains large content boxes to add your information on topics like Effective Inventory Management, Result Oriented, Marketing Campaigns. You can also showcase facts, figures, and other relevant content using this PPT layout. Grab it now.
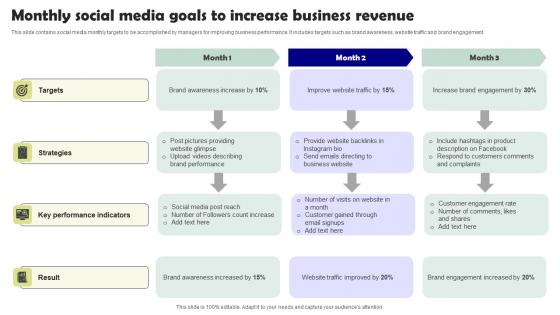
Monthly Social Media Goals To Increase Business Revenue Template Pdf
This slide contains social media monthly targets to be accomplished by managers for improving business performance. It includes targets such as brand awareness, website traffic and brand engagement. Pitch your topic with ease and precision using this Monthly Social Media Goals To Increase Business Revenue Template Pdf. This layout presents information on Targets, Strategies, Key Performance Indicators. It is also available for immediate download and adjustment. So, changes can be made in the color, design, graphics or any other component to create a unique layout. This slide contains social media monthly targets to be accomplished by managers for improving business performance. It includes targets such as brand awareness, website traffic and brand engagement.
Ppt Theme 3d Illustration Of Straightaway Arrow Flow Activity Charts Diagram 7 Image
We present our PPT Theme 3d illustration of straightaway arrow flow activity charts diagram 7 Image. Use our Arrows PowerPoint Templates because, Like your thoughts arrows are inherently precise and true. Use our Symbol PowerPoint Templates because; represent the progress in our lives. Use our Business PowerPoint Templates because, You have the process in your head, our template design showing will illuminate your thoughts. Use our Process and Flows PowerPoint Templates because, you have analyzed the illness and know the need. Use our Marketing PowerPoint Templates because, now fire the arrows to emblazon the desired path by which you will achieve anticipated results. Use these PowerPoint slides for presentations relating to Aim, Angle, Arrow, Arrowheads, Badge, Banner, Connection, Curve, Design, Direction, Download, Element, Fuchsia, Icon, Illustration, Indicator, Internet, Label, Link, Magenta, Mark, Marker, Next, Object, Orientation, Pointer, Shadow, Shape, Signs, Symbol. The prominent colors used in the PowerPoint template are Green, Gray, and Black Dare to dream with our Ppt Theme 3d Illustration Of Straightaway Arrow Flow Activity Charts Diagram 7 Image. You will come out on top.

Ppt Background 3d Illustration Of 5 Phase Diagram Partnership Transaction 6 Image
We present our PPT Background 3d illustration of 5 phase diagram partnership transaction 6 Image. Use our Arrows PowerPoint Templates because, It is a step by step process with levels rising at every stage. Use our Circle Charts PowerPoint Templates because, You have it all down to a T. Use our Shapes PowerPoint Templates because, Illustrate your ideas and imprint them in the minds of your team with this template. Use our Business PowerPoint Templates because; Break it all down to Key Result Areas. Use our Process and Flows PowerPoint Templates because, they are indicators of the path you have in mind. Use these PowerPoint slides for presentations relating to background, blog, business, chain, communication, connection, constructive, contact, design, diagonal, dialog, digital, flow, global, interaction, internet, line, linear, network, partner, pointer, reaction, social, stream, structure, system, team,. The prominent colors used in the PowerPoint template are Pink, Gray, and Black Our Ppt Background 3d Illustration Of 5 Phase Diagram Partnership Transaction 6 Image are fairly far sighted. They help you see clearly into the distance.
Ppt Theme 3d Illustration Of Straightaway Arrow Flow PowerPoint Diagram 12 Image
We present our PPT Theme 3d illustration of straightaway arrow flow PowerPoint diagram 12 Image. Use our Arrows PowerPoint Templates because, they enhance the essence of your viable ideas. Use our Symbol PowerPoint Templates because, the structure of our templates allows you to effectively highlight the key issues concerning the growth of your business. Use our Business PowerPoint Templates because, they pinpoint the core values of your organization. Use our Process and Flows PowerPoint Templates because, you understand the ailment and how to fight it. Use our Marketing PowerPoint Templates because; discuss each path to the smallest detail. Use these PowerPoint slides for presentations relating to Aim, Angle, Arrow, Arrowheads, Badge, Banner, Connection, Curve, Design, Direction, Download, Element, Fuchsia, Icon, Illustration, Indicator, Internet, Label, Link, Magenta, Mark, Marker, Next, Object, Orientation, Pointer, Shadow, Shape, Signs, Symbol. The prominent colors used in the PowerPoint template are Yellow, Gray, and Black Create the aroma with our Ppt Theme 3d Illustration Of Straightaway Arrow Flow PowerPoint Diagram 12 Image. Draw the crowds to your views.
Ppt Theme 3d Linear Abstraction To Show Five PowerPoint Slide Numbers Business Issues 1 Image
We present our PPT Theme 3d linear Abstraction to show five PowerPoint slide numbers business issues 1 Image. Use our Arrows PowerPoint Templates because, Activities which in themselves have many inherent business opportunities. Use our Symbol PowerPoint Templates because; heighten the anticipation of your audience with this slide listing. Use our Business PowerPoint Templates because, we offer you a range of options to garner their interest. Use our Process and Flows PowerPoint Templates because; anoint it with your really bright ideas. Use our Marketing PowerPoint Templates because, But it cannot be gained to desired levels in one go. Use these PowerPoint slides for presentations relating to Aim, Angle, Arrow, Arrowheads, Badge, Banner, Connection, Curve, Design, Direction, Download, Element, Fuchsia, Icon, Illustration, Indicator, Internet, Label, Link, Magenta, Mark, Marker, Next, Object, Orientation, Pointer, Shadow, Shape, Signs, Symbol. The prominent colors used in the PowerPoint template are Green, Green dark, Black Our Ppt Theme 3d Linear Abstraction To Show Five PowerPoint Slide Numbers Business Issues 1 Image pick up on many a fable. They contain the wisdom of business lore.
Ppt Theme Beeline Flow Manner Charts Arrow Ishikawa Diagram PowerPoint Template 9 Design
We present our PPT Theme beeline flow manner charts arrow ishikawa diagram PowerPoint template 9 design. Use our Arrows PowerPoint Templates because, you have a great training programmed in mind to upgrade the skills of your staff. Use our Symbol PowerPoint Templates because, to achieve sure shot success they need to come together at the right time, place and manner. Use our Business PowerPoint Templates because, Marketing Strategy Business Template: - Maximizing sales of your product is the intended destination. Use our Process and Flows PowerPoint Templates because, our ready backdrops leave a lasting impression. Use our Marketing PowerPoint Templates because, you have the people in place, selected the team leaders and all are raring to go. Use these PowerPoint slides for presentations relating to Aim, Angle, Arrow, Arrowheads, Badge, Banner, Connection, Curve, Design, Direction, Download, Element, Fuchsia, Icon, Illustration, Indicator, Internet, Label, Link, Magenta, Mark, Marker, Next, Object, Orientation, Pointer, Shadow, Shape, Signs, Symbol. The prominent colors used in the PowerPoint template are Blue, Gray, and Black Become a leader with our Ppt Theme Beeline Flow Manner Charts Arrow Ishikawa Diagram PowerPoint Template 9 Design. You will come out on top.
Templates Download Statistics Business Plan For Small PowerPoint Slides
We present our templates download statistics business plan for small PowerPoint Slides.Download our Process and Flows PowerPoint Templates because Our PowerPoint Templates and Slides will give you great value for your money. Be assured of finding the best projection to highlight your words. Present our Circle Charts PowerPoint Templates because You should Press the right buttons with our PowerPoint Templates and Slides. They will take your ideas down the perfect channel. Download our Shapes PowerPoint Templates because It will get your audience in sync. Download our Business PowerPoint Templates because You will get more than you ever bargained for. Download and present our Marketing PowerPoint Templates because Our PowerPoint Templates and Slides are focused like a searchlight beam. They highlight your ideas for your target audience.Use these PowerPoint slides for presentations relating to Infographic, graph, chart, data, icon, diagram, progress, bar, line, download, button, pie, search, time, statistics, percent, segment, cloud, business, concept, sign,loading, symbol, template, circle, graphic, full, element, report, level, black, shape, computer, modern, status, visualization, round, section, web,design, statistics, growth, colorful, info, stats, information, indicator. The prominent colors used in the PowerPoint template are Green, Gray, Black. Get up real close with our Templates Download Statistics Business Plan For Small PowerPoint Slides. Your goals will come within touching distance.
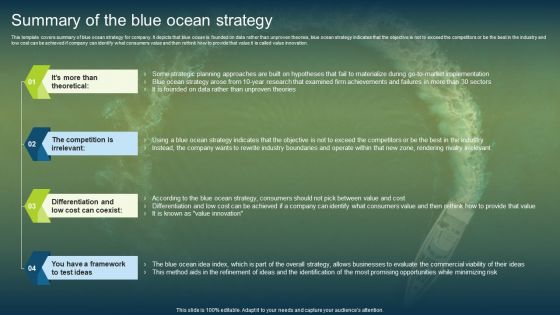
Unconstrained Market Growth Using Blue Ocean Strategies Summary Blue Ocean Strategy Summary PDF
This template covers summary of blue ocean strategy for company. It depicts that blue ocean is founded on data rather than unproven theories, blue ocean strategy indicates that the objective is not to exceed the competitors or be the best in the industry and low cost can be achieved if company can identify what consumers value and then rethink how to provide that value it is called value innovation. Presenting this PowerPoint presentation, titled Unconstrained Market Growth Using Blue Ocean Strategies Summary Blue Ocean Strategy Summary PDF, with topics curated by our researchers after extensive research. This editable presentation is available for immediate download and provides attractive features when used. Download now and captivate your audience. Presenting this Unconstrained Market Growth Using Blue Ocean Strategies Summary Blue Ocean Strategy Summary PDF. Our researchers have carefully researched and created these slides with all aspects taken into consideration. This is a completely customizable Unconstrained Market Growth Using Blue Ocean Strategies Summary Blue Ocean Strategy Summary PDF that is available for immediate downloading. Download now and make an impact on your audience. Highlight the attractive features available with our PPTs.
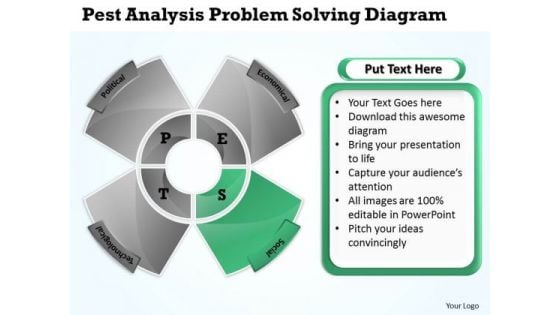
Business Structure Diagram Pest Analysis Problem Solving PowerPoint Slides
We present our business structure diagram pest analysis problem solving PowerPoint Slides.Download and present our Advertising PowerPoint Templates because It will let you Set new benchmarks with our PowerPoint Templates and Slides. They will keep your prospects well above par. Download our Shapes PowerPoint Templates because Our PowerPoint Templates and Slides will bullet point your ideas. See them fall into place one by one. Use our Business PowerPoint Templates because our PowerPoint Templates and Slides are the string of your bow. Fire of your ideas and conquer the podium. Present our Process and Flows PowerPoint Templates because Our PowerPoint Templates and Slides will embellish your thoughts. See them provide the desired motivation to your team. Download our Metaphors-Visual Concepts PowerPoint Templates because Our PowerPoint Templates and Slides ensures Effective communication. They help you put across your views with precision and clarity.Use these PowerPoint slides for presentations relating to Actions, analyze, business, commerce, concept, conceptual, define, design, diagram, direction, guidelines, icon, implement, improve, indicators, integration, key, manage, management, mba, model, optimize, organization, performance, process, resentation, resource, review, selling, solution, solve, system, theoretical, theory, tool. The prominent colors used in the PowerPoint template are Green, Gray, Black. The feedback we get is that our business structure diagram pest analysis problem solving PowerPoint Slides will save the presenter time. The feedback we get is that our conceptual PowerPoint templates and PPT Slides are second to none. Professionals tell us our business structure diagram pest analysis problem solving PowerPoint Slides are readymade to fit into any presentation structure. Professionals tell us our concept PowerPoint templates and PPT Slides are topically designed to provide an attractive backdrop to any subject. Presenters tell us our business structure diagram pest analysis problem solving PowerPoint Slides are effectively colour coded to prioritise your plans They automatically highlight the sequence of events you desire. You can be sure our business PowerPoint templates and PPT Slides are designed to make your presentations professional. Our Business Structure Diagram Pest Analysis Problem Solving PowerPoint Slides will keep u sane. Your thoughts will bolt across the line.
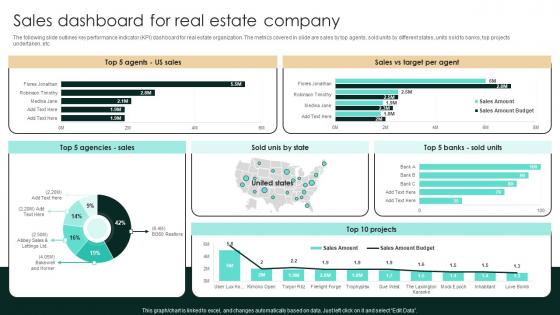
Sales Dashboard For Real Estate Company Strategic Real Estate Introduction Pdf
The following slide outlines key performance indicator KPI dashboard for real estate organization. The metrics covered in slide are sales by top agents, sold units by different states, units sold to banks, top projects undertaken, etc. If you are looking for a format to display your unique thoughts, then the professionally designed Sales Dashboard For Real Estate Company Strategic Real Estate Introduction Pdf is the one for you. You can use it as a Google Slides template or a PowerPoint template. Incorporate impressive visuals, symbols, images, and other charts. Modify or reorganize the text boxes as you desire. Experiment with shade schemes and font pairings. Alter, share or cooperate with other people on your work. Download Sales Dashboard For Real Estate Company Strategic Real Estate Introduction Pdf and find out how to give a successful presentation. Present a perfect display to your team and make your presentation unforgettable. The following slide outlines key performance indicator KPI dashboard for real estate organization. The metrics covered in slide are sales by top agents, sold units by different states, units sold to banks, top projects undertaken, etc.
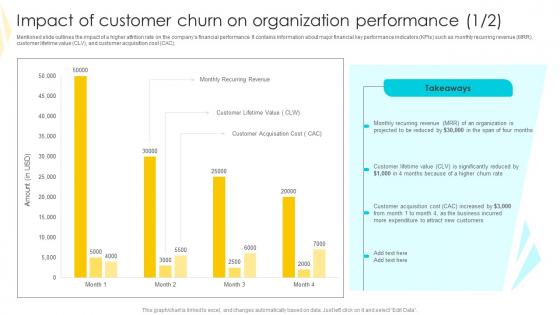
Impact Of Customer Churn On Strategies To Mitigate Customer Churn Template Pdf
Mentioned slide outlines the impact of a higher attrition rate on the companys financial performance. It contains information about major financial key performance indicators KPIs such as monthly recurring revenue MRR, customer lifetime value CLV, and customer acquisition cost CAC. If you are looking for a format to display your unique thoughts, then the professionally designed Impact Of Customer Churn On Strategies To Mitigate Customer Churn Template Pdf is the one for you. You can use it as a Google Slides template or a PowerPoint template. Incorporate impressive visuals, symbols, images, and other charts. Modify or reorganize the text boxes as you desire. Experiment with shade schemes and font pairings. Alter, share or cooperate with other people on your work. Download Impact Of Customer Churn On Strategies To Mitigate Customer Churn Template Pdf and find out how to give a successful presentation. Present a perfect display to your team and make your presentation unforgettable. Mentioned slide outlines the impact of a higher attrition rate on the companys financial performance. It contains information about major financial key performance indicators KPIs such as monthly recurring revenue MRR, customer lifetime value CLV, and customer acquisition cost CAC.
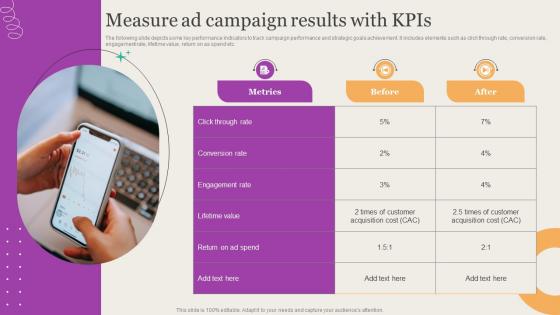
Leveraging Mobile Marketing Strategies Measure Ad Campaign Results With Kpis Topics Pdf
The following slide depicts some key performance indicators to track campaign performance and strategic goals achievement. It includes elements such as click through rate, conversion rate, engagement rate, lifetime value, return on as spend etc. If you are looking for a format to display your unique thoughts, then the professionally designed Leveraging Mobile Marketing Strategies Measure Ad Campaign Results With Kpis Topics Pdf is the one for you. You can use it as a Google Slides template or a PowerPoint template. Incorporate impressive visuals, symbols, images, and other charts. Modify or reorganize the text boxes as you desire. Experiment with shade schemes and font pairings. Alter, share or cooperate with other people on your work. Download Leveraging Mobile Marketing Strategies Measure Ad Campaign Results With Kpis Topics Pdf and find out how to give a successful presentation. Present a perfect display to your team and make your presentation unforgettable. The following slide depicts some key performance indicators to track campaign performance and strategic goals achievement. It includes elements such as click through rate, conversion rate, engagement rate, lifetime value, return on as spend etc.
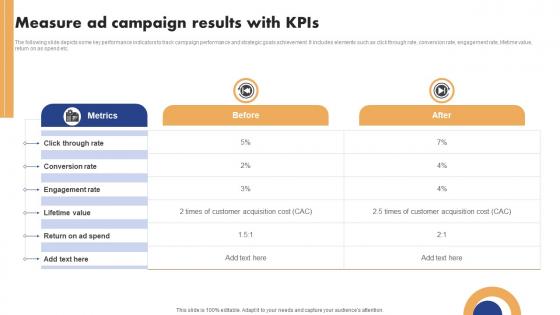
Mobile Ad Campaign Launch Strategy Measure Ad Campaign Results With KPIs Formats Pdf
The following slide depicts some key performance indicators to track campaign performance and strategic goals achievement. It includes elements such as click through rate, conversion rate, engagement rate, lifetime value, return on as spend etc. If you are looking for a format to display your unique thoughts, then the professionally designed Mobile Ad Campaign Launch Strategy Measure Ad Campaign Results With KPIs Formats Pdf is the one for you. You can use it as a Google Slides template or a PowerPoint template. Incorporate impressive visuals, symbols, images, and other charts. Modify or reorganize the text boxes as you desire. Experiment with shade schemes and font pairings. Alter, share or cooperate with other people on your work. Download Mobile Ad Campaign Launch Strategy Measure Ad Campaign Results With KPIs Formats Pdf and find out how to give a successful presentation. Present a perfect display to your team and make your presentation unforgettable. The following slide depicts some key performance indicators to track campaign performance and strategic goals achievement. It includes elements such as click through rate, conversion rate, engagement rate, lifetime value, return on as spend etc.
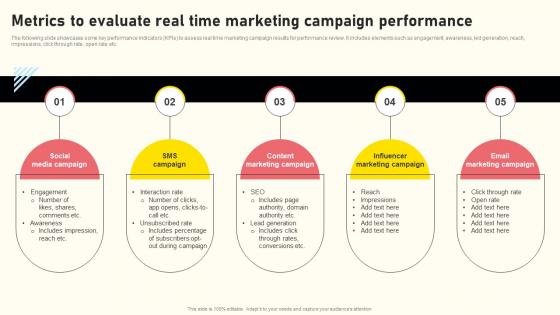
Effective Real Time Marketing Principles Metrics To Evaluate Real Time Marketing Pictures Pdf
The following slide showcases some key performance indicators KPIs to assess real time marketing campaign results for performance review. It includes elements such as engagement, awareness, led generation, reach, impressions, click through rate, open rate etc. Find highly impressive Effective Real Time Marketing Principles Metrics To Evaluate Real Time Marketing Pictures Pdf on Slidegeeks to deliver a meaningful presentation. You can save an ample amount of time using these presentation templates. No need to worry to prepare everything from scratch because Slidegeeks experts have already done a huge research and work for you. You need to download Effective Real Time Marketing Principles Metrics To Evaluate Real Time Marketing Pictures Pdf for your upcoming presentation. All the presentation templates are 100 percent editable and you can change the color and personalize the content accordingly. Download now The following slide showcases some key performance indicators KPIs to assess real time marketing campaign results for performance review. It includes elements such as engagement, awareness, led generation, reach, impressions, click through rate, open rate etc.
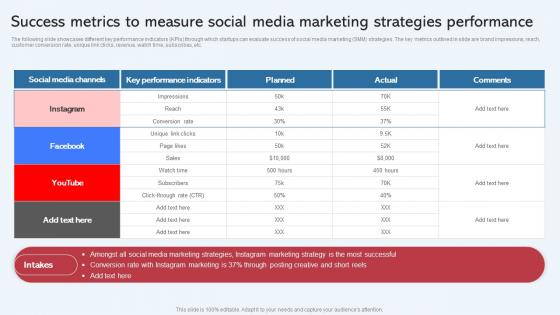
Success Metrics To Measure Social Media Marketing Strategies Effective Startup Mockup Microsoft Pdf
The following slide showcases different key performance indicators KPIs through which startups can evaluate success of social media marketing SMM strategies. The key metrics outlined in slide are brand impressions, reach, customer conversion rate, unique link clicks, revenue, watch time, subscribes, etc. Boost your pitch with our creative Success Metrics To Measure Social Media Marketing Strategies Effective Startup Mockup Microsoft Pdf. Deliver an awe inspiring pitch that will mesmerize everyone. Using these presentation templates you will surely catch everyones attention. You can browse the ppts collection on our website. We have researchers who are experts at creating the right content for the templates. So you do not have to invest time in any additional work. Just grab the template now and use them. The following slide showcases different key performance indicators KPIs through which startups can evaluate success of social media marketing SMM strategies. The key metrics outlined in slide are brand impressions, reach, customer conversion rate, unique link clicks, revenue, watch time, subscribes, etc.
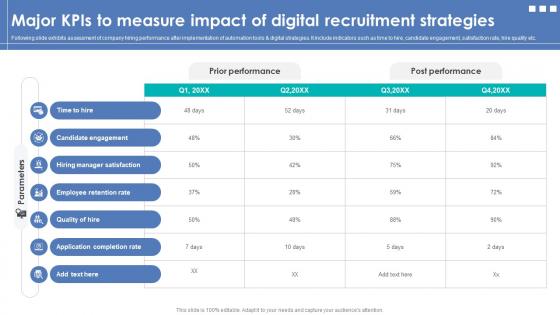
Integrating Automation For Effective Business Major Kpis To Measure Impact Of Digital Recruitment
Following slide exhibits assessment of company hiring performance after implementation of automation tools and digital strategies. It include indicators such as time to hire, candidate engagement, satisfaction rate, hire quality etc. Formulating a presentation can take up a lot of effort and time, so the content and message should always be the primary focus. The visuals of the PowerPoint can enhance the presenters message, so our Integrating Automation For Effective Business Major Kpis To Measure Impact Of Digital Recruitment was created to help save time. Instead of worrying about the design, the presenter can concentrate on the message while our designers work on creating the ideal templates for whatever situation is needed. Slidegeeks has experts for everything from amazing designs to valuable content, we have put everything into Integrating Automation For Effective Business Major Kpis To Measure Impact Of Digital Recruitment. Following slide exhibits assessment of company hiring performance after implementation of automation tools and digital strategies. It include indicators such as time to hire, candidate engagement, satisfaction rate, hire quality etc.

KPI Measuring After Implementing Restaurant Marketing Strategies Create An Effective Restaurant
The following slide showcases various key performance indicators KPIs through which marketers can evaluate the success of traditional marketing performance. The metrics mentioned in slide are customer acquisition cost CAC, cross-sells, referrals, sales per square foot, repeat purchase rate, foot traffic, average order value, etc. Formulating a presentation can take up a lot of effort and time, so the content and message should always be the primary focus. The visuals of the PowerPoint can enhance the presenters message, so our KPI Measuring After Implementing Restaurant Marketing Strategies Create An Effective Restaurant was created to help save time. Instead of worrying about the design, the presenter can concentrate on the message while our designers work on creating the ideal templates for whatever situation is needed. Slidegeeks has experts for everything from amazing designs to valuable content, we have put everything into KPI Measuring After Implementing Restaurant Marketing Strategies Create An Effective Restaurant. The following slide showcases various key performance indicators KPIs through which marketers can evaluate the success of traditional marketing performance. The metrics mentioned in slide are customer acquisition cost CAC, cross-sells, referrals, sales per square foot, repeat purchase rate, foot traffic, average order value, etc.
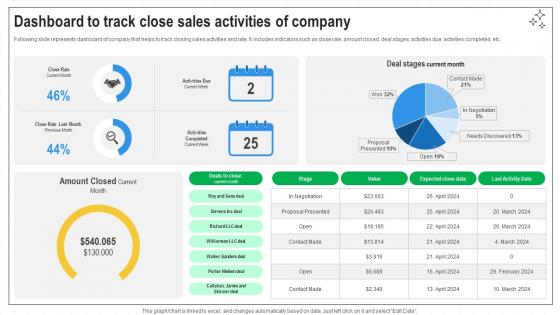
Closing Techniques To Seal Dashboard To Track Close Sales Activities Of Company SA SS V
Following slide represents dashboard of company that helps to track closing sales activities and rate. It includes indicators such as close rate, amount closed, deal stages, activities due, activities completed, etc. If you are looking for a format to display your unique thoughts, then the professionally designed Closing Techniques To Seal Dashboard To Track Close Sales Activities Of Company SA SS V is the one for you. You can use it as a Google Slides template or a PowerPoint template. Incorporate impressive visuals, symbols, images, and other charts. Modify or reorganize the text boxes as you desire. Experiment with shade schemes and font pairings. Alter, share or cooperate with other people on your work. Download Closing Techniques To Seal Dashboard To Track Close Sales Activities Of Company SA SS V and find out how to give a successful presentation. Present a perfect display to your team and make your presentation unforgettable. Following slide represents dashboard of company that helps to track closing sales activities and rate. It includes indicators such as close rate, amount closed, deal stages, activities due, activities completed, etc.
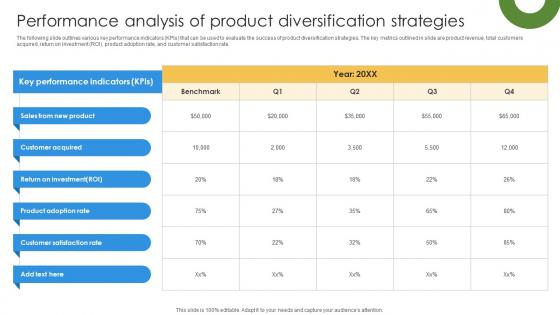
Marketing Growth Strategy To Strengthen Performance Analysis Of Product Strategy SS V
The following slide outlines various key performance indicators KPIs that can be used to evaluate the success of product diversification strategies. The key metrics outlined in slide are product revenue, total customers acquired, return on investment ROI, product adoption rate, and customer satisfaction rate. If you are looking for a format to display your unique thoughts, then the professionally designed Marketing Growth Strategy To Strengthen Performance Analysis Of Product Strategy SS V is the one for you. You can use it as a Google Slides template or a PowerPoint template. Incorporate impressive visuals, symbols, images, and other charts. Modify or reorganize the text boxes as you desire. Experiment with shade schemes and font pairings. Alter, share or cooperate with other people on your work. Download Marketing Growth Strategy To Strengthen Performance Analysis Of Product Strategy SS V and find out how to give a successful presentation. Present a perfect display to your team and make your presentation unforgettable. The following slide outlines various key performance indicators KPIs that can be used to evaluate the success of product diversification strategies. The key metrics outlined in slide are product revenue, total customers acquired, return on investment ROI, product adoption rate, and customer satisfaction rate.

Digital Content Performance Assessment Top Of The Funnel Digital Content Strategy SS V
The following slide depicts key performance indicators of digital content marketing to monitor results. It includes elements such as page views, social shares, click through rate, blog subscribers, conversions, opportunities influenced, average time on page etc. Find highly impressive Digital Content Performance Assessment Top Of The Funnel Digital Content Strategy SS V on Slidegeeks to deliver a meaningful presentation. You can save an ample amount of time using these presentation templates. No need to worry to prepare everything from scratch because Slidegeeks experts have already done a huge research and work for you. You need to download Digital Content Performance Assessment Top Of The Funnel Digital Content Strategy SS V for your upcoming presentation. All the presentation templates are 100 percent editable and you can change the color and personalize the content accordingly. Download now The following slide depicts key performance indicators of digital content marketing to monitor results. It includes elements such as page views, social shares, click through rate, blog subscribers, conversions, opportunities influenced, average time on page etc.
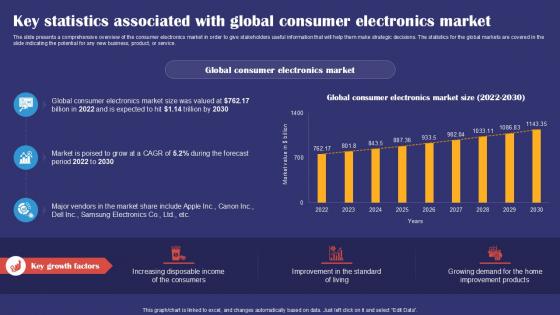
Key Statistics Associated With Global Consumer Electronics Smartphones Industry Report PPT PowerPoint IR SS V
The slide presents a comprehensive overview of the consumer electronics market in order to give stakeholders useful information that will help them make strategic decisions. The statistics for the global markets are covered in the slide indicating the potential for any new business, product, or service. Find highly impressive Key Statistics Associated With Global Consumer Electronics Smartphones Industry Report PPT PowerPoint IR SS V on Slidegeeks to deliver a meaningful presentation. You can save an ample amount of time using these presentation templates. No need to worry to prepare everything from scratch because Slidegeeks experts have already done a huge research and work for you. You need to download Key Statistics Associated With Global Consumer Electronics Smartphones Industry Report PPT PowerPoint IR SS V for your upcoming presentation. All the presentation templates are 100 percent editable and you can change the color and personalize the content accordingly. Download now The slide presents a comprehensive overview of the consumer electronics market in order to give stakeholders useful information that will help them make strategic decisions. The statistics for the global markets are covered in the slide indicating the potential for any new business, product, or service.
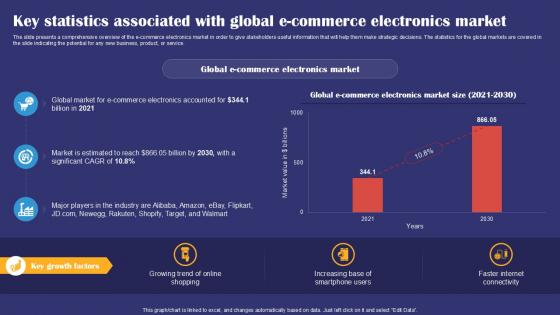
Key Statistics Associated With Global E Commerce Smartphones Industry Report PPT Presentation IR SS V
The slide presents a comprehensive overview of the e commerce electronics market in order to give stakeholders useful information that will help them make strategic decisions. The statistics for the global markets are covered in the slide indicating the potential for any new business, product, or service. If you are looking for a format to display your unique thoughts, then the professionally designed Key Statistics Associated With Global E Commerce Smartphones Industry Report PPT Presentation IR SS V is the one for you. You can use it as a Google Slides template or a PowerPoint template. Incorporate impressive visuals, symbols, images, and other charts. Modify or reorganize the text boxes as you desire. Experiment with shade schemes and font pairings. Alter, share or cooperate with other people on your work. Download Key Statistics Associated With Global E Commerce Smartphones Industry Report PPT Presentation IR SS V and find out how to give a successful presentation. Present a perfect display to your team and make your presentation unforgettable. The slide presents a comprehensive overview of the e commerce electronics market in order to give stakeholders useful information that will help them make strategic decisions. The statistics for the global markets are covered in the slide indicating the potential for any new business, product, or service.
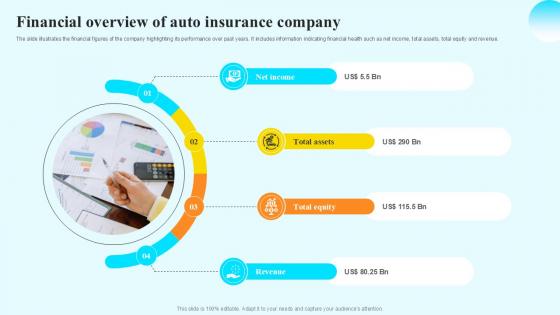
Financial Overview Of Auto Steps By Step Guide For Claiming Car PPT Sample
The slide illustrates the financial figures of the company highlighting its performance over past years. It includes information indicating financial health such as net income, total assets, total equity and revenue. If you are looking for a format to display your unique thoughts, then the professionally designed Financial Overview Of Auto Steps By Step Guide For Claiming Car PPT Sample is the one for you. You can use it as a Google Slides template or a PowerPoint template. Incorporate impressive visuals, symbols, images, and other charts. Modify or reorganize the text boxes as you desire. Experiment with shade schemes and font pairings. Alter, share or cooperate with other people on your work. Download Financial Overview Of Auto Steps By Step Guide For Claiming Car PPT Sample and find out how to give a successful presentation. Present a perfect display to your team and make your presentation unforgettable. The slide illustrates the financial figures of the company highlighting its performance over past years. It includes information indicating financial health such as net income, total assets, total equity and revenue.
Ppt Series To Present Concept Download Steps Four PowerPoint Templates
PPT series to present concept download steps four PowerPoint Templates-This series of steps diagram is indicator of the path you have in mind. This image has been conceived to enable you to emphatically communicate your ideas in your Business presentation-PPT series to present concept download steps four PowerPoint Templates-achieve, achievement, axis, background, banking, business, chart, company, concept, corporate, director, economic, flow, goal, graph, human, increase, law, line, management, maths, money, national, personel, plan, profit, resources, retail, revenue, shop, statistic, straight, success, target Stitch together the fabric of your thoughts. Thread through with our Ppt Series To Present Concept Download Steps Four PowerPoint Templates.
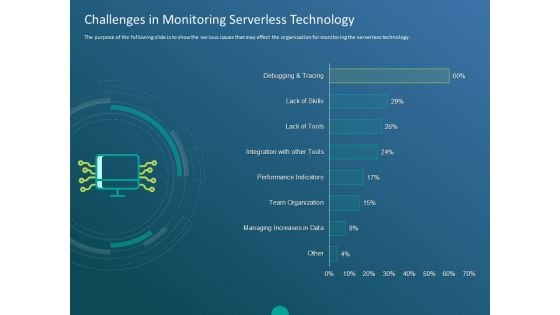
Functioning Of Serverless Computing Challenges In Monitoring Serverless Technology Ppt Design Ideas PDF
The purpose of the following slide is to show the various issues that may effect the organization for monitoring the serverless technology. Deliver an awe-inspiring pitch with this creative functioning of serverless computing challenges in monitoring serverless technology ppt design ideas pdf bundle. Topics like managing increases data, team organization, performance indicators, integration tools, lack tools, lack skills, debugging and tracing can be discussed with this completely editable template. It is available for immediate download depending on the needs and requirements of the user.
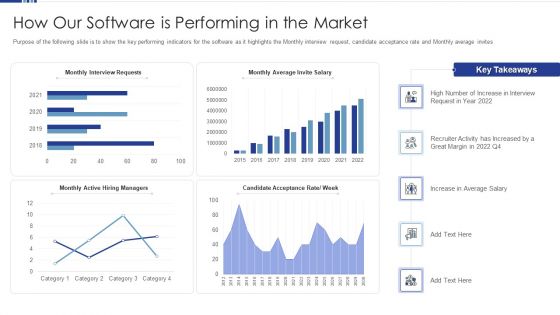
HR Software Solution Capital Funding Pitch Deck How Our Software Is Performing In The Market Infographics PDF
Purpose of the following slide is to show the key performing indicators for the software as it highlights the Monthly interview request, candidate acceptance rate and Monthly average invites Deliver an awe inspiring pitch with this creative hr software solution capital funding pitch deck how our software is performing in the market infographics pdf bundle. Topics like monthly interview requests, candidate acceptance, monthly active hiring managers can be discussed with this completely editable template. It is available for immediate download depending on the needs and requirements of the user.
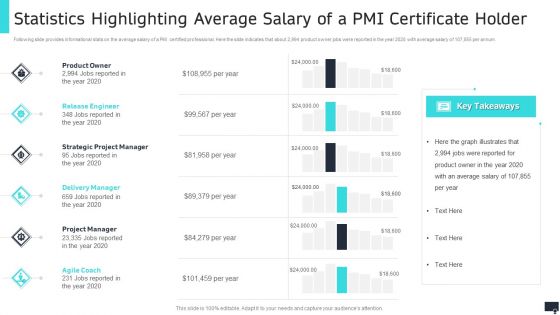
Pmi Agile Scrum Master Certification It Statistics Highlighting Average Salary Of A Pmi Certificate Holder Formats PDF
Following slide provides informational stats on the average salary of a PMI certified professional. Here the slide indicates that about 2,994 product owner jobs were reported in the year 2020 with average salary of 107,855 per annum. Deliver an awe inspiring pitch with this creative pmi agile scrum master certification it statistics highlighting average salary of a pmi certificate holder formats pdf bundle. Topics like product owner, release engineer, delivery manager can be discussed with this completely editable template. It is available for immediate download depending on the needs and requirements of the user.
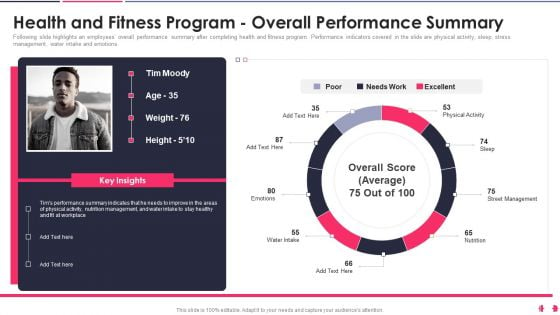
Health And Wellbeing Playbook Health And Fitness Program Overall Performance Summary Guidelines PDF
Following slide highlights an employees overall performance summary after completing health and fitness program. Performance indicators covered in the slide are physical activity, sleep, stress management, water intake and emotions. Deliver an awe inspiring pitch with this creative health and wellbeing playbook health and fitness program overall performance summary guidelines pdf bundle. Topics like health and fitness program overall performance summary can be discussed with this completely editable template. It is available for immediate download depending on the needs and requirements of the user.

Cybersecurity Monitoring Plan Steps In Detail Monitoring Network Traffic Summary PDF
This slide provides information about the third step in cybersecurity monitoring plan that must be implemented by the company and security monitoring manager in order to solve issues such as malware attacks, pnishing, ransomware, supply chain attacks etc. i.e., Monitoring Network Traffic. Presenting cybersecurity monitoring plan steps in detail monitoring network traffic summary pdf to provide visual cues and insights. Share and navigate important information on four stages that need your due attention. This template can be used to pitch topics like inbound and outbound traffic, could indicate attacks, unusual network traffic. In addtion, this PPT design contains high resolution images, graphics, etc, that are easily editable and available for immediate download.

Corporate Physical Health And Fitness Culture Playbook Healthy Eating Meal Plan For Weight Mockup PDF
Following slide displays health food indicator that can be used by employees for developing healthy eating habits. It also includes daily meal plan that will assist employees in successfully managing their body weight. Deliver and pitch your topic in the best possible manner with this corporate physical health and fitness culture playbook healthy eating meal plan for weight mockup pdf. Use them to share invaluable insights on protective foods, eat moderation, meal plan, intake essential nutrients and impress your audience. This template can be altered and modified as per your expectations. So, grab it now.
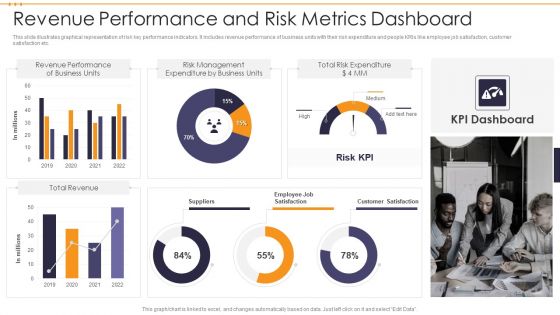
Revenue Performance And Risk Metrics Dashboard Demonstration PDF
This slide illustrates graphical representation of risk key performance indicators. It includes revenue performance of business units with their risk expenditure and people KRIs like employee job satisfaction, customer satisfaction etc. Showcasing this set of slides titled Revenue Performance And Risk Metrics Dashboard Demonstration PDF. The topics addressed in these templates are Total Risk Expenditure, Risk Management, Revenue Performance . All the content presented in this PPT design is completely editable. Download it and make adjustments in color, background, font etc. as per your unique business setting.
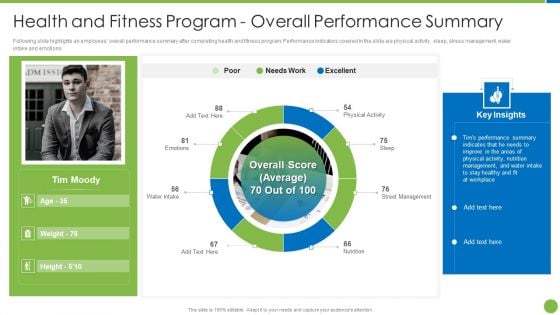
Playbook For Staff Wellbeing Health And Fitness Program Overall Performance Summary Clipart PDF
Following slide highlights an employees overall performance summary after completing health and fitness program. Performance indicators covered in the slide are physical activity, sleep, stress management, water intake and emotions. Presenting Playbook For Staff Wellbeing Health And Fitness Program Overall Performance Summary Clipart PDF to provide visual cues and insights. Share and navigate important information onone stage that need your due attention. This template can be used to pitch topics like Health And Fitness Program Overall Performance Summary. In addtion, this PPT design contains high resolution images, graphics, etc, that are easily editable and available for immediate download.
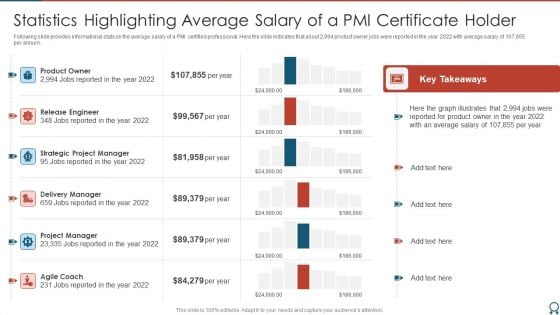
Agile Certified Professional Statistics Highlighting Average Salary Of A PMI Formats PDF
Following slide provides informational stats on the average salary of a PMI certified professional. Here the slide indicates that about 2,994 product owner jobs were reported in the year 2022 with average salary of 107,855 per annum. Deliver an awe inspiring pitch with this creative Agile Certified Professional Statistics Highlighting Average Salary Of A PMI Formats PDF bundle. Topics like Release Engineer, Product Owner, Strategic Project Manager can be discussed with this completely editable template. It is available for immediate download depending on the needs and requirements of the user.
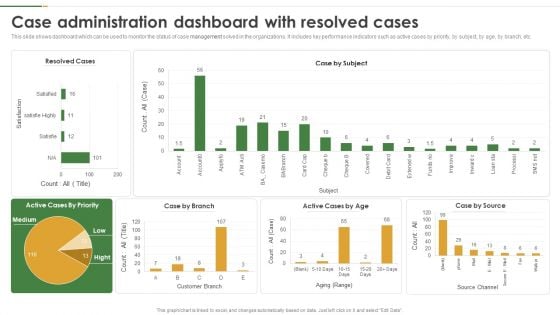
Case Administration Dashboard With Resolved Cases Graphics PDF
This slide shows dashboard which can be used to monitor the status of case management solved in the organizations. It includes key performance indicators such as active cases by priority, by subject, by age, by branch, etc. Pitch your topic with ease and precision using this Case Administration Dashboard With Resolved Cases Graphics PDF. This layout presents information on Case Administration Dashboard, Resolved Cases. It is also available for immediate download and adjustment. So, changes can be made in the color, design, graphics or any other component to create a unique layout.

Healthcare Big Data Assessment Dashboard Slide2 Introduction PDF
This slide covers the records about the patients used to describe massive volumes of information created by the adoption of digital technologies that collect patients records and help in managing hospital performance. Showcasing this set of slides titled Healthcare Big Data Assessment Dashboard Slide2 Introduction PDF. The topics addressed in these templates are Forecasted Patient Turnover, Service Indicators, Occupancy. All the content presented in this PPT design is completely editable. Download it and make adjustments in color, background, font etc. as per your unique business setting.
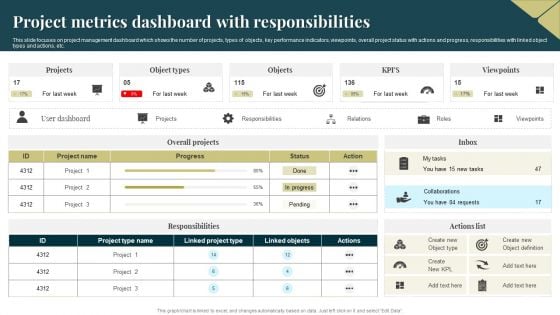
Project Metrics Dashboard With Responsibilities Graphics PDF
This slide focuses on project management dashboard which shows the number of projects, types of objects, key performance indicators, viewpoints, overall project status with actions and progress, responsibilities with linked object types and actions, etc. Pitch your topic with ease and precision using this Project Metrics Dashboard With Responsibilities Graphics PDF. This layout presents information on Project Metrics, Dashboard With Responsibilities. It is also available for immediate download and adjustment. So, changes can be made in the color, design, graphics or any other component to create a unique layout.
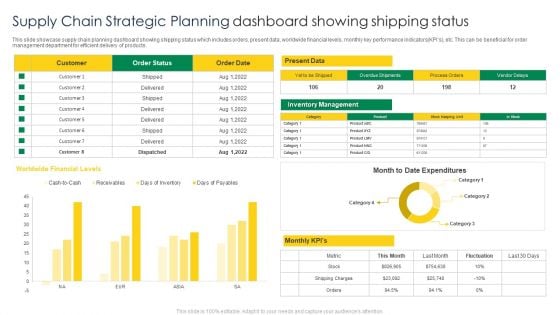
Supply Chain Strategic Planning Dashboard Showing Shipping Status Structure PDF
This slide showcase supply chain planning dashboard showing shipping status which includes orders, present data, worldwide financial levels, monthly key performance indicators KPIs, etc. This can be beneficial for order management department for efficient delivery of products. Showcasing this set of slides titled Supply Chain Strategic Planning Dashboard Showing Shipping Status Structure PDF. The topics addressed in these templates are Worldwide Financial Levels, Present Data, Customer. All the content presented in this PPT design is completely editable. Download it and make adjustments in color, background, font etc. as per your unique business setting.
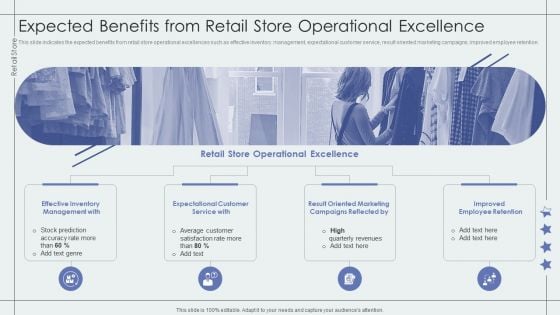
Expected Benefits From Retail Store Operational Excellence Retail Outlet Performance Assessment Summary PDF
This slide indicates the expected benefits from retail store operational excellences such as effective inventory management, expectational customer service, result oriented marketing campaigns, improved employee retention.Presenting Expected Benefits From Retail Store Operational Excellence Retail Outlet Performance Assessment Summary PDF to provide visual cues and insights. Share and navigate important information on four stages that need your due attention. This template can be used to pitch topics like Effective Inventory, Expectational Customer, Oriented Marketing. In addtion, this PPT design contains high resolution images, graphics, etc, that are easily editable and available for immediate download.
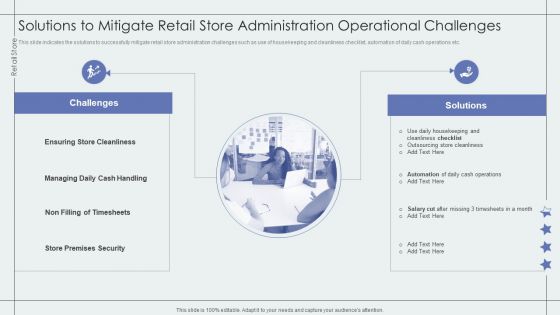
Solutions To Mitigate Retail Store Administration Operational Challenges Retail Outlet Performance Assessment Summary PDF
This slide indicates the solutions to successfully mitigate retail store administration challenges such as use of housekeeping and cleanliness checklist, automation of daily cash operations etc.This is a Solutions To Mitigate Retail Store Administration Operational Challenges Retail Outlet Performance Assessment Summary PDF template with various stages. Focus and dispense information on two stages using this creative set, that comes with editable features. It contains large content boxes to add your information on topics like Store Cleanliness, Managing Daily, Cash Handling. You can also showcase facts, figures, and other relevant content using this PPT layout. Grab it now.
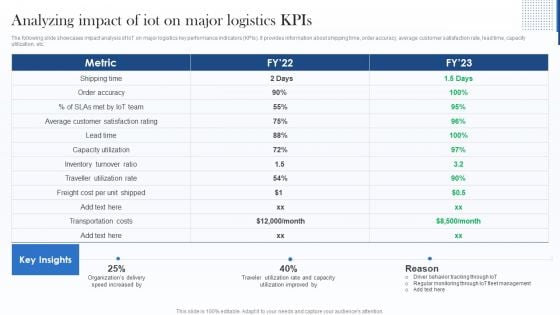
Analyzing Impact Of Iot On Major Logistics Kpis Structure PDF
The following slide showcases impact analysis of IoT on major logistics key performance indicators KPIs. It provides information about shipping time, order accuracy, average customer satisfaction rate, lead time, capacity utilization, etc. Deliver and pitch your topic in the best possible manner with this Analyzing Impact Of Iot On Major Logistics Kpis Structure PDF. Use them to share invaluable insights on Capacity Utilization, Organizations, Management and impress your audience. This template can be altered and modified as per your expectations. So, grab it now.
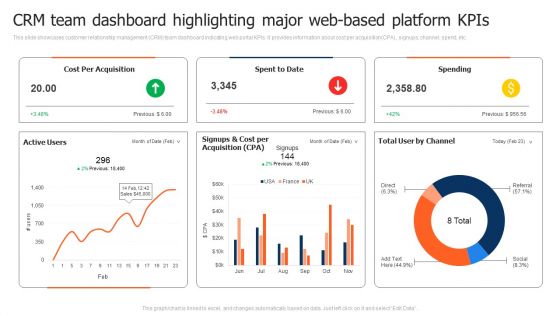
CRM Team Dashboard Highlighting Major Web Based Platform Kpis Template PDF
This slide showcases customer relationship management CRM team dashboard indicating web portal KPIs. It provides information about cost per acquisition CPA, signups, channel, spend, etc. Pitch your topic with ease and precision using this CRM Team Dashboard Highlighting Major Web Based Platform Kpis Template PDF. This layout presents information on CRM Team Dashboard Highlighting, Web Based Platform Kpis. It is also available for immediate download and adjustment. So, changes can be made in the color, design, graphics or any other component to create a unique layout.
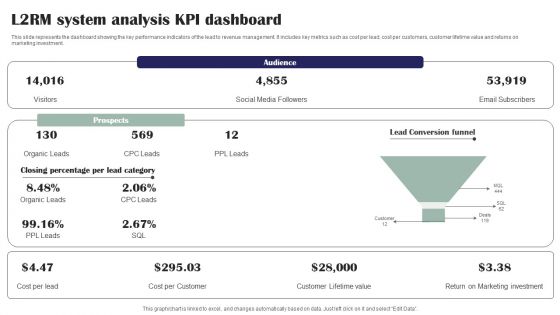
L2RM System Analysis KPI Dashboard Ppt PowerPoint Presentation File Microsoft PDF
This slide represents the dashboard showing the key performance indicators of the lead to revenue management. It includes key metrics such as cost per lead, cost per customers, customer lifetime value and returns on marketing investment. Presenting L2RM System Analysis KPI Dashboard Ppt PowerPoint Presentation File Microsoft PDF to dispense important information. This template comprises one stages. It also presents valuable insights into the topics including Audience, Prospects, Lead Conversion Funnel. This is a completely customizable PowerPoint theme that can be put to use immediately. So, download it and address the topic impactfully.
Sales L2RM System Tracking Key Metrics Dashboard Ppt Professional Format Ideas PDF
This slide represents the dashboard for tracking the key performance indicators of sales lead to revenue management. It includes key metrics such as leads by campaign, ratings, lead generation rate, top accounts by revenue and top owners by number of accounts. Showcasing this set of slides titled Sales L2RM System Tracking Key Metrics Dashboard Ppt Professional Format Ideas PDF. The topics addressed in these templates are Leads By Campaign, Leads By Rating, Leads Generation Rate. All the content presented in this PPT design is completely editable. Download it and make adjustments in color, background, font etc. as per your unique business setting.
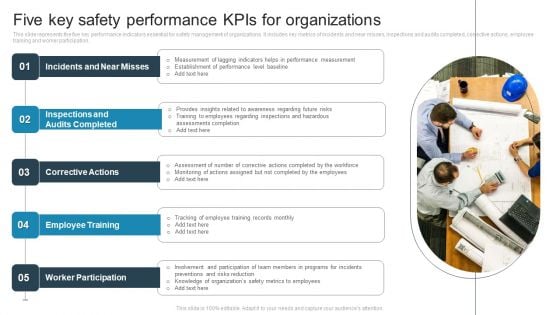
Five Key Safety Performance Kpis For Organizations Brochure PDF
This slide represents the five key performance indicators essential for safety management of organizations. It includes key metrics of incidents and near misses, inspections and audits completed, corrective actions, employee training and worker participation. Presenting Five Key Safety Performance Kpis For Organizations Brochure PDF to dispense important information. This template comprises Five stages. It also presents valuable insights into the topics including Incidents And Near Misses, Inspections And Audits Completed, Corrective Actions. This is a completely customizable PowerPoint theme that can be put to use immediately. So, download it and address the topic impactfully.
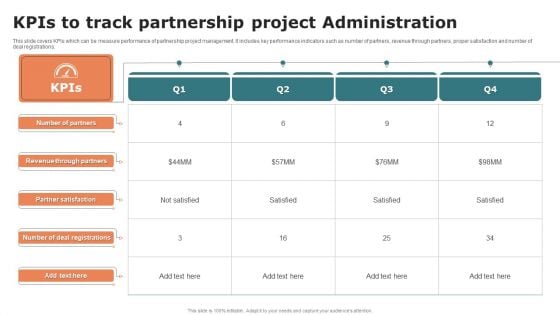
Kpis To Track Partnership Project Administration Graphics PDF
This slide covers KPIs which can be measure performance of partnership project management. It includes key performance indicators such as number of partners, revenue through partners, proper satisfaction and number of deal registrations. Pitch your topic with ease and precision using this Kpis To Track Partnership Project Administration Graphics PDF. This layout presents information on Partner Satisfaction, Revenue Through Partners, Number Of Partners. It is also available for immediate download and adjustment. So, changes can be made in the color, design, graphics or any other component to create a unique layout.
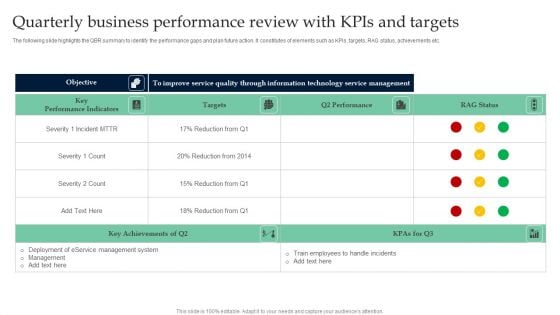
Quarterly Business Performance Review With Kpis And Targets Summary PDF
The following slide highlights the QBR summary to identify the performance gaps and plan future action. It constitutes of elements such as KPIs, targets, RAG status, achievements etc. Pitch your topic with ease and precision using this Quarterly Business Performance Review With Kpis And Targets Summary PDF. This layout presents information on Key Performance Indicators, Targets, Technology Service Management. It is also available for immediate download and adjustment. So, changes can be made in the color, design, graphics or any other component to create a unique layout.
Plan Dashboard For Tracking Location Wise Revenue Diagrams PDF
This slide presents a dashboard which will assist managers to track the revenue of each branch having geographical presence in different corners of the world. The key performance indicators are total revenue, location wise rent, branch performance among many others.Pitch your topic with ease and precision using this Plan Dashboard For Tracking Location Wise Revenue Diagrams PDF. This layout presents information on Taxes Paid, Current Month, Branch Performance, Previous Quarter. It is also available for immediate download and adjustment. So, changes can be made in the color, design, graphics or any other component to create a unique layout.


 Continue with Email

 Home
Home


