Snapshot
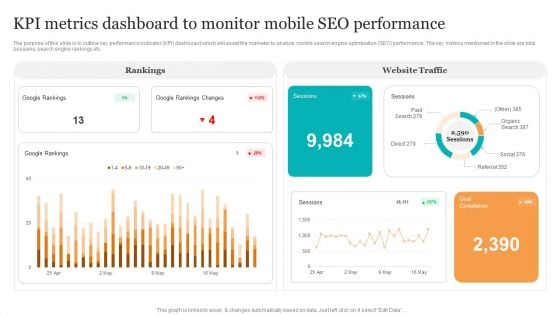
KPI Metrics Dashboard To Monitor Mobile Seo Performance Search Engine Optimization Services To Minimize Graphics PDF
The purpose of this slide is to outline key performance indicator KPI dashboard which will assist the marketer to analyze mobile search engine optimization SEO performance. The key metrics mentioned in the slide are total sessions, search engine rankings etc. Present like a pro with KPI Metrics Dashboard To Monitor Mobile Seo Performance Search Engine Optimization Services To Minimize Graphics PDF Create beautiful presentations together with your team, using our easy-to-use presentation slides. Share your ideas in real-time and make changes on the fly by downloading our templates. So whether you are in the office, on the go, or in a remote location, you can stay in sync with your team and present your ideas with confidence. With Slidegeeks presentation got a whole lot easier. Grab these presentations today.
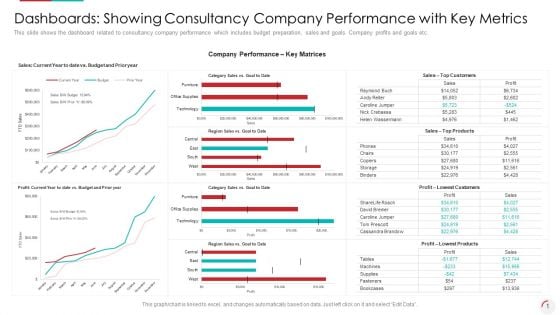
Dashboards Showing Consultancy Company Performance With Key Metrics Graphics PDF
Deliver an awe-inspiring pitch with this creative dashboards showing consultancy company performance with key metrics graphics pdf. bundle. Topics like dashboards showing consultancy company performance with key metrics can be discussed with this completely editable template. It is available for immediate download depending on the needs and requirements of the user.
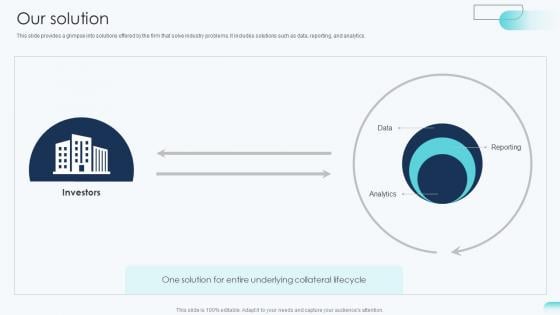
Our Solution Big Data Analytics Investor Funding Elevator Pitch Deck
This slide provides a glimpse into solutions offered by the firm that solve industry problems. It includes solutions such as data, reporting, and analytics. Make sure to capture your audiences attention in your business displays with our gratis customizable Our Solution Big Data Analytics Investor Funding Elevator Pitch Deck. These are great for business strategies, office conferences, capital raising or task suggestions. If you desire to acquire more customers for your tech business and ensure they stay satisfied, create your own sales presentation with these plain slides. This slide provides a glimpse into solutions offered by the firm that solve industry problems. It includes solutions such as data, reporting, and analytics.
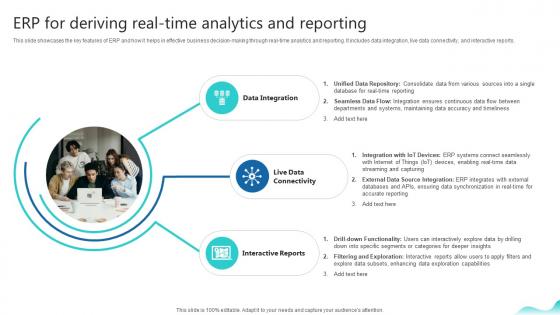
Erp For Deriving Real Time Analytics And Reporting Erp And Digital Transformation For Maximizing DT SS V
This slide showcases the key features of ERP and how it helps in effective business decision-making through real-time analytics and reporting. It includes data integration, live data connectivity, and interactive reports.Retrieve professionally designed Erp For Deriving Real Time Analytics And Reporting Erp And Digital Transformation For Maximizing DT SS V to effectively convey your message and captivate your listeners. Save time by selecting pre-made slideshows that are appropriate for various topics, from business to educational purposes. These themes come in many different styles, from creative to corporate, and all of them are easily adjustable and can be edited quickly. Access them as PowerPoint templates or as Google Slides themes. You do not have to go on a hunt for the perfect presentation because Slidegeeks got you covered from everywhere. This slide showcases the key features of ERP and how it helps in effective business decision-making through real-time analytics and reporting. It includes data integration, live data connectivity, and interactive reports.
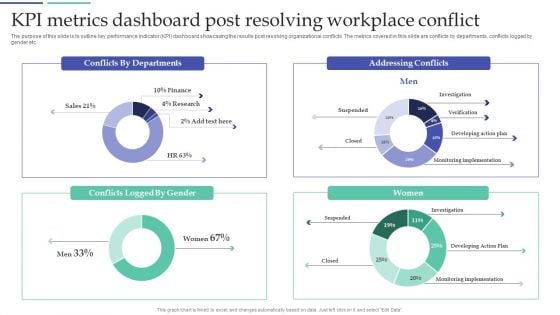
Resolving Team Disputes In Organization KPI Metrics Dashboard Post Resolving Workplace Conflict Pictures PDF
The purpose of this slide is to outline key performance indicator KPI dashboard showcasing the results post resolving organizational conflicts. The metrics covered in this slide are conflicts by departments, conflicts logged by gender etc. Get a simple yet stunning designed Resolving Team Disputes In Organization KPI Metrics Dashboard Post Resolving Workplace Conflict Pictures PDF. It is the best one to establish the tone in your meetings. It is an excellent way to make your presentations highly effective. So, download this PPT today from Slidegeeks and see the positive impacts. Our easy to edit Resolving Team Disputes In Organization KPI Metrics Dashboard Post Resolving Workplace Conflict Pictures PDF can be your go-to option for all upcoming conferences and meetings. So, what are you waiting for Grab this template today.
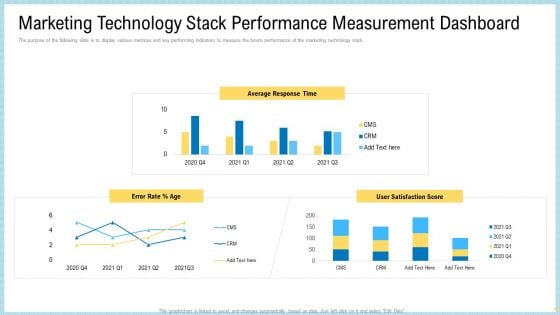
Marketing Technology Stack Performance Measurement Dashboard Demonstration PDF
The purpose of the following slide is to display various metrices and key performing indicators to measure the future performance of the marketing technology stack. Deliver and pitch your topic in the best possible manner with this marketing technology stack performance measurement dashboard demonstration pdf. Use them to share invaluable insights on average response time, user satisfaction score, error rate and impress your audience. This template can be altered and modified as per your expectations. So, grab it now.
Data Lake Implementation Centralized Repository Data Lake Reporting Dashboard Icons PDF
This slide represents the data lake reporting dashboard by covering the total number of users, total lake size, trusted zone size, conversion rate, and retention. Get a simple yet stunning designed Data Lake Implementation Centralized Repository Data Lake Reporting Dashboard Icons PDF. It is the best one to establish the tone in your meetings. It is an excellent way to make your presentations highly effective. So, download this PPT today from Slidegeeks and see the positive impacts. Our easy-to-edit Data Lake Implementation Centralized Repository Data Lake Reporting Dashboard Icons PDF can be your go-to option for all upcoming conferences and meetings. So, what are you waiting for Grab this template today.
HR Dashboard Indicating Weekly Professional Counselling Kpis Icons PDF
This slide illustrates HR career counselling dashboard. It provides information about hours of consultation, satisfaction rate, per consultant rate, popular counselors, etc. Showcasing this set of slides titled HR Dashboard Indicating Weekly Professional Counselling Kpis Icons PDF. The topics addressed in these templates are Specialization, Hours Of Consultation, Popular Counselors. All the content presented in this PPT design is completely editable. Download it and make adjustments in color, background, font etc. as per your unique business setting.
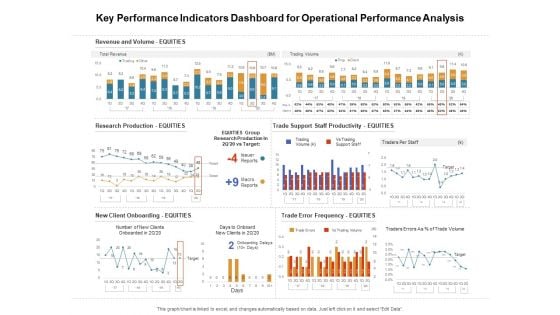
Venture Capitalist Control Board Key Performance Indicators Dashboard For Operational Performance Analysis Formats PDF
Presenting this set of slides with name venture capitalist control board key performance indicators dashboard for operational performance analysis formats pdf. The topics discussed in these slides are revenue and volume, research production, new client onboarding, trade support staff productivity, trade error frequency. This is a completely editable PowerPoint presentation and is available for immediate download. Download now and impress your audience.
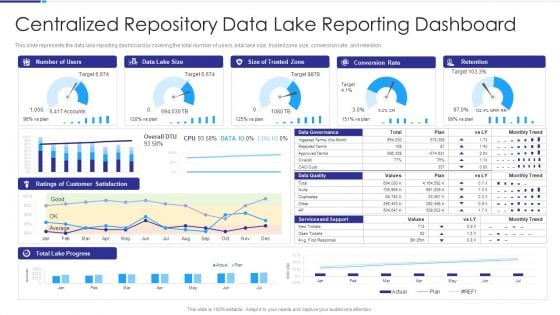
Data Lake Architecture Centralized Repository Data Lake Reporting Dashboard Introduction PDF
This slide represents the data lake reporting dashboard by covering the total number of users, total lake size, trusted zone size, conversion rate, and retention. Deliver an awe inspiring pitch with this creative Data Lake Architecture Centralized Repository Data Lake Reporting Dashboard Introduction PDF bundle. Topics like Data Lake Size, Conversion Rate, Retention, Ratings Customer Satisfaction can be discussed with this completely editable template. It is available for immediate download depending on the needs and requirements of the user.
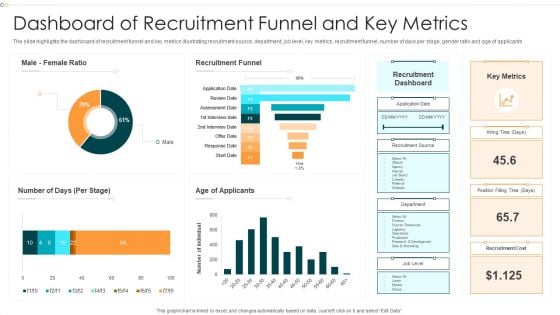
Dashboard Of Recruitment Funnel And Key Metrics Information PDF
The slide highlights the dashboard of recruitment funnel and key metrics illustrating recruitment source, department, job level, key metrics, recruitment funnel, number of days per stage, gender ratio and age of applicants.Pitch your topic with ease and precision using this Dashboard Of Recruitment Funnel And Key Metrics Information PDF This layout presents information on Recruitment Funnel, Recruitment Dashboard, Recruitment Cost It is also available for immediate download and adjustment. So, changes can be made in the color, design, graphics or any other component to create a unique layout.
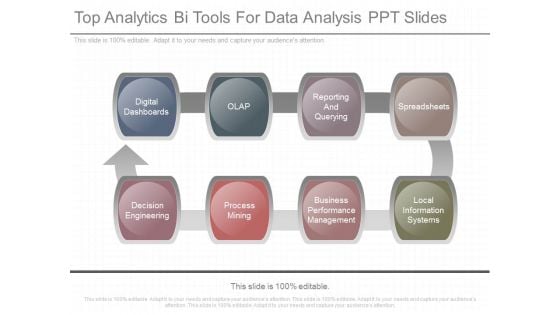
Top Analytics Bi Tools For Data Analysis Ppt Slides
This is a top analytics bi tools for data analysis ppt slides. This is a eight stage process. The stages in this process are digital dashboards, olap, reporting and querying, spreadsheets, decision engineering, process mining, business performance management, local information systems.
Lead Tracking Dashboard Icon With Key Metrics Clipart PDF
Persuade your audience using this Lead Tracking Dashboard Icon With Key Metrics Clipart PDF. This PPT design covers three stages, thus making it a great tool to use. It also caters to a variety of topics including Lead Tracking, Dashboard, Key Metrics. Download this PPT design now to present a convincing pitch that not only emphasizes the topic but also showcases your presentation skills.
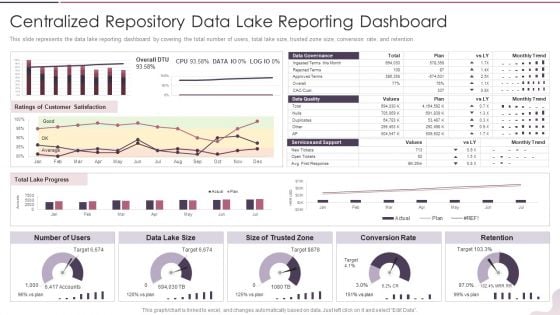
Data Lake Development With Azure Cloud Software Centralized Repository Data Lake Reporting Dashboard Demonstration PDF
This slide represents the data lake reporting dashboard by covering the total number of users, total lake size, trusted zone size, conversion rate, and retention. Deliver an awe inspiring pitch with this creative Data Lake Development With Azure Cloud Software Centralized Repository Data Lake Reporting Dashboard Demonstration PDF bundle. Topics like Conversion Rate, Services And Support can be discussed with this completely editable template. It is available for immediate download depending on the needs and requirements of the user.

Dashboard Ppt PowerPoint Presentation Introduction Ppt PowerPoint Presentation Pictures
This is a dashboard ppt powerpoint presentation introduction ppt powerpoint presentation pictures. This is a three stage process. The stages in this process are business, strategy, marketing, success, dashboard.
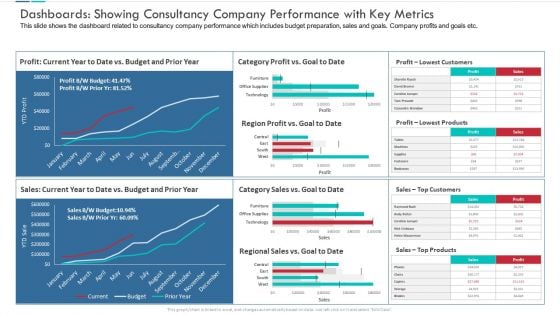
Dashboards Showing Consultancy Company Performance With Key Metrics Microsoft PDF
This slide shows the dashboard related to consultancy company performance which includes budget preparation, sales and goals. Company profits and goals etc.Presenting dashboards showing consultancy company performance with key metrics microsoft pdf to provide visual cues and insights. Share and navigate important information on four stages that need your due attention. This template can be used to pitch topics like dashboards showing consultancy company performance with key metrics. In addtion, this PPT design contains high resolution images, graphics, etc, that are easily editable and available for immediate download.
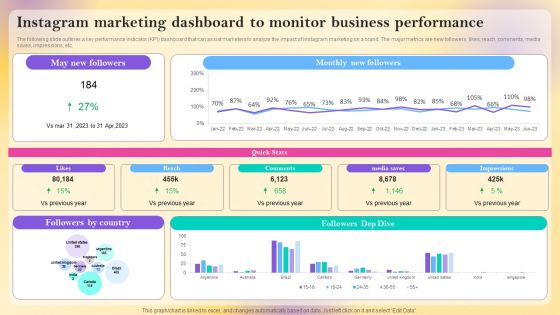
Instagram Marketing Dashboard To Monitor Business Performance Information PDF
The following slide outlines a key performance indicator KPI dashboard that can assist marketers to analyze the impact of Instagram marketing on a brand. The major metrics are new followers, likes, reach, comments, media saves, impressions, etc. This Instagram Marketing Dashboard To Monitor Business Performance Information PDF is perfect for any presentation, be it in front of clients or colleagues. It is a versatile and stylish solution for organizing your meetings. The product features a modern design for your presentation meetings. The adjustable and customizable slides provide unlimited possibilities for acing up your presentation. Slidegeeks has done all the homework before launching the product for you. So, do not wait, grab the presentation templates today
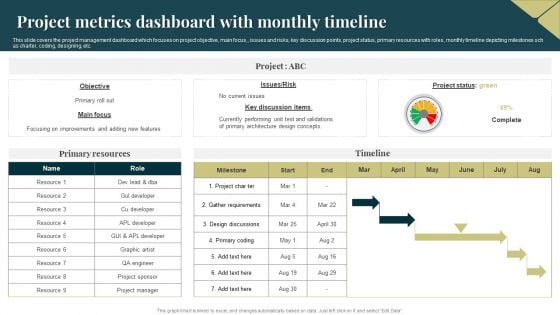
Project Metrics Dashboard With Monthly Timeline Pictures PDF
This slide covers the project management dashboard which focuses on project objective, main focus,, issues and risks, key discussion points, project status, primary resources with roles, monthly timeline depicting milestones sch as charter, coding, designing, etc. Showcasing this set of slides titled Project Metrics Dashboard With Monthly Timeline Pictures PDF. The topics addressed in these templates are Primary Resources, Risk, Requirements. All the content presented in this PPT design is completely editable. Download it and make adjustments in color, background, font etc. as per your unique business setting.

Employee Feedback Dashboard With Key Metrics Elements PDF
The following slide depicts the key insights of the feedback survey to gauge employee engagement at different department levels. It includes metrics such as engagement score, response rate, no. of comments etc.Showcasing this set of slides titled Employee Feedback Dashboard With Key Metrics Elements PDF The topics addressed in these templates are Employee Feedback Dashboard With Key Metrics All the content presented in this PPT design is completely editable. Download it and make adjustments in color, background, font etc. as per your unique business setting.
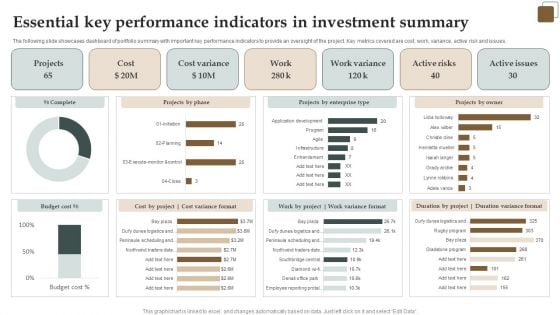
Essential Key Performance Indicators In Investment Summary Demonstration PDF
The following slide showcases dashboard of portfolio summary with important key performance indicators to provide an oversight of the project. Key metrics covered are cost, work, variance, active risk and issues. Showcasing this set of slides titled Essential Key Performance Indicators In Investment Summary Demonstration PDF. The topics addressed in these templates are Cost, Active Risks, Projects. All the content presented in this PPT design is completely editable. Download it and make adjustments in color, background, font etc. as per your unique business setting.
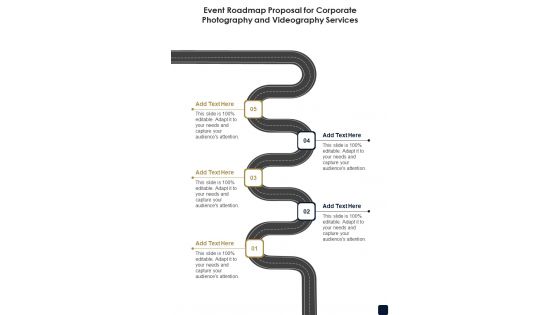
Event Roadmap Corporate Photography And Videography Services One Pager Sample Example Document
Presenting you an exemplary Event Roadmap Corporate Photography And Videography Services One Pager Sample Example Document. Our one-pager comprises all the must-have essentials of an inclusive document. You can edit it with ease, as its layout is completely editable. With such freedom, you can tweak its design and other elements to your requirements. Download this Event Roadmap Corporate Photography And Videography Services One Pager Sample Example Document brilliant piece now.

Estimating Business Overall Kpi Metrics Dashboard Highlighting Organization Revenue Clipart PDF
The following slide outlines key performance indicator KPI dashboard showcasing various financial metrics of the organization. The key metrics are gross revenue, product revenue, service revenue, gross profit, net profit etc. Formulating a presentation can take up a lot of effort and time, so the content and message should always be the primary focus. The visuals of the PowerPoint can enhance the presenters message, so our Estimating Business Overall Kpi Metrics Dashboard Highlighting Organization Revenue Clipart PDF was created to help save time. Instead of worrying about the design, the presenter can concentrate on the message while our designers work on creating the ideal templates for whatever situation is needed. Slidegeeks has experts for everything from amazing designs to valuable content, we have put everything into Estimating Business Overall Kpi Metrics Dashboard Highlighting Organization Revenue Clipart PDF.
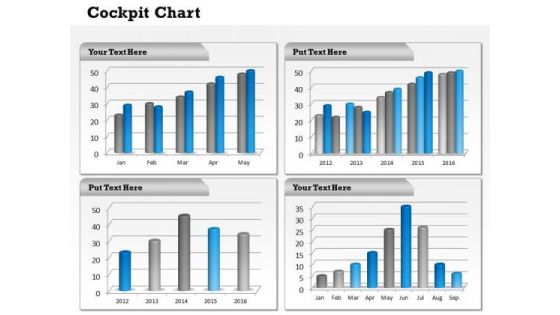
Marketing Diagram Dashboard Design For Business Sales Diagram
Your Listeners Will Never Doodle. Our Marketing Diagram Dashboard Design For Business Sales Diagram Powerpoint Templates Will Hold Their Concentration.
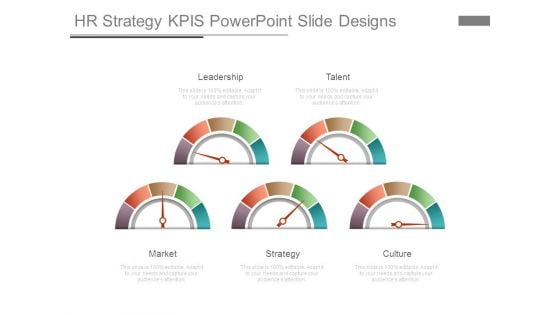
Hr Strategy Kpis Powerpoint Slide Designs
This is a hr strategy kpis powerpoint slide designs. This is a five stage process. The stages in this process are leadership, talent, market, strategy, culture.
Operational Risk Assessment And Management Plan Operational Risk Management Key Metrics Dashboard Icons PDF
This slide represents dashboard representing the key metrics of operational risk management. It includes KPIs such as operational risk by rating, by month, operational risk list etc. The Operational Risk Assessment And Management Plan Operational Risk Management Key Metrics Dashboard Icons PDF is a compilation of the most recent design trends as a series of slides. It is suitable for any subject or industry presentation, containing attractive visuals and photo spots for businesses to clearly express their messages. This template contains a variety of slides for the user to input data, such as structures to contrast two elements, bullet points, and slides for written information. Slidegeeks is prepared to create an impression.
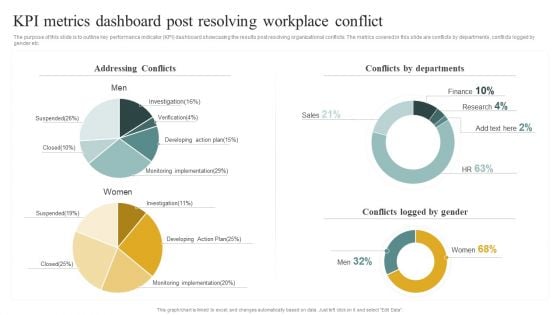
Kpi Metrics Dashboard Post Resolving Workplace Conflict Managing Organizational Conflicts To Boost Pictures PDF
The purpose of this slide is to outline key performance indicator KPI dashboard showcasing the results post resolving organizational conflicts. The metrics covered in this slide are conflicts by departments, conflicts logged by gender etc. Are you in need of a template that can accommodate all of your creative concepts This one is crafted professionally and can be altered to fit any style. Use it with Google Slides or PowerPoint. Include striking photographs, symbols, depictions, and other visuals. Fill, move around, or remove text boxes as desired. Test out color palettes and font mixtures. Edit and save your work, or work with colleagues. Download Kpi Metrics Dashboard Post Resolving Workplace Conflict Managing Organizational Conflicts To Boost Pictures PDF and observe how to make your presentation outstanding. Give an impeccable presentation to your group and make your presentation unforgettable.
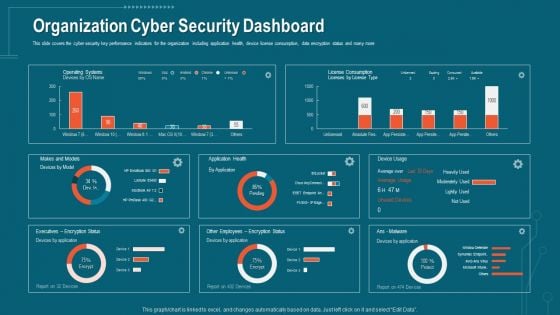
Companys Data Safety Recognition Organization Cyber Security Dashboard Pictures PDF
This slide covers the cyber security key performance indicators for the organization including application health, device license consumption, data encryption status and many more. Deliver an awe-inspiring pitch with this creative companys data safety recognition organization cyber security dashboard pictures pdf bundle. Topics like application health, operating systems, encryption status can be discussed with this completely editable template. It is available for immediate download depending on the needs and requirements of the user.
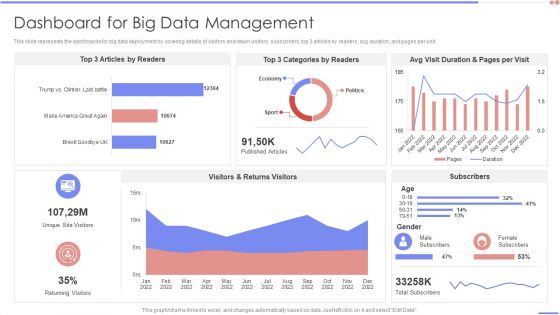
Data Analytics Management Dashboard For Big Data Management Background PDF
This slide represents the dashboards for big data deployment by covering details of visitors and return visitors, subscribers, top 3 articles by readers, avg duration, and pages per visit. Deliver and pitch your topic in the best possible manner with this Data Analytics Management Dashboard For Big Data Management Background PDF. Use them to share invaluable insights on Article Readers, Categories Readers, Duration Pages and impress your audience. This template can be altered and modified as per your expectations. So, grab it now.
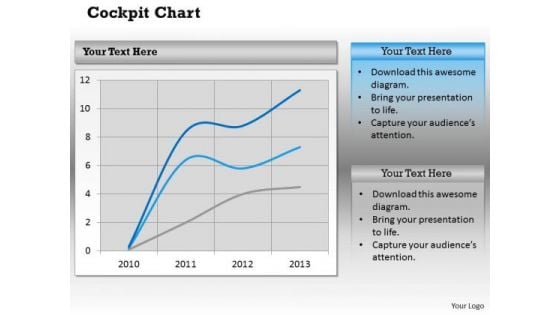
Business Framework Model Buisness Graph Dashboard Style Consulting Diagram
Get Out Of The Dock With Our Business Framework Model Business Graph Dashboard Style Consulting Diagram Powerpoint Templates. Your Mind Will Be Set Free.
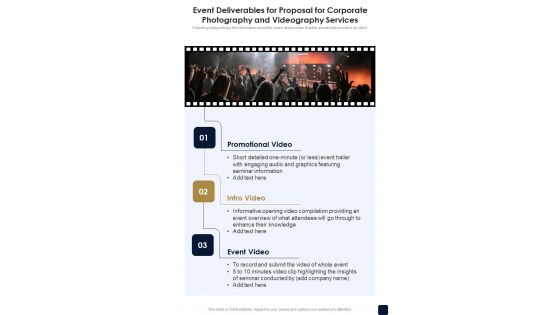
Event Deliverables For Corporate Photography And Videography Services One Pager Sample Example Document
Following slide portrays the information about the event deliverables that the sender will provide to its client. Presenting you an exemplary Event Deliverables For Corporate Photography And Videography Services One Pager Sample Example Document. Our one-pager comprises all the must-have essentials of an inclusive document. You can edit it with ease, as its layout is completely editable. With such freedom, you can tweak its design and other elements to your requirements. Download this Event Deliverables For Corporate Photography And Videography Services One Pager Sample Example Document brilliant piece now.
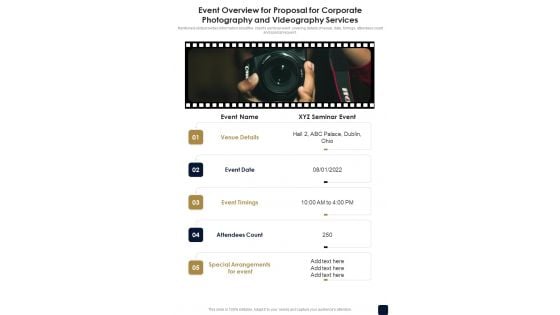
Event Overview For Corporate Photography And Videography Services One Pager Sample Example Document
Mentioned slide provides information about the clients seminar event covering details of venue, date, timings, attendees count and special request. Presenting you an exemplary Event Overview For Corporate Photography And Videography Services One Pager Sample Example Document. Our one-pager comprises all the must-have essentials of an inclusive document. You can edit it with ease, as its layout is completely editable. With such freedom, you can tweak its design and other elements to your requirements. Download this Event Overview For Corporate Photography And Videography Services One Pager Sample Example Document brilliant piece now.
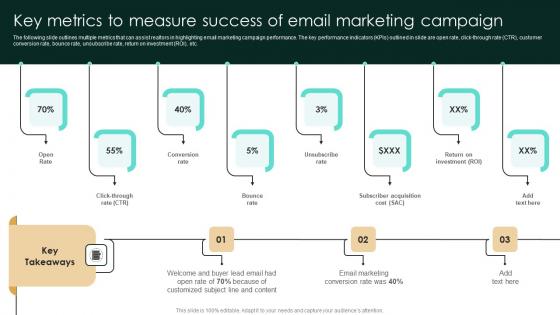
Key Metrics To Measure Success Of Email Marketing Campaign Diagrams Pdf
The following slide outlines multiple metrics that can assist realtors in highlighting email marketing campaign performance. The key performance indicators KPIs outlined in slide are open rate, click-through rate CTR, customer conversion rate, bounce rate, unsubscribe rate, return on investment ROI, etc. Retrieve professionally designed Key Metrics To Measure Success Of Email Marketing Campaign Diagrams Pdf to effectively convey your message and captivate your listeners. Save time by selecting pre-made slideshows that are appropriate for various topics, from business to educational purposes. These themes come in many different styles, from creative to corporate, and all of them are easily adjustable and can be edited quickly. Access them as PowerPoint templates or as Google Slides themes. You do not have to go on a hunt for the perfect presentation because Slidegeeks got you covered from everywhere. The following slide outlines multiple metrics that can assist realtors in highlighting email marketing campaign performance. The key performance indicators KPIs outlined in slide are open rate, click-through rate CTR, customer conversion rate, bounce rate, unsubscribe rate, return on investment ROI, etc.
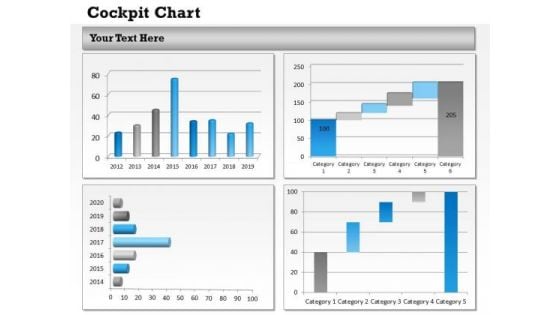
Mba Models And Frameworks Design Of Business Dashboard Consulting Diagram
Get The Domestics Right With Our MBA Models And Frameworks Design Of Business Dashboard Consulting Diagram Powerpoint Templates. Create The Base For Thoughts To Grow.
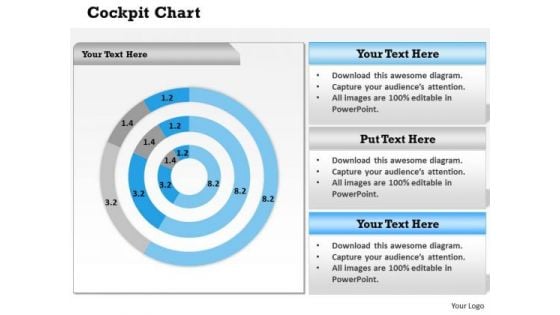
Strategic Management Design Of Business Static Dashboard Marketing Diagram
Establish Your Dominion With Our Strategic Management Design Of Business Static Dashboard Marketing Diagram Powerpoint Templates. Rule The Stage With Your Thoughts.
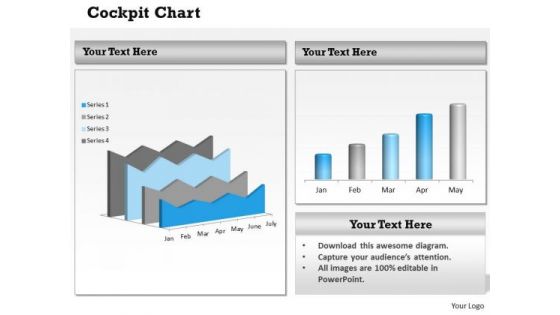
Consulting Diagram Business Dashboard Design Chart Sales Diagram
Document The Process On Our Consulting Diagram Business Dashboard Design Chart Sales Diagram Powerpoint Templates. Make A Record Of Every Detail.
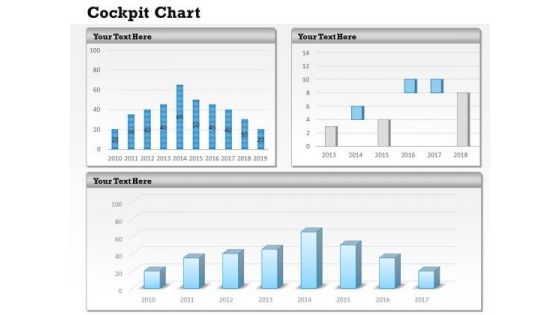
Marketing Diagram Business Intelligence Dashboard Design Sales Diagram
Our Marketing Diagram Business Intelligence Dashboard Design Sales Diagram Powerpoint Templates Team Are A Dogged Lot. They Keep At It Till They Get It Right.
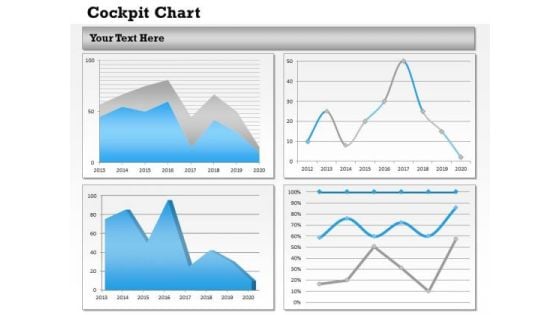
Mba Models And Frameworks Business Reports And Dashboards Consulting Diagram
Get The Doers Into Action. Activate Them With Our MBA Models And Frameworks Business Reports And Dashboards Consulting Diagram Powerpoint Templates.
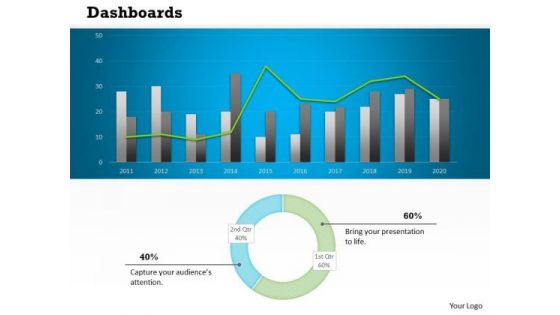
Sales Diagram Business Charts Dashboard Design Strategic Management
Put In A Dollop Of Our Sales Diagram Business Charts Dashboard Design Strategic Management Powerpoint Templates. Give Your Thoughts A Distinctive Flavor.
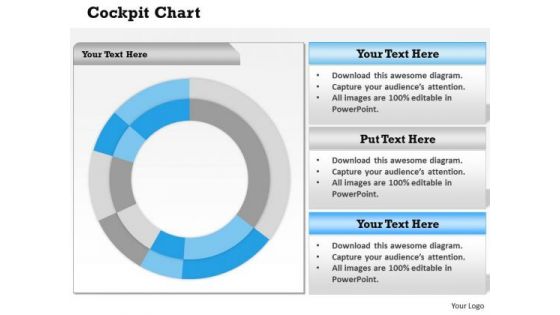
Sales Diagram Business Reports In Dashboard Style Strategic Management
Get The Domestics Right With Our Sales Diagram Business Reports In Dashboard Style Strategic Management Powerpoint Templates. Create The Base For Thoughts To Grow.
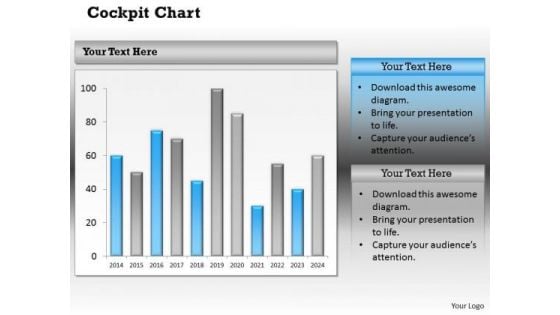
Business Cycle Diagram Dashboard For Executive Reports Strategy Diagram
Document Your Views On Our Business Cycle Diagram Dashboard For Executive Reports Strategy Diagram Powerpoint Templates. They Will Create A Strong Impression.
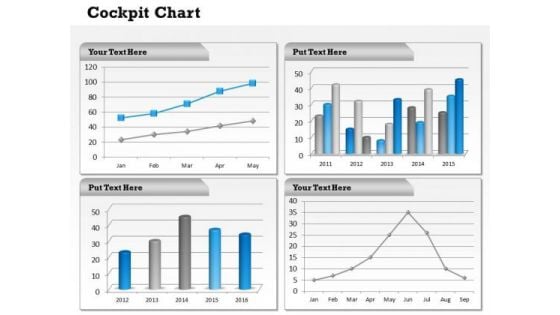
Consulting Diagram Dashboard Layout For Business Reporting Sales Diagram
Dominate Proceedings With Your Ideas. Our Consulting Diagram Dashboard Layout For Business Reporting Sales Diagram Powerpoint Templates Will Empower Your Thoughts.
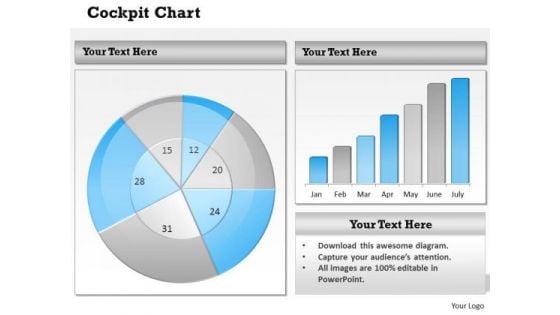
Mba Models And Frameworks Dashboard Layout Business Design Sales Diagram
Open Up Doors That Lead To Success. Our MBA Models And Frameworks Dashboard Layout Business Design Sales Diagram Powerpoint Templates Provide The Handles.
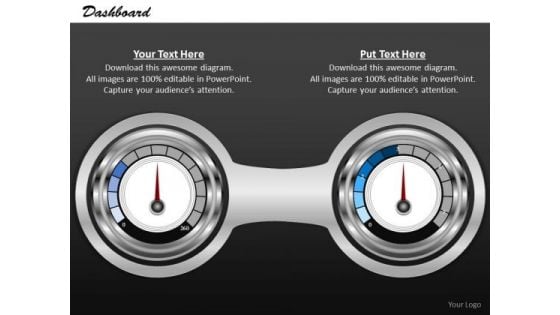
Mba Models And Frameworks Dashboard To Compare Information Business Diagram
Our MBA Models And Frameworks Dashboard To compare Information Business Diagram Powerpoint Templates Abhor Doodling. They Never Let The Interest Flag.
Dashboards Key Metrics Of Performance Assessment Icons PDF
Deliver an awe-inspiring pitch with this creative dashboards key metrics of performance assessment icons pdf bundle. Topics like availability, performance, maintenance, delivery adherence, customer complaints can be discussed with this completely editable template. It is available for immediate download depending on the needs and requirements of the user.
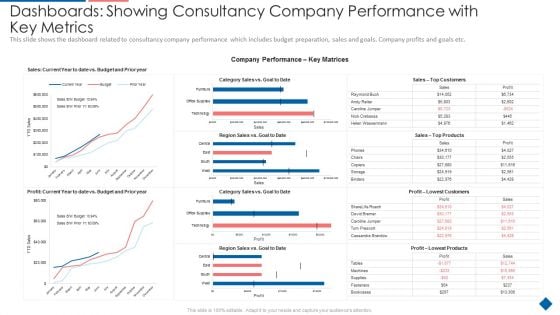
Dashboards Showing Consultancy Company Performance With Key Metrics Mockup PDF
Deliver and pitch your topic in the best possible manner with this dashboards showing consultancy company performance with key metrics mockup pdf. Use them to share invaluable insights on customers, top products, lowest customers, and impress your audience. This template can be altered and modified as per your expectations. So, grab it now.
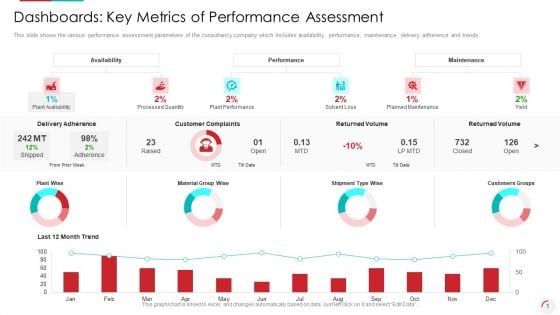
Dashboards Key Metrics Of Performance Assessment Summary PDF
Deliver and pitch your topic in the best possible manner with this dashboards key metrics of performance assessment summary pdf. Use them to share invaluable insights on delivery adherence, customer complaints, returned volume and impress your audience. This template can be altered and modified as per your expectations. So, grab it now.
Transformation KPI Dashboard With Key Metrics And Status Icons PDF
Pitch your topic with ease and precision using this Transformation KPI Dashboard With Key Metrics And Status Icons PDF. This layout presents information on Measure, System Implemented, Innovation. It is also available for immediate download and adjustment. So, changes can be made in the color, design, graphics or any other component to create a unique layout.
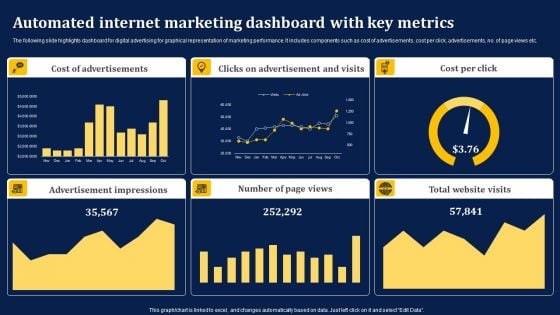
Automated Internet Marketing Dashboard With Key Metrics Information PDF
The following slide highlights dashboard for digital advertising for graphical representation of marketing performance. It includes components such as cost of advertisements, cost per click, advertisements, no. of page views etc. Showcasing this set of slides titled Automated Internet Marketing Dashboard With Key Metrics Information PDF. The topics addressed in these templates are Cost Advertisements, Clicks Advertisement, Cost Per Click. All the content presented in this PPT design is completely editable. Download it and make adjustments in color, background, font etc. as per your unique business setting.
Banking Operations Performance Tracking Dashboard Incorporating Banking Operational Growth
The purpose of the mentioned slide is to showcase a performance tracking dashboard of banking operations. It includes metrics such as accounts opened and closed, total deposits, referrals by product, etc. Want to ace your presentation in front of a live audience Our Banking Operations Performance Tracking Dashboard Incorporating Banking Operational Growth can help you do that by engaging all the users towards you. Slidegeeks experts have put their efforts and expertise into creating these impeccable powerpoint presentations so that you can communicate your ideas clearly. Moreover, all the templates are customizable, and easy-to-edit and downloadable. Use these for both personal and commercial use. The purpose of the mentioned slide is to showcase a performance tracking dashboard of banking operations. It includes metrics such as accounts opened and closed, total deposits, referrals by product, etc.
Marketers Guide To Data Analysis Optimization KPI Dashboard For Tracking SEO Analytics Template PDF
This slide covers the KPI dashboard for analyzing SEO metrics such as authority score, organic traffic, organic keywords, paid keywords, ref. Domains, site audit, link-building tool, organic traffic, on-page SEO checker, backlink audit, etc. This Marketers Guide To Data Analysis Optimization KPI Dashboard For Tracking SEO Analytics Template PDF from Slidegeeks makes it easy to present information on your topic with precision. It provides customization options, so you can make changes to the colors, design, graphics, or any other component to create a unique layout. It is also available for immediate download, so you can begin using it right away. Slidegeeks has done good research to ensure that you have everything you need to make your presentation stand out. Make a name out there for a brilliant performance.
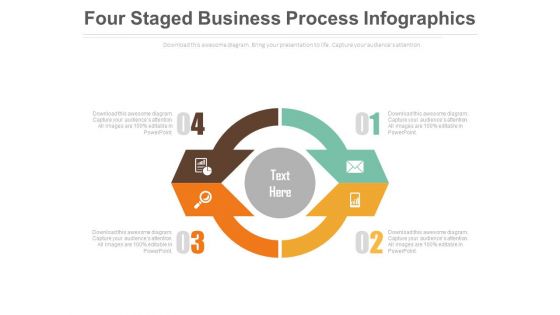
Four Steps Circular Infographic Powerpoint Slides
This innovative, stunningly beautiful dashboard has been designed for data visualization. It contains circular infographic design. This PowerPoint template helps to display your information in a useful, simple and orderly way.
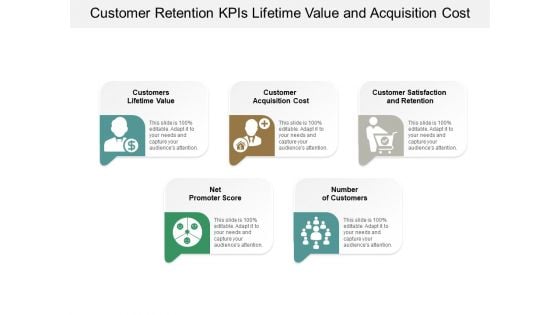
Customer Retention Kpis Lifetime Value And Acquisition Cost Ppt Powerpoint Presentation Model Samples
This is a customer retention kpis lifetime value and acquisition cost ppt powerpoint presentation model samples. This is a five stage process. The stages in this process are dashboard, kpi, metrics.
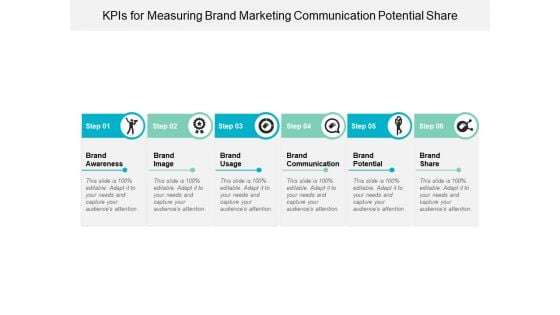
Kpis For Measuring Brand Marketing Communication Potential Share Ppt Powerpoint Presentation Layouts Infographics
This is a kpis for measuring brand marketing communication potential share ppt powerpoint presentation layouts infographics. This is a six stage process. The stages in this process are dashboard, kpi, metrics.
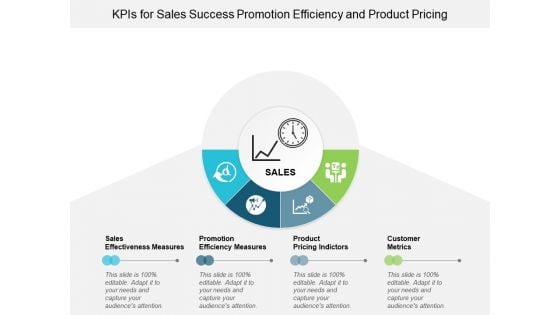
Kpis For Sales Success Promotion Efficiency And Product Pricing Ppt Powerpoint Presentation Infographics Background Images
This is a kpis for sales success promotion efficiency and product pricing ppt powerpoint presentation infographics background images. This is a four stage process. The stages in this process are dashboard, kpi, metrics.
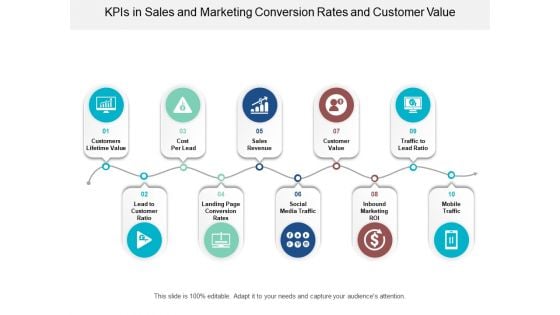
Kpis In Sales And Marketing Conversion Rates And Customer Value Ppt Powerpoint Presentation File Information
This is a kpis in sales and marketing conversion rates and customer value ppt powerpoint presentation file information. This is a ten stage process. The stages in this process are dashboard, kpi, metrics.
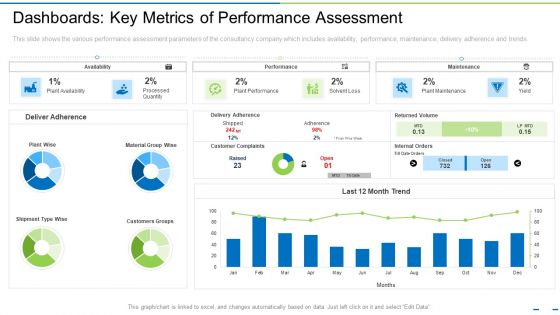
Dashboards Key Metrics Of Performance Assessment Ppt Model Skills PDF
This slide shows the various performance assessment parameters of the consultancy company which includes availability, performance, maintenance, delivery adherence and trends. Deliver and pitch your topic in the best possible manner with this dashboards key metrics of performance assessment ppt model skills pdf. Use them to share invaluable insights on customers groups, performance, customer complaints and impress your audience. This template can be altered and modified as per your expectations. So, grab it now.
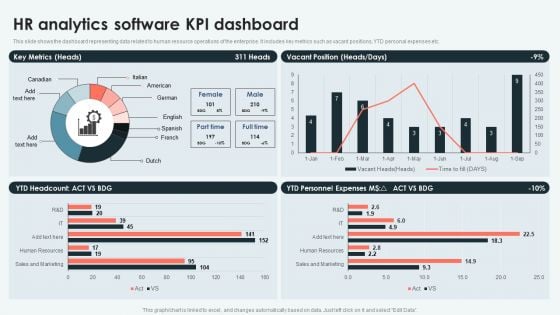
Analyzing And Deploying HR Analytics Software Kpi Dashboard Information PDF
This slide shows the dashboard representing data related to human resource operations of the enterprise. It includes key metrics such as vacant positions, YTD personal expenses etc. There are so many reasons you need a Analyzing And Deploying HR Analytics Software Kpi Dashboard Information PDF. The first reason is you cant spend time making everything from scratch, Thus, Slidegeeks has made presentation templates for you too. You can easily download these templates from our website easily.
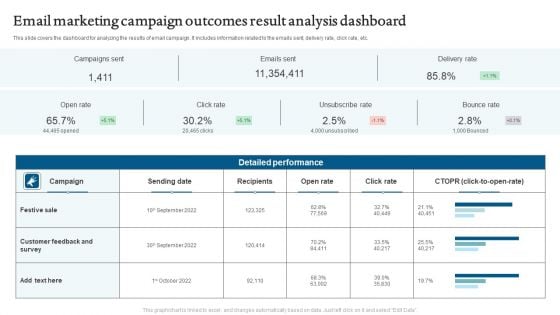
Email Marketing Campaign Outcomes Result Analysis Dashboard Mockup PDF
This slide covers the dashboard for analyzing the email campaign metrics. It includes information related to engagement a key performance indicator KPIs. Pitch your topic with ease and precision using this Email Marketing Campaign Outcomes Result Analysis Dashboard Mockup PDF. This layout presents information on Campaigns Sent, Emails Sent, Delivery Rate. It is also available for immediate download and adjustment. So, changes can be made in the color, design, graphics or any other component to create a unique layout.
Statistics Dashboard Vector Icon Ppt PowerPoint Presentation Pictures Visual Aids
Presenting this set of slides with name statistics dashboard vector icon ppt powerpoint presentation pictures visual aids. This is a one stage process. The stages in this process are data visualization icon, research analysis, business focus. This is a completely editable PowerPoint presentation and is available for immediate download. Download now and impress your audience.
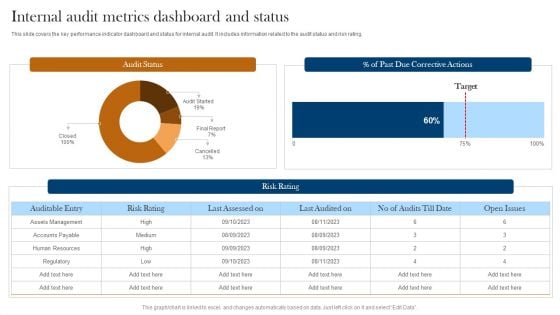
Internal Audit Metrics Dashboard And Status Ppt Layouts Graphic Images PDF
This slide covers the key performance indicator dashboard and status for internal audit. It includes information related to the audit status and risk rating. Pitch your topic with ease and precision using this Internal Audit Metrics Dashboard And Status Ppt Layouts Graphic Images PDF. This layout presents information on Audit Status, Risk Rating, Auditable Entry. It is also available for immediate download and adjustment. So, changes can be made in the color, design, graphics or any other component to create a unique layout.


 Continue with Email

 Home
Home


