Snapshot
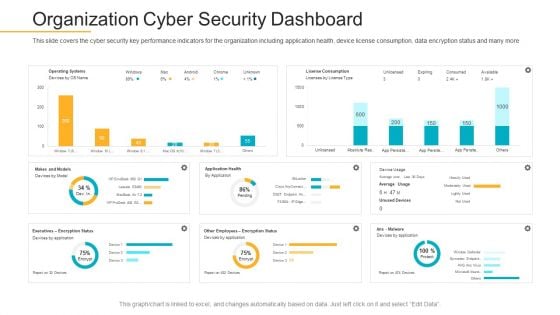
Data Breach Prevention Recognition Organization Cyber Security Dashboard Demonstration PDF
This slide covers the cyber security key performance indicators for the organization including application health, device license consumption, data encryption status and many more. Deliver and pitch your topic in the best possible manner with this data breach prevention recognition organization cyber security dashboard demonstration pdf. Use them to share invaluable insights on cyber security, key performance, organization and impress your audience. This template can be altered and modified as per your expectations. So, grab it now.
Dashboard For Tracking Social Media Kpis Mockup PDF
This slide shows dashboard for tracking social media key performance indicators KPIs. It provides details about average social engagement, reactions, comments, shares, clicks, thumbnail, platform, post message, etc. Deliver and pitch your topic in the best possible manner with this Dashboard For Tracking Social Media Kpis Mockup PDF. Use them to share invaluable insights on Social Engagements, Dashboard, Tracking Social Media KPIS and impress your audience. This template can be altered and modified as per your expectations. So, grab it now.
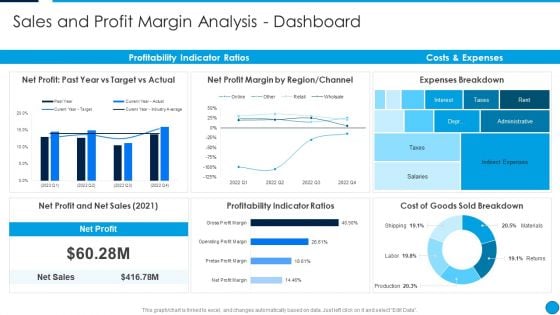
Summary Financial Sales And Profit Margin Analysis Dashboard Pictures PDF
This graph or chart is linked to excel, and changes automatically based on data. Just left click on it and select Edit Data. Deliver an awe inspiring pitch with this creative Summary Financial Sales And Profit Margin Analysis Dashboard Pictures PDF bundle. Topics like Net Profit, Past Year Vs Target Vs Actual, Net Profit Margin By Region, Channel, Expenses Breakdown, Costs And Expenses, Profitability Indicator Ratios can be discussed with this completely editable template. It is available for immediate download depending on the needs and requirements of the user.
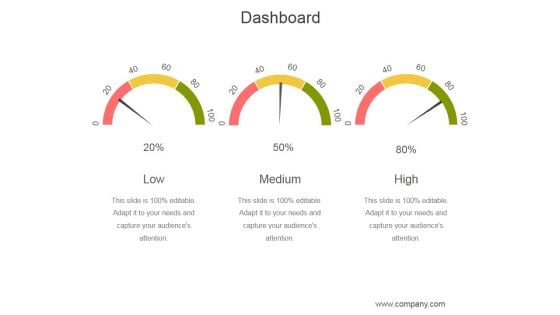
Dashboard Ppt PowerPoint Presentation Examples
This is a dashboard ppt powerpoint presentation examples. This is a three stage process. The stages in this process are low, medium, high.
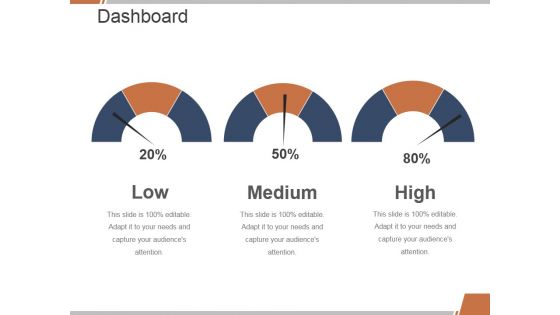
Dashboard Ppt PowerPoint Presentation Portfolio Graphic Tips
This is a dashboard ppt powerpoint presentation portfolio graphic tips. This is a three stage process. The stages in this process are dashboard, management, planning, strategy, marketing.
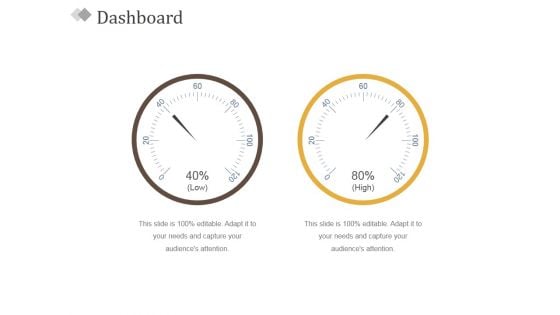
Dashboard Ppt PowerPoint Presentation Diagram Ppt
This is a dashboard ppt powerpoint presentation diagram ppt. This is a two stage process. The stages in this process are low, high, dashboard, technology, process.
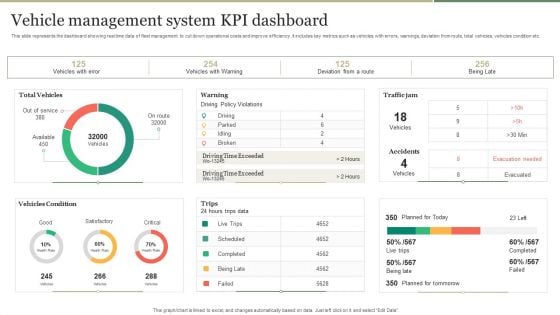
Vehicle Management System KPI Dashboard Introduction PDF
This slide represents the dashboard showing real time data of fleet management to cut down operational costs and improve efficiency. It includes key metrics such as vehicles with errors, warnings, deviation from route, total vehicles, vehicles condition etc. Pitch your topic with ease and precision using this Vehicle Management System KPI Dashboard Introduction PDF. This layout presents information on Vehicle Management System, KPI Dashboard. It is also available for immediate download and adjustment. So, changes can be made in the color, design, graphics or any other component to create a unique layout.
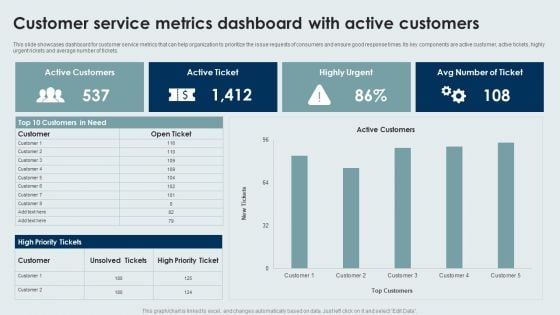
Customer Service Metrics Dashboard With Active Customers Ideas PDF
This slide showcases dashboard for customer service metrics that can help organization to prioritize the issue requests of consumers and ensure good response times. Its key components are active customer, active tickets, highly urgent rickets and average number of tickets. Showcasing this set of slides titled Customer Service Metrics Dashboard With Active Customers Ideas PDF. The topics addressed in these templates are Customer Service, Metrics Dashboard, Active Customers. All the content presented in this PPT design is completely editable. Download it and make adjustments in color, background, font etc. as per your unique business setting.
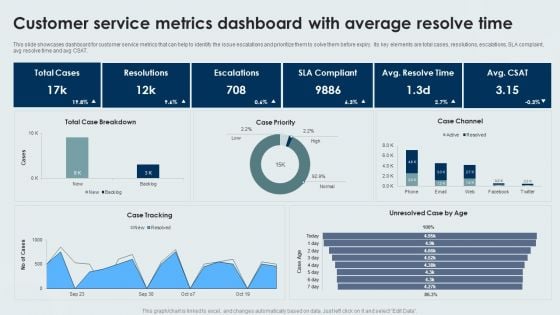
Customer Service Metrics Dashboard With Average Resolve Time Sample PDF
This slide showcases dashboard for customer service metrics that can help to identify the issue escalations and prioritize them to solve them before expiry. Its key elements are total cases, resolutions, escalations, SLA complaint, avg resolve time and avg CSAT. Showcasing this set of slides titled Customer Service Metrics Dashboard With Average Resolve Time Sample PDF. The topics addressed in these templates are Customer Service, Metrics Dashboard, Average Resolve Time. All the content presented in this PPT design is completely editable. Download it and make adjustments in color, background, font etc. as per your unique business setting.
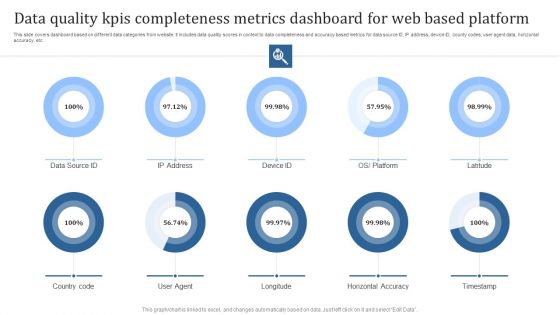
Data Quality Kpis Completeness Metrics Dashboard For Web Based Platform Graphics PDF
This slide covers dashboard based on different data categories from website. It includes data quality scores in context to data completeness and accuracy based metrics for data source ID, IP address, device ID, county codes, user agent data, horizontal accuracy, etc. Pitch your topic with ease and precision using this Data Quality Kpis Completeness Metrics Dashboard For Web Based Platform Graphics PDF. This layout presents information on Country Code, User Agent, Longitude. It is also available for immediate download and adjustment. So, changes can be made in the color, design, graphics or any other component to create a unique layout.
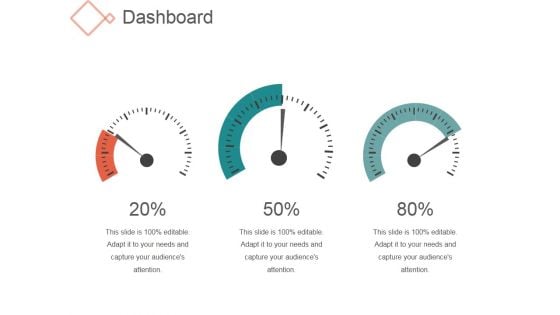
Dashboard Ppt PowerPoint Presentation Ideas Diagrams
This is a dashboard ppt powerpoint presentation ideas diagrams. This is a three stage process. The stages in this process are dashboard, finance, measure, marketing.
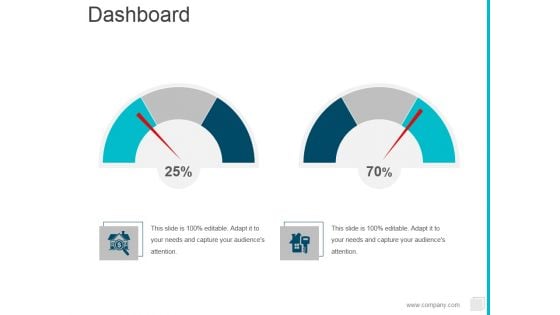
Dashboard Ppt PowerPoint Presentation Gallery Example Topics
This is a dashboard ppt powerpoint presentation gallery example topics. This is a two stage process. The stages in this process are dashboard, measure, marketing.
Dashboard Ppt PowerPoint Presentation Icon Topics
This is a dashboard ppt powerpoint presentation icon topics. This is a three stage process. The stages in this process are low, medium, high, dashboard, measurement.
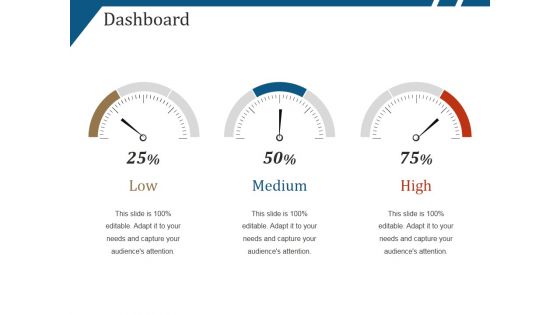
Dashboard Ppt PowerPoint Presentation Professional Backgrounds
This is a dashboard ppt powerpoint presentation professional backgrounds. This is a three stage process. The stages in this process are low, medium, high, dashboard, measurement.
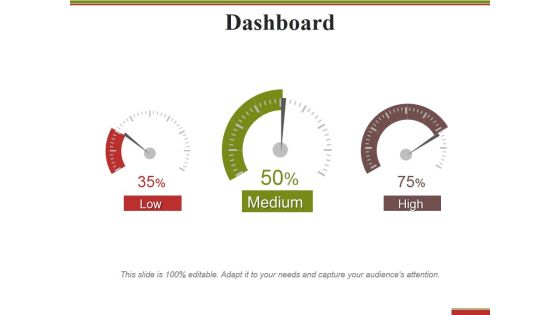
Dashboard Ppt PowerPoint Presentation Infographics Outline
This is a dashboard ppt powerpoint presentation infographics outline. This is a three stage process. The stages in this process are low, medium, high, dashboard, measurement.

Dashboard Ppt PowerPoint Presentation Gallery Images
This is a dashboard ppt powerpoint presentation gallery images. This is a three stage process. The stages in this process are low, medium, high, dashboard, measurement.
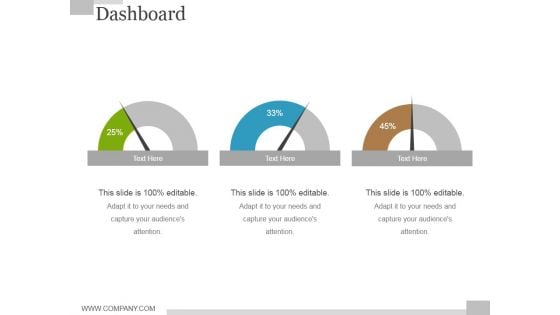
Dashboard Ppt PowerPoint Presentation Model Gallery
This is a dashboard ppt powerpoint presentation model gallery. This is a three stage process. The stages in this process are low, medium, high, dashboard, measurement.
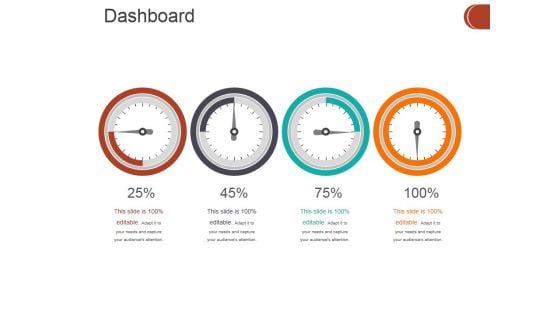
Dashboard Ppt PowerPoint Presentation Gallery Graphics Tutorials
This is a dashboard ppt powerpoint presentation gallery graphics tutorials. This is a four stage process. The stages in this process are dashboard, marketing, low, high, medium.
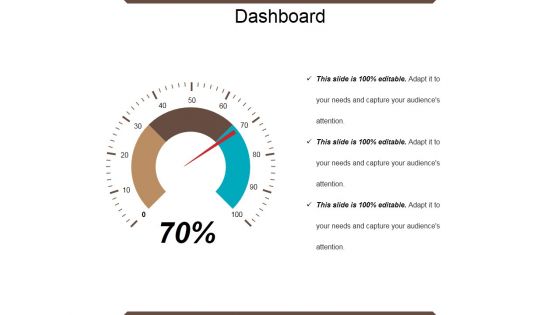
Dashboard Ppt PowerPoint Presentation Professional Introduction
This is a dashboard ppt powerpoint presentation professional introduction. This is a three stage process. The stages in this process are low, medium, high, dashboard, measurement.
Dashboard Ppt PowerPoint Presentation Professional Outline
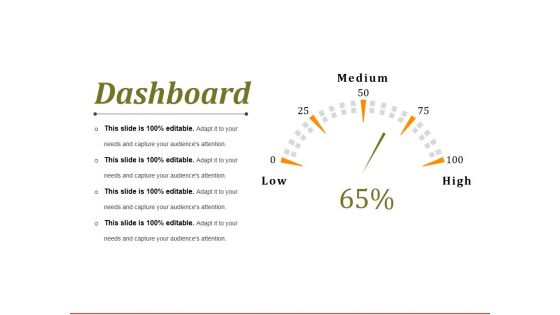
This is a dashboard ppt powerpoint presentation professional outline. This is a five stage process. The stages in this process are low, medium, high, dashboard, measurement.
Dashboard Ppt PowerPoint Presentation Professional Infographics
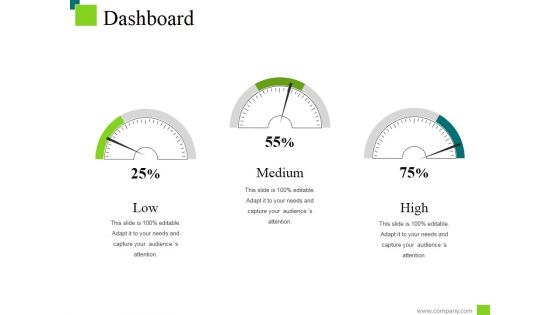
This is a dashboard ppt powerpoint presentation professional infographics. This is a three stage process. The stages in this process are low, medium, high, dashboard, measurement.
Dashboard Ppt PowerPoint Presentation Infographic Template Outfit
This is a dashboard ppt powerpoint presentation infographic template outfit. This is a three stage process. The stages in this process are medium, low, high, dashboard.
Dashboard Ppt PowerPoint Presentation Summary Model
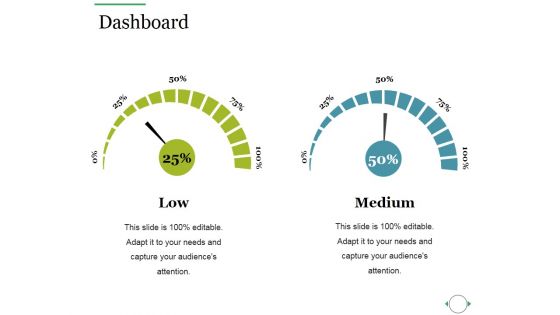
This is a dashboard ppt powerpoint presentation summary model. This is a two stage process. The stages in this process are dashboard, low, medium.
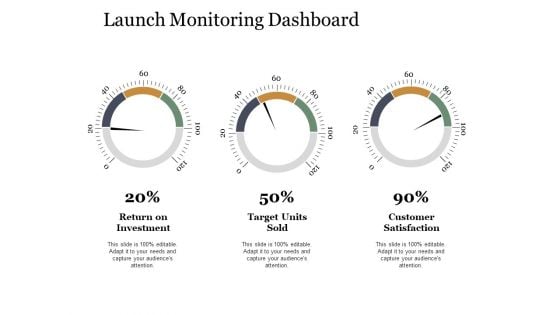
Launch Monitoring Dashboard Ppt PowerPoint Presentation Templates
This is a launch monitoring dashboard ppt powerpoint presentation templates. This is a three stage process. The stages in this process are Low, Medium, High, Dashboard, Measurement.
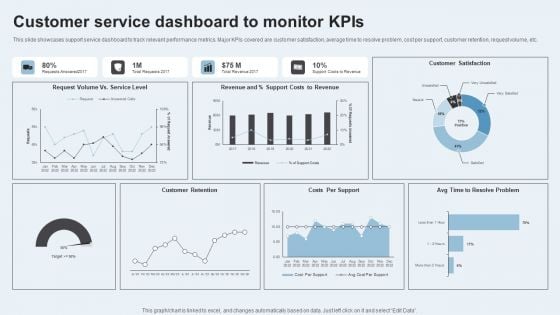
Action Plan To Enhance Client Service Customer Service Dashboard To Monitor Kpis Clipart PDF
This slide showcases support service dashboard to track relevant performance metrics. Major KPIs covered are customer satisfaction, average time to resolve problem, cost per support, customer retention, request volume, etc. Make sure to capture your audiences attention in your business displays with our gratis customizable Action Plan To Enhance Client Service Customer Service Dashboard To Monitor Kpis Clipart PDF. These are great for business strategies, office conferences, capital raising or task suggestions. If you desire to acquire more customers for your tech business and ensure they stay satisfied, create your own sales presentation with these plain slides.
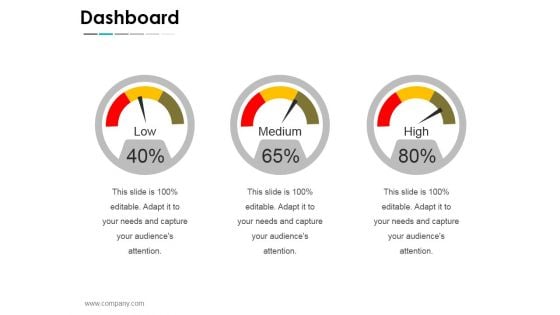
Dashboard Ppt PowerPoint Presentation Layouts Graphics Pictures
This is a dashboard ppt powerpoint presentation layouts graphics pictures. This is a three stage process. The stages in this process are business, strategy, analysis, planning, dashboard.
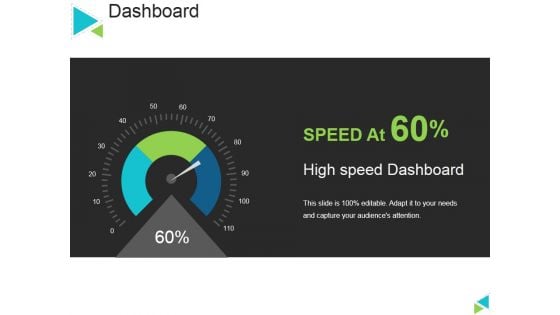
Dashboard Ppt PowerPoint Presentation Model Graphics Template
This is a dashboard ppt powerpoint presentation model graphics template. This is a one stage process. The stages in this process are high speed dashboard, speed, technology, business, marketing.

Performance Dashboard Ppt PowerPoint Presentation Summary
This is a performance dashboard ppt powerpoint presentation summary. This is a one stage process. The stages in this process are business, strategy, marketing, analysis, success, growth strategy, dashboard.
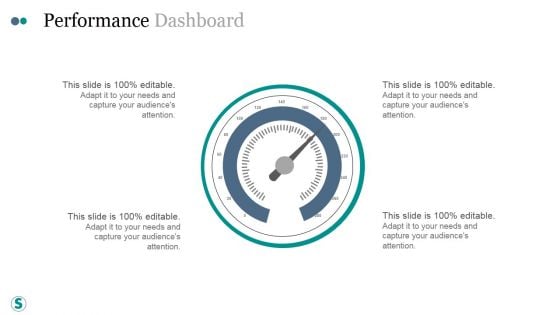
Performance Dashboard Template Ppt PowerPoint Presentation Topics
This is a performance dashboard template ppt powerpoint presentation topics. This is a four stage process. The stages in this process are business, strategy, marketing, analysis, success, growth strategy, dashboard.
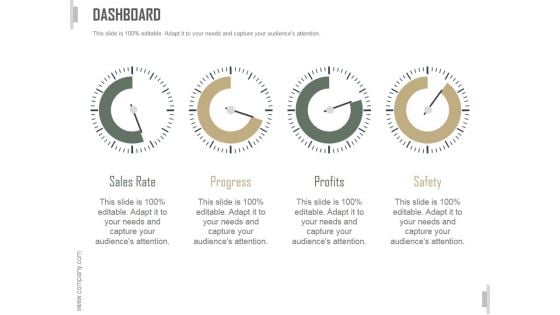
Dashboard Ppt PowerPoint Presentation Files
This is a dashboard ppt powerpoint presentation files. This is a four stage process. The stages in this process are sales rate, progress, profits, safety.
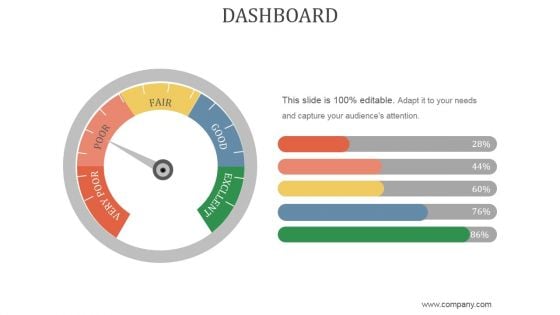
Dashboard Ppt PowerPoint Presentation Shapes
This is a dashboard ppt powerpoint presentation shapes. This is a five stage process. The stages in this process are very poor, poor, fair, good, excllent.
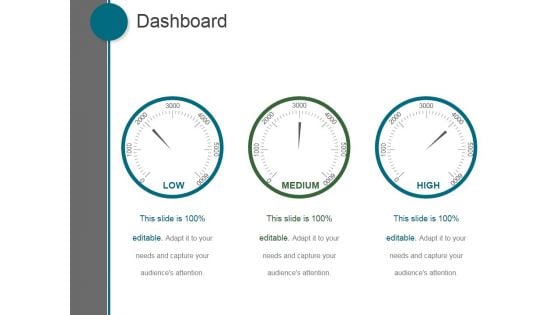
Dashboard Ppt PowerPoint Presentation Gallery
This is a dashboard ppt powerpoint presentation gallery. This is a three stage process. The stages in this process are low, medium, high.
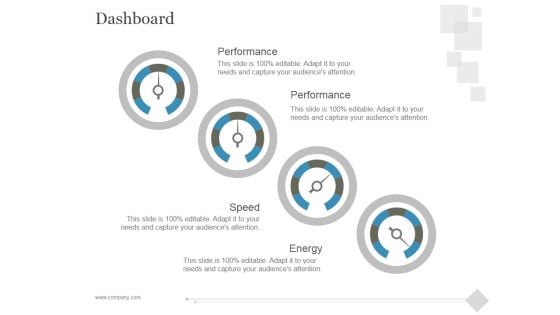
Dashboard Ppt PowerPoint Presentation Diagrams
This is a dashboard ppt powerpoint presentation diagrams. This is a four stage process. The stages in this process are performance, energy, speed.
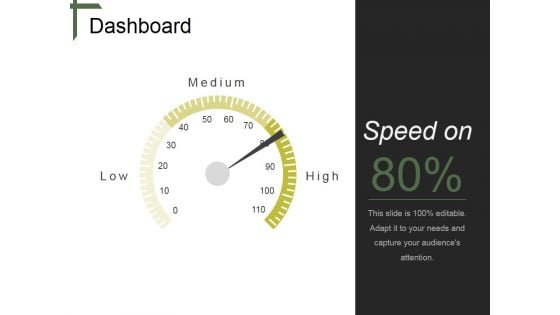
Dashboard Ppt PowerPoint Presentation Outline
This is a dashboard ppt powerpoint presentation outline. This is a one stage process. The stages in this process are medium, low, high.
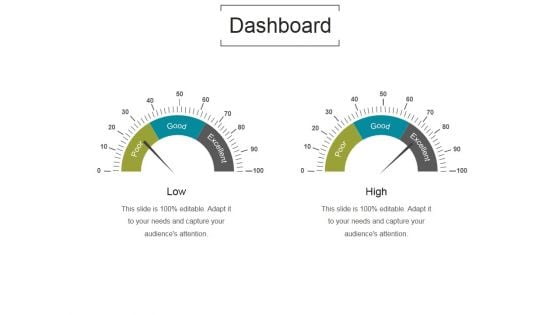
Dashboard Ppt PowerPoint Presentation Themes
This is a dashboard ppt powerpoint presentation themes. This is a two stage process. The stages in this process are low, high, poor, good, excellent.
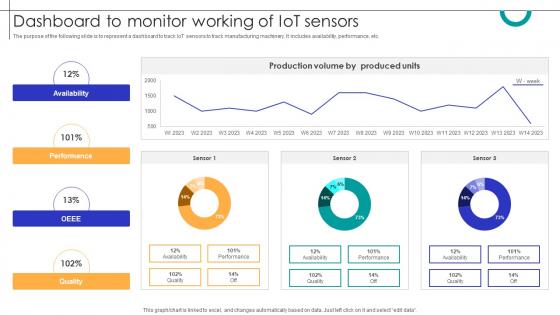
Dashboard To Monitor Working Of IOT Sensors Streamlining Production Ppt Powerpoint
The purpose of the following slide is to represent a dashboard to track IoT sensors to track manufacturing machinery. It includes availability, performance, etc. Coming up with a presentation necessitates that the majority of the effort goes into the content and the message you intend to convey. The visuals of a PowerPoint presentation can only be effective if it supplements and supports the story that is being told. Keeping this in mind our experts created Dashboard To Monitor Working Of IOT Sensors Streamlining Production Ppt Powerpoint to reduce the time that goes into designing the presentation. This way, you can concentrate on the message while our designers take care of providing you with the right template for the situation. The purpose of the following slide is to represent a dashboard to track IoT sensors to track manufacturing machinery. It includes availability, performance, etc.
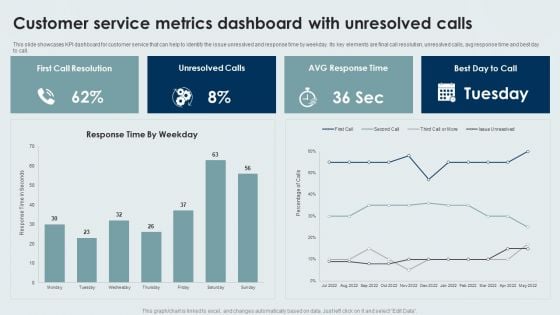
Customer Service Metrics Dashboard With Unresolved Calls Designs PDF
This slide showcases KPI dashboard for customer service that can help to identify the issue unresolved and response time by weekday. Its key elements are final call resolution, unresolved calls, avg response time and best day to call. Showcasing this set of slides titled Customer Service Metrics Dashboard With Unresolved Calls Designs PDF. The topics addressed in these templates are Customer Service, Metrics Dashboard, Unresolved Calls. All the content presented in this PPT design is completely editable. Download it and make adjustments in color, background, font etc. as per your unique business setting.

Dashboard Ppt PowerPoint Presentation Infographic Template Example 2015
This is a dashboard ppt powerpoint presentation infographic template example 2015. This is a two stage process. The stages in this process are dashboard, business, marketing, technology, process.
Email Marketing Campaign Kpis Tracking Dashboard Graphics PDF
This slide shows key performance indicators KPI dashboard for measuring effectiveness of email campaigns. It provides information about sent, delivered, opens, clicks, unsubscribed, bounces, complaints, etc. Pitch your topic with ease and precision using this Email Marketing Campaign Kpis Tracking Dashboard Graphics PDF. This layout presents information on Email Marketing Campaign, Tracking Dashboard. It is also available for immediate download and adjustment. So, changes can be made in the color, design, graphics or any other component to create a unique layout.
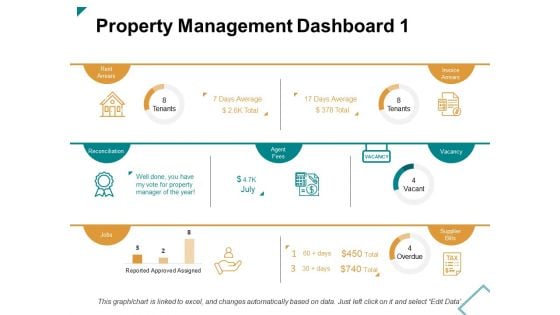
Property Management Dashboard Jobs Ppt PowerPoint Presentation Layouts Brochure
This is a property management dashboard jobs ppt powerpoint presentation layouts brochure. This is a three stage process. The stages in this process are dashboard, management, marketing, business.

Property Management Dashboard Ppt PowerPoint Presentation Gallery Infographics
This is a property management dashboard ppt powerpoint presentation gallery infographics. This is a two stage process. The stages in this process are dashboard, management, marketing, business.
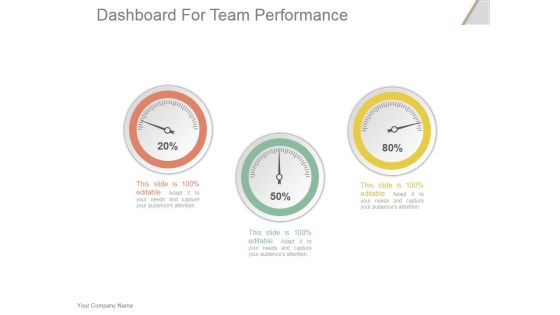
Dashboard For Team Performance Ppt PowerPoint Presentation Summary
This is a dashboard for team performance ppt powerpoint presentation summary. This is a three stage process. The stages in this process are dashboard, business, finance, strategy, marketing.
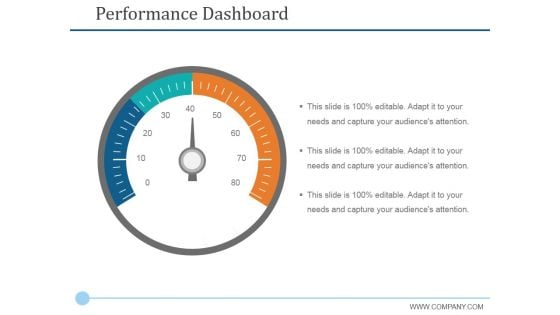
Performance Dashboard Template 1 Ppt PowerPoint Presentation Portfolio Format
This is a performance dashboard template 1 ppt powerpoint presentation portfolio format. This is a three stage process. The stages in this process are dashboard, measure, marketing, business.
Dashboard High Speed Ppt PowerPoint Presentation Icon Background Designs
This is a dashboard high speed ppt powerpoint presentation information. This is a one stage process. The stages in this process are dashboard, business, marketing, management, planning.

Property Management Dashboard Ppt PowerPoint Presentation Outline Infographics
This is a property management dashboard ppt powerpoint presentation outline infographics. This is a five stage process. The stages in this process are dashboard, management, marketing, business.
Lead Tracking Metrics Dashboard With User Responses Diagrams PDF
This slide showcases dashboard for lead conversion metrics that can help organization to filter out total leads interested from the leads who have responded to the phone calls by organization. It also showcases key metrics such as leads busiest hours, leads busiest days, phone number types and lead types. Showcasing this set of slides titled Lead Tracking Metrics Dashboard With User Responses Diagrams PDF. The topics addressed in these templates are Busiest Hours Leads, Conversion Metrics, Lead Types. All the content presented in this PPT design is completely editable. Download it and make adjustments in color, background, font etc. as per your unique business setting.
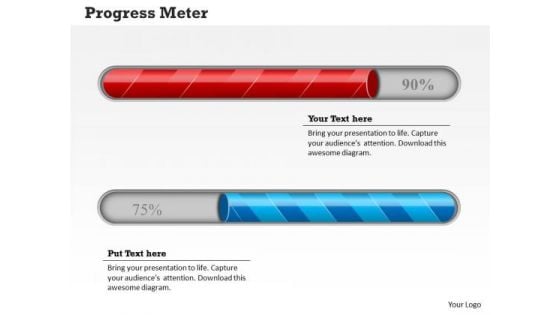
Strategy Diagram Meter Design For Business Progress Sales Diagram
Our Strategy Diagram Meter Design For Business Progress Sales Diagram Powerpoint Templates Abhor Doodling. They Never Let The Interest Flag.
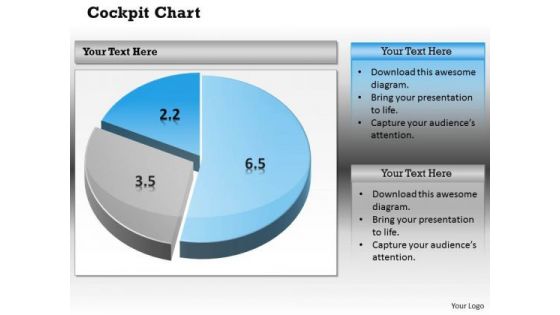
Business Cycle Diagram Pie Chart Dashborad Design Marketing Diagram
Document Your Views On Our Business Cycle Diagram Pie Chart Dashborad Design Marketing Diagram Powerpoint Templates. They Will Create A Strong Impression.
Strategy Diagram Design Of Red Large Building Business Diagram
Open Up Doors That Lead To Success. Our Strategy Diagram Design Of Red Large Building Business Diagram Powerpoint Templates Provide The Handles.
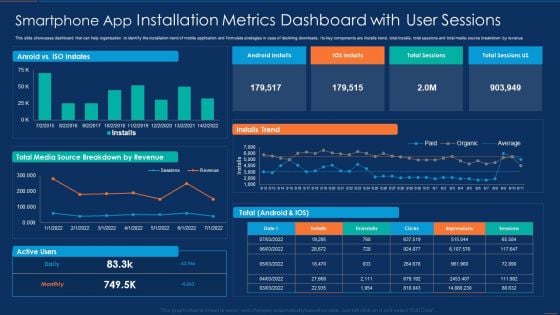
Smartphone App Installation Metrics Dashboard With User Sessions Microsoft PDF
This slide showcases dashboard that can help organization to identify the installation trend of mobile application and formulate strategies in case of declining downloads. Its key components are installs trend, total installs, total sessions and total media source breakdown by revenue. Pitch your topic with ease and precision using this Smartphone App Installation Metrics Dashboard With User Sessions Microsoft PDF. This layout presents information on Smartphone App Installation Metrics Dashboard With User Sessions. It is also available for immediate download and adjustment. So, changes can be made in the color, design, graphics or any other component to create a unique layout.
Dashboard Showing Business Performance Assessment Ppt PowerPoint Presentation Portfolio Design Templates PDF
Presenting dashboard showing business performance assessment ppt powerpoint presentation portfolio design templates pdf to dispense important information. This template comprises four stages. It also presents valuable insights into the topics including dashboard showing business performance assessment. This is a completely customizable PowerPoint theme that can be put to use immediately. So, download it and address the topic impactfully.
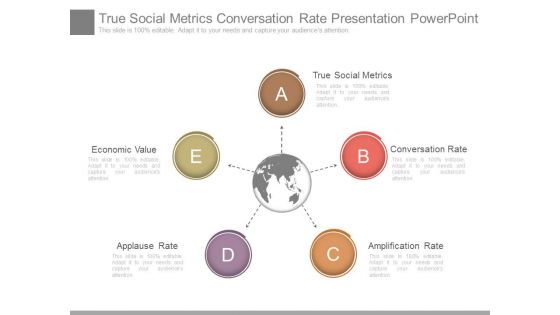
True Social Metrics Conversation Rate Presentation PowerPoint Slides
This is a true social metrics conversation rate presentation powerpoint slide. This is a five stage process. The stages in this process are technology, globe, marketing, business.
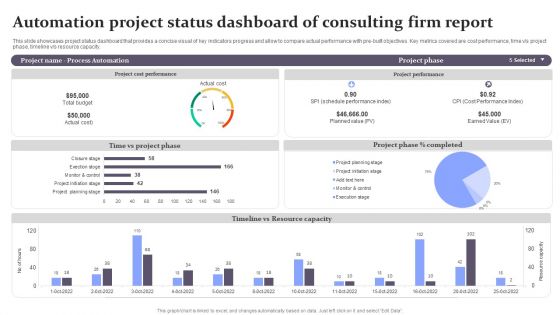
Automation Project Status Dashboard Of Consulting Firm Report Background PDF
This slide showcases project status dashboard that provides a concise visual of key indicators progress and allow to compare actual performance with pre-built objectives. Key metrics covered are cost performance, time v or s project phase, timeline v or s resource capacity. Showcasing this set of slides titled Automation Project Status Dashboard Of Consulting Firm Report Background PDF. The topics addressed in these templates are Project Phase, Planned Value, Cost Performance Index. All the content presented in this PPT design is completely editable. Download it and make adjustments in color, background, font etc. as per your unique business setting.
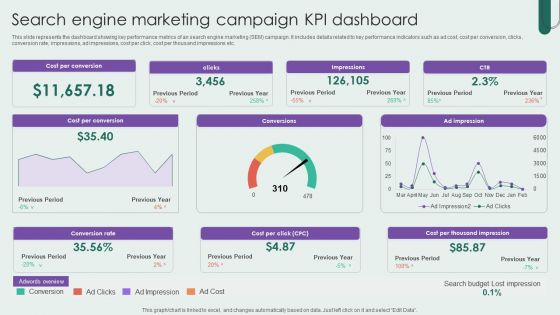
Search Engine Marketing Campaign KPI Dashboard Inspiration PDF
This slide represents the dashboard showing key performance metrics of an search engine marketing SEM campaign. It includes details related to key performance indicators such as ad cost, cost per conversion, clicks, conversion rate, impressions, ad impressions, cost per click, cost per thousand impressions etc. Showcasing this set of slides titled Search Engine Marketing Campaign KPI Dashboard Inspiration PDF. The topics addressed in these templates are Search Engine Marketing, Campaign KPI Dashboard. All the content presented in this PPT design is completely editable. Download it and make adjustments in color, background, font etc. as per your unique business setting.
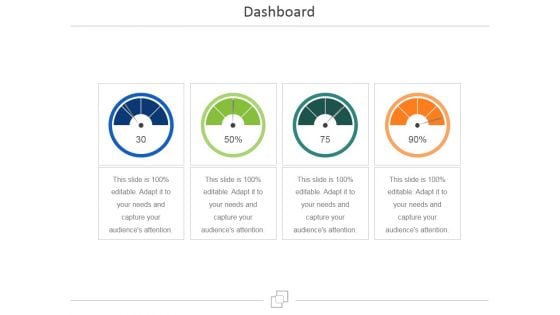
Dashboard Ppt PowerPoint Presentation Infographic Template Model
This is a dashboard ppt powerpoint presentation infographic template model. This is a four stage process. The stages in this process are business, marketing, meter, speed, measure.
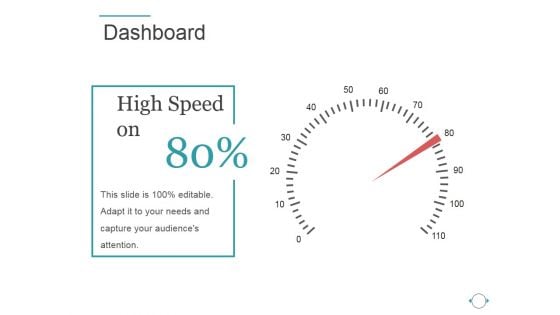
Dashboard Ppt PowerPoint Presentation File Tips
This is a dashboard ppt powerpoint presentation file tips. This is a one stage process. The stages in this process are high speed on, process, success, business, marketing.
Dashboard Ppt PowerPoint Presentation Outline Icon
This is a dashboard ppt powerpoint presentation outline icon. This is a three stage process. The stages in this process are speed, meter, business, marketing, equipment.
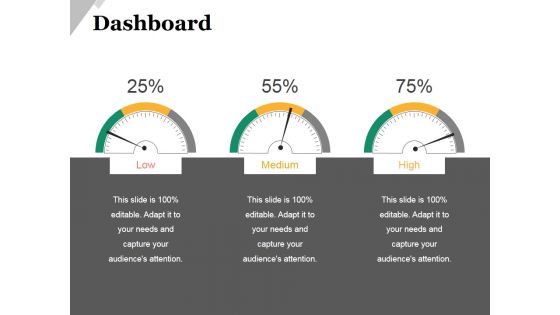
Dashboard Ppt PowerPoint Presentation Layouts Elements
This is a dashboard ppt powerpoint presentation layouts elements. This is a three stage process. The stages in this process are speed, meter, business, marketing, equipment.
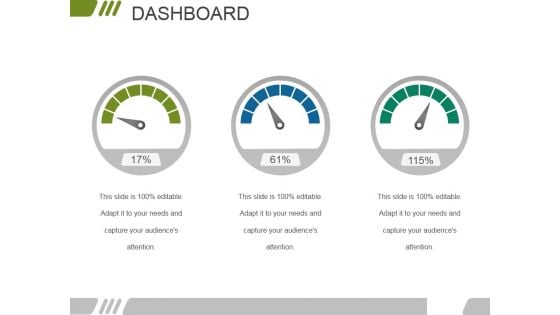
Dashboard Ppt PowerPoint Presentation Visual Aids Professional
This is a dashboard ppt powerpoint presentation visual aids professional. This is a three stage process. The stages in this process are speed, meter, business, marketing, equipment.
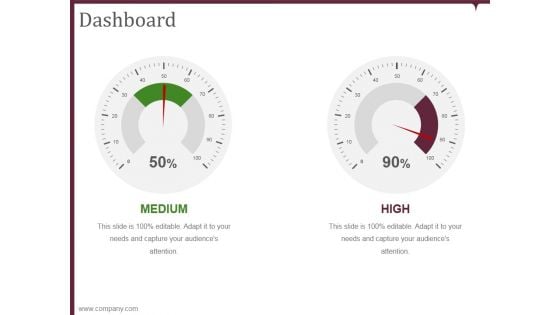
Dashboard Ppt PowerPoint Presentation Outline Professional
This is a dashboard ppt powerpoint presentation outline professional. This is a two stage process. The stages in this process are business, marketing, medium, high, management.


 Continue with Email

 Home
Home


