Snapshot
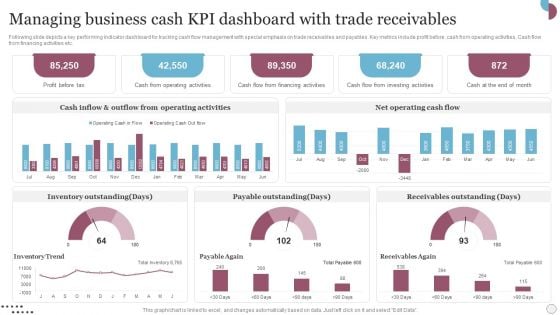
Managing Business Cash Kpi Dashboard With Trade Receivables Slides PDF
Following slide depicts a key performing indicator dashboard for tracking cash flow management with special emphasis on trade receivables and payables. Key metrics include profit before, cash from operating activities, Cash flow from financing activities etc. Showcasing this set of slides titled Managing Business Cash Kpi Dashboard With Trade Receivables Slides PDF. The topics addressed in these templates are Inventory Outstanding, Payable Outstanding, Receivables Outstanding. All the content presented in this PPT design is completely editable. Download it and make adjustments in color, background, font etc. as per your unique business setting.
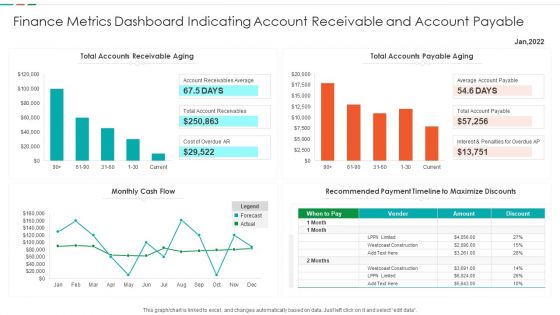
Finance Metrics Dashboard Indicating Account Receivable And Account Payable Demonstration PDF
This graph or chart is linked to excel, and changes automatically based on data. Just left click on it and select edit data. Showcasing this set of slides titled Finance Metrics Dashboard Indicating Account Receivable And Account Payable Demonstration PDF. The topics addressed in these templates are Total Accounts Receivable, Total Accounts Payable, Recommended Payment Timeline, Monthly Cash Flow. All the content presented in this PPT design is completely editable. Download it and make adjustments in color, background, font etc. as per your unique business setting.

Global Data Security Industry Report Emerging Threat Trends In Cybersecurity Industry IR SS V
The slide presents the latest threat trends in the global cybersecurity industry. The purpose of the slide is to raise awareness about the evolving landscape of cyber threats, which is crucial for individuals and organizations to stay protected. It covers threat such as automotive hacking, cloud services attacks, social engineering attacks, 5g network threats, and ransomware attacks. Slidegeeks is here to make your presentations a breeze with Global Data Security Industry Report Emerging Threat Trends In Cybersecurity Industry IR SS V With our easy-to-use and customizable templates, you can focus on delivering your ideas rather than worrying about formatting. With a variety of designs to choose from, you are sure to find one that suits your needs. And with animations and unique photos, illustrations, and fonts, you can make your presentation pop. So whether you are giving a sales pitch or presenting to the board, make sure to check out Slidegeeks first The slide presents the latest threat trends in the global cybersecurity industry. The purpose of the slide is to raise awareness about the evolving landscape of cyber threats, which is crucial for individuals and organizations to stay protected. It covers threat such as automotive hacking, cloud services attacks, social engineering attacks, 5g network threats, and ransomware attacks.
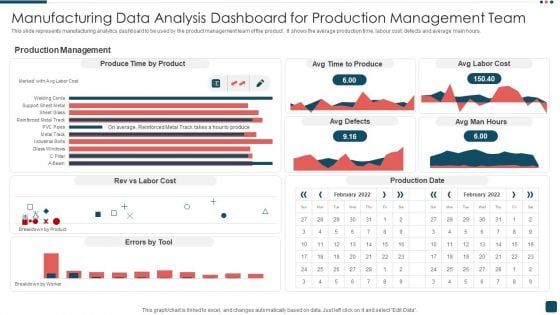
Manufacturing Data Analysis Dashboard For Production Management Team Summary PDF
This slide represents manufacturing analytics dashboard to be used by the product management team of the product . It shows the average production time, labour cost, defects and average main hours. Pitch your topic with ease and precision using this Manufacturing Data Analysis Dashboard For Production Management Team Summary PDF. This layout presents information on Production Management, Product, Cost. It is also available for immediate download and adjustment. So, changes can be made in the color, design, graphics or any other component to create a unique layout.
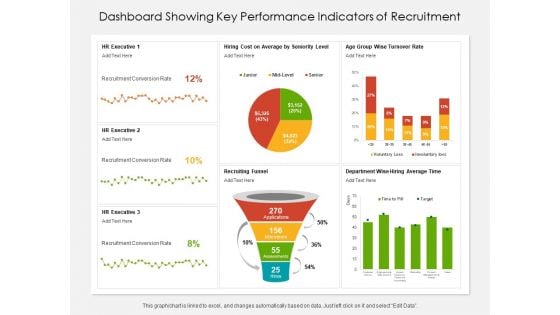
Dashboard Showing Key Performance Indicators Of Recruitment Ppt PowerPoint Presentation File Background Image PDF
Presenting this set of slides with name dashboard showing key performance indicators of recruitment ppt powerpoint presentation file background image pdf. The topics discussed in these slides are executive, funnel, department. This is a completely editable PowerPoint presentation and is available for immediate download. Download now and impress your audience.
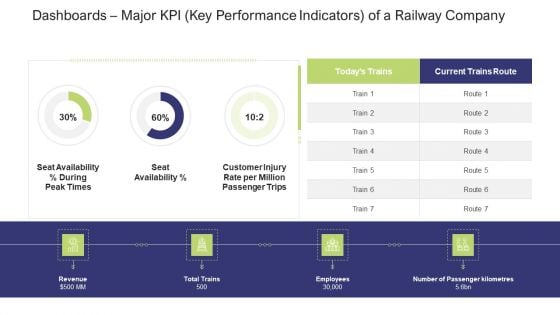
Dashboards Major KPI Key Performance Indicators Of A Railway Company Information PDF
Deliver an awe-inspiring pitch with this creative dashboards major KPI key performance indicators of a railway company information pdf. bundle. Topics like seat availability percent during, peak times, seat availability percent can be discussed with this completely editable template. It is available for immediate download depending on the needs and requirements of the user.

Executive Summary Data Analytics Company Outline Pictures PDF
The slide showcases the executive summary of the organization that includes about company, top acquisitions, and financial summary revenue, gross profit, net income, and EBITDA. Do you have an important presentation coming up Are you looking for something that will make your presentation stand out from the rest Look no further than Executive Summary Data Analytics Company Outline Pictures PDF With our professional designs, you can trust that your presentation will pop and make delivering it a smooth process. And with Slidegeeks, you can trust that your presentation will be unique and memorable. So why wait Grab Executive Summary Data Analytics Company Outline Pictures PDF today and make your presentation stand out from the rest The slide showcases the executive summary of the organization that includes about company, top acquisitions, and financial summary revenue, gross profit, net income, and EBITDA
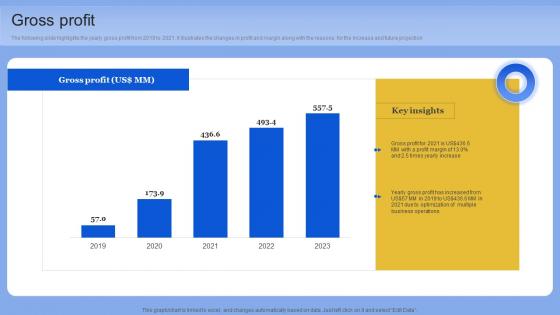
Gross Profit Data Analytics Company Outline Pictures PDF
The following slide highlights the yearly gross profit from 2019 to 2021. it illustrates the changes in profit and margin along with the reasons for the increase and future projection. Formulating a presentation can take up a lot of effort and time, so the content and message should always be the primary focus. The visuals of the PowerPoint can enhance the presenters message, so our Gross Profit Data Analytics Company Outline Pictures PDF was created to help save time. Instead of worrying about the design, the presenter can concentrate on the message while our designers work on creating the ideal templates for whatever situation is needed. Slidegeeks has experts for everything from amazing designs to valuable content, we have put everything into Gross Profit Data Analytics Company Outline Pictures PDF The following slide highlights the yearly gross profit from 2019 to 2021. it illustrates the changes in profit and margin along with the reasons for the increase and future projection
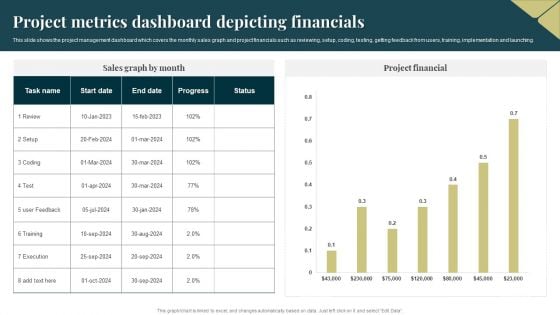
Project Metrics Dashboard Depicting Financials Pictures PDF
This slide shows the project management dashboard which covers the monthly sales graph and project financials such as reviewing, setup, coding, testing, getting feedback from users, training, implementation and launching. Pitch your topic with ease and precision using this Project Metrics Dashboard Depicting Financials Pictures PDF. This layout presents information on Execution, Project Financial. It is also available for immediate download and adjustment. So, changes can be made in the color, design, graphics or any other component to create a unique layout.
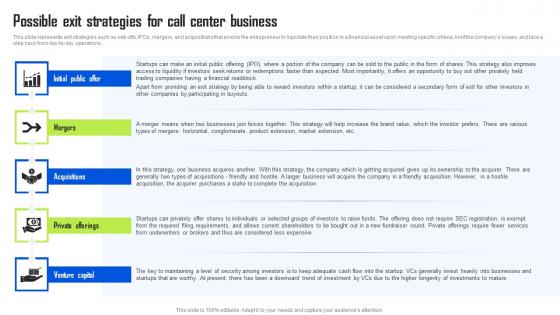
Possible Exit Strategies For Call Center Business BPO Center Business Plan Designs Pdf
This slide represents exit strategies such as sell-offs, IPOs, mergers, and acquisitions that enable the entrepreneur to liquidate their position in a financial asset upon meeting specific criteria, limit the companys losses, and take a step back from day-to-day operations. The Possible Exit Strategies For Call Center Business BPO Center Business Plan Designs Pdf is a compilation of the most recent design trends as a series of slides. It is suitable for any subject or industry presentation, containing attractive visuals and photo spots for businesses to clearly express their messages. This template contains a variety of slides for the user to input data, such as structures to contrast two elements, bullet points, and slides for written information. Slidegeeks is prepared to create an impression. This slide represents exit strategies such as sell-offs, IPOs, mergers, and acquisitions that enable the entrepreneur to liquidate their position in a financial asset upon meeting specific criteria, limit the companys losses, and take a step back from day-to-day operations.

KPI Dashboard To Monitor Facebook Marketing Strategy Performance Demonstration PDF
The following slide outlines key performance indicator KPI dashboard which can be used to evaluate Facebook advertisement performance. The metrics mentioned in slide are total fans, page views, total actions, post likes, audience growth, fans by language, etc. Slidegeeks is here to make your presentations a breeze with KPI Dashboard To Monitor Facebook Marketing Strategy Performance Demonstration PDF With our easy to use and customizable templates, you can focus on delivering your ideas rather than worrying about formatting. With a variety of designs to choose from, you are sure to find one that suits your needs. And with animations and unique photos, illustrations, and fonts, you can make your presentation pop. So whether you are giving a sales pitch or presenting to the board, make sure to check out Slidegeeks first.
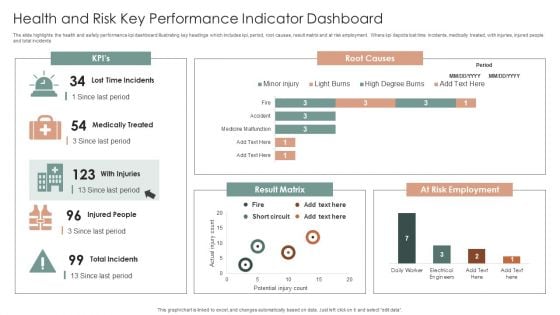
Health And Risk Key Performance Indicator Dashboard Ppt Layouts Graphics Design PDF
The slide highlights the health and safety performance kpi dashboard illustrating key headings which includes kpi, period, root causes, result matrix and at risk employment. Where kpi depicts lost time incidents, medically treated, with injuries, injured people and total incidents. Showcasing this set of slides titled Health And Risk Key Performance Indicator Dashboard Ppt Layouts Graphics Design PDF. The topics addressed in these templates are Root Causes, Result Matrix, At Risk Employment. All the content presented in this PPT design is completely editable. Download it and make adjustments in color, background, font etc. as per your unique business setting.
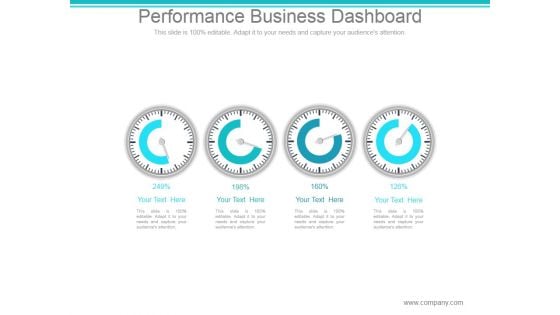
Performance Business Dashboard Ppt PowerPoint Presentation Visuals
This is a performance business dashboard ppt powerpoint presentation visuals. This is a four stage process. The stages in this process are dashboard, speedometer, report, business, marketing.
Dashboard For Tracking Aftersales Customer Services Team Performance Designs PDF
This slide covers the KPI dashboard for ticket tracking. It includes metrics such as tickets by month, service level, and details of customer service department agents. Boost your pitch with our creative Dashboard For Tracking Aftersales Customer Services Team Performance Designs PDF. Deliver an awe inspiring pitch that will mesmerize everyone. Using these presentation templates you will surely catch everyones attention. You can browse the ppts collection on our website. We have researchers who are experts at creating the right content for the templates. So you do not have to invest time in any additional work. Just grab the template now and use them.
Dashboards For Measuring Business Performance Ppt Icon
This is a dashboards for measuring business performance ppt icon. This is a three stage process. The stages in this process are dashboard, measuring, management, speedometer, icons, strategy.
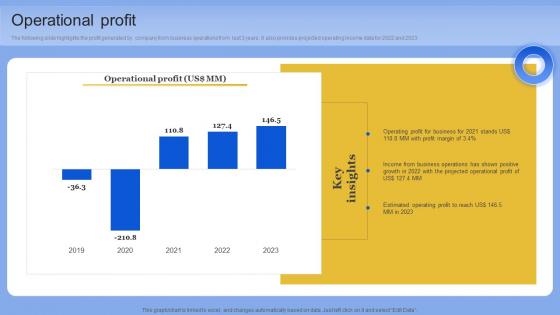
Operational Profit Data Analytics Company Outline Pictures PDF
The following slide highlights the profit generated by company from business operations from last 3 years. It also provides projected operating income data for 2022 and 2023. Slidegeeks has constructed Operational Profit Data Analytics Company Outline Pictures PDF after conducting extensive research and examination. These presentation templates are constantly being generated and modified based on user preferences and critiques from editors. Here, you will find the most attractive templates for a range of purposes while taking into account ratings and remarks from users regarding the content. This is an excellent jumping-off point to explore our content and will give new users an insight into our top-notch PowerPoint Templates. The following slide highlights the profit generated by company from business operations from last 3 years. It also provides projected operating income data for 2022 and 2023
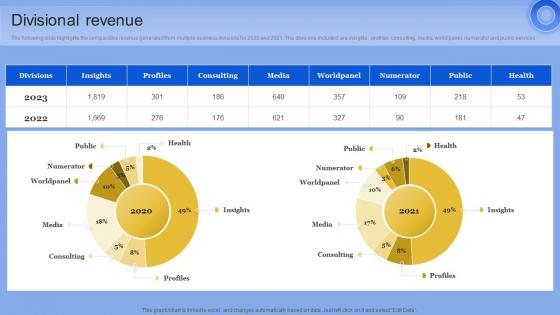
Divisional Revenue Data Analytics Company Outline Pictures PDF
The following slide highlights the comparative revenue generated from multiple business divisions for 2020 and 2021. The divisions included are insights, profiles, consulting, media, world panel, numerator and public services From laying roadmaps to briefing everything in detail, our templates are perfect for you. You can set the stage with your presentation slides. All you have to do is download these easy-to-edit and customizable templates. Divisional Revenue Data Analytics Company Outline Pictures PDF will help you deliver an outstanding performance that everyone would remember and praise you for. Do download this presentation today. The following slide highlights the comparative revenue generated from multiple business divisions for 2020 and 2021. The divisions included are insights, profiles, consulting, media, world panel, numerator and public services
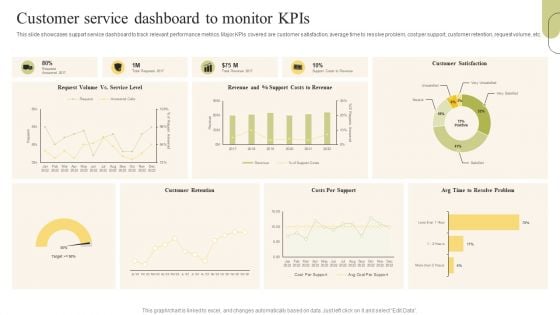
Customer Support Services Customer Service Dashboard To Monitor Kpis Microsoft PDF
This slide showcases support service dashboard to track relevant performance metrics. Major KPIs covered are customer satisfaction, average time to resolve problem, cost per support, customer retention, request volume, etc. Slidegeeks is here to make your presentations a breeze with Customer Support Services Customer Service Dashboard To Monitor Kpis Microsoft PDF With our easy-to-use and customizable templates, you can focus on delivering your ideas rather than worrying about formatting. With a variety of designs to choose from, youre sure to find one that suits your needs. And with animations and unique photos, illustrations, and fonts, you can make your presentation pop. So whether youre giving a sales pitch or presenting to the board, make sure to check out Slidegeeks first.

Picture Of Vehicle Dashboard With Petrol Gauge Ppt PowerPoint Presentation Portfolio Ideas PDF
Presenting picture of vehicle dashboard with petrol gauge ppt powerpoint presentation portfolio ideas pdf to dispense important information. This template comprises two stages. It also presents valuable insights into the topics including picture of vehicle dashboard with petrol gauge. This is a completely customizable PowerPoint theme that can be put to use immediately. So, download it and address the topic impactfully.
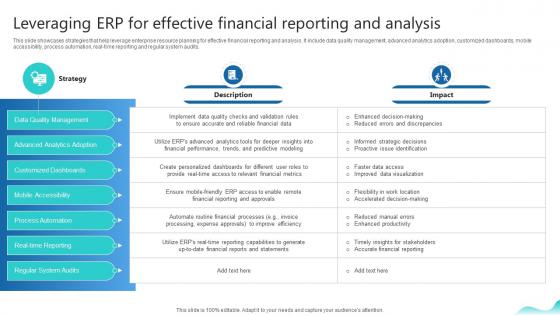
Leveraging Erp For Effective Financial Reporting Erp And Digital Transformation For Maximizing DT SS V
This slide showcases strategies that help leverage enterprise resource planning for effective financial reporting and analysis. It include data quality management, advanced analytics adoption, customized dashboards, mobile accessibility, process automation, real-time reporting and regular system audits.Make sure to capture your audiences attention in your business displays with our gratis customizable Leveraging Erp For Effective Financial Reporting Erp And Digital Transformation For Maximizing DT SS V. These are great for business strategies, office conferences, capital raising or task suggestions. If you desire to acquire more customers for your tech business and ensure they stay satisfied, create your own sales presentation with these plain slides. This slide showcases strategies that help leverage enterprise resource planning for effective financial reporting and analysis. It include data quality management, advanced analytics adoption, customized dashboards, mobile accessibility, process automation, real-time reporting and regular system audits.
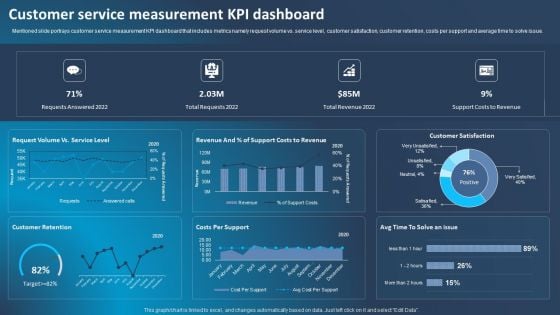
Improving Corporate Performance Customer Service Measurement Kpi Dashboard Microsoft PDF
Mentioned slide portrays customer service measurement KPI dashboard that includes metrics namely request volume vs. service level, customer satisfaction, customer retention, costs per support and average time to solve issue. Do you have to make sure that everyone on your team knows about any specific topic I yes, then you should give Improving Corporate Performance Customer Service Measurement Kpi Dashboard Microsoft PDF a try. Our experts have put a lot of knowledge and effort into creating this impeccable Improving Corporate Performance Customer Service Measurement Kpi Dashboard Microsoft PDF. You can use this template for your upcoming presentations, as the slides are perfect to represent even the tiniest detail. You can download these templates from the Slidegeeks website and these are easy to edit. So grab these today.
Customer Service Metrics Dashboard With Customer Retention Rate Icons PDF
This slide showcases KPIs dashboard for customer service that can help organization to track the consumer satisfaction score and improve product or service by improving customer loyalty. Its key components are net promoter score, customer retention and support costs. Showcasing this set of slides titled Customer Service Metrics Dashboard With Customer Retention Rate Icons PDF. The topics addressed in these templates are Customer Retention, Net Promoter Score, Service Level. All the content presented in this PPT design is completely editable. Download it and make adjustments in color, background, font etc. as per your unique business setting.
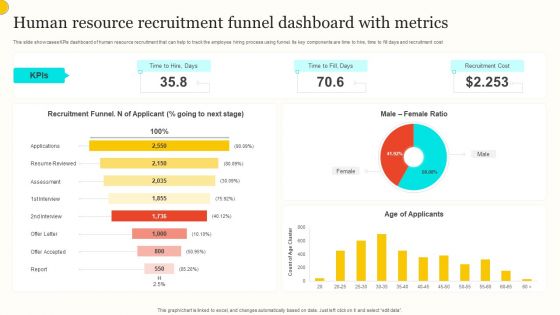
Human Resource Recruitment Funnel Dashboard With Metrics Summary PDF
This slide showcases KPIs dashboard of human resource recruitment that can help to track the employee hiring process using funnel. Its key components are time to hire, time to fill days and recruitment cost. Showcasing this set of slides titled Human Resource Recruitment Funnel Dashboard With Metrics Summary PDF. The topics addressed in these templates are Recruitment Funnel, Male Female Ratio, Age Applicants. All the content presented in this PPT design is completely editable. Download it and make adjustments in color, background, font etc. as per your unique business setting.
Picture Of Scooter Dashboard With Fuel Gauge Ppt PowerPoint Presentation File Icon PDF
Persuade your audience using this picture of scooter dashboard with fuel gauge ppt powerpoint presentation file icon pdf. This PPT design covers four stages, thus making it a great tool to use. It also caters to a variety of topics including picture of scooter dashboard with fuel gauge. Download this PPT design now to present a convincing pitch that not only emphasizes the topic but also showcases your presentation skills.
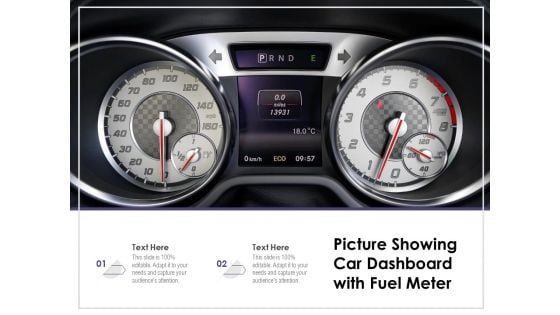
Picture Showing Car Dashboard With Fuel Meter Ppt PowerPoint Presentation Summary Grid PDF
Persuade your audience using this picture showing car dashboard with fuel meter ppt powerpoint presentation summary grid pdf. This PPT design covers two stages, thus making it a great tool to use. It also caters to a variety of topics including picture showing car dashboard with fuel meter. Download this PPT design now to present a convincing pitch that not only emphasizes the topic but also showcases your presentation skills.
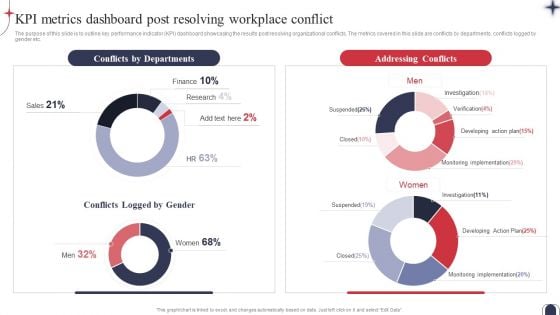
Workplace Conflict Resolution KPI Metrics Dashboard Post Resolving Workplace Designs PDF
The purpose of this slide is to outline key performance indicator KPI dashboard showcasing the results post resolving organizational conflicts. The metrics covered in this slide are conflicts by departments, conflicts logged by gender etc. The best PPT templates are a great way to save time, energy, and resources. Slidegeeks have 100 percent editable powerpoint slides making them incredibly versatile. With these quality presentation templates, you can create a captivating and memorable presentation by combining visually appealing slides and effectively communicating your message. Download Workplace Conflict Resolution KPI Metrics Dashboard Post Resolving Workplace Designs PDF from Slidegeeks and deliver a wonderful presentation.
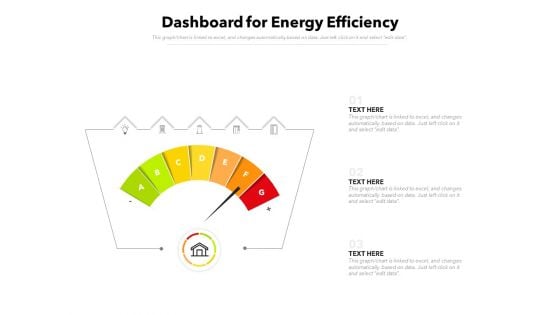
Dashboard For Energy Efficiency Ppt PowerPoint Presentation Show Format PDF
Pitch your topic with ease and precision using this dashboard for energy efficiency ppt powerpoint presentation show format pdf. This layout presents information on dashboard for energy efficiency. It is also available for immediate download and adjustment. So, changes can be made in the color, design, graphics or any other component to create a unique layout.
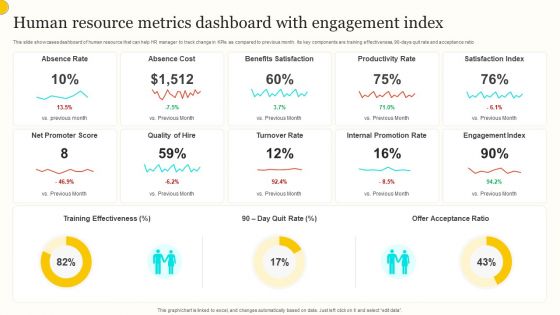
Human Resource Metrics Dashboard With Engagement Index Guidelines PDF
This slide showcases dashboard of human resource that can help HR manager to track change in KPIs as compared to previous month. Its key components are training effectiveness, 90 days quit rate and acceptance ratio. Pitch your topic with ease and precision using this Human Resource Metrics Dashboard With Engagement Index Guidelines PDF. This layout presents information on Absence Rate, Absence Cost, Benefits Satisfaction. It is also available for immediate download and adjustment. So, changes can be made in the color, design, graphics or any other component to create a unique layout.
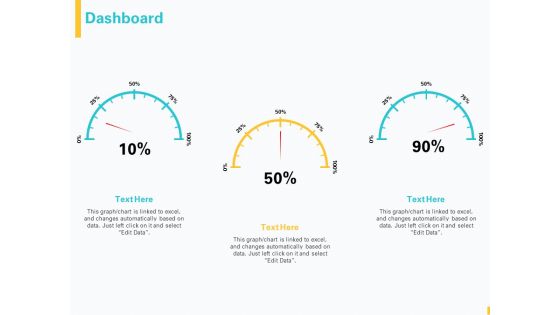
Designing Great Client Experience Action Plan Dashboard Ppt PowerPoint Presentation Pictures Graphics Download PDF
This is a designing great client experience action plan dashboard ppt powerpoint presentation pictures graphics download pdf template with various stages. Focus and dispense information on three stages using this creative set, that comes with editable features. It contains large content boxes to add your information on topics like dashboard. You can also showcase facts, figures, and other relevant content using this PPT layout. Grab it now.
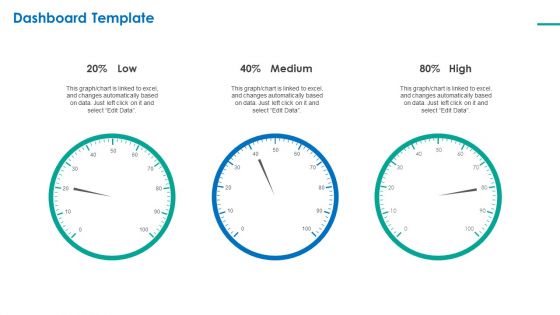
Investor Pitch Deck For Short Term Bridge Loan Dashboard Template Ppt PowerPoint Presentation Pictures Graphics PDF
This is a investor pitch deck for short term bridge loan dashboard template ppt powerpoint presentation pictures graphics pdf template with various stages. Focus and dispense information on three stages using this creative set, that comes with editable features. It contains large content boxes to add your information on topics like dashboard template. You can also showcase facts, figures, and other relevant content using this PPT layout. Grab it now.
Vector Showing Risk Assessment Dashboard Icon Ppt PowerPoint Presentation Professional Picture PDF
Persuade your audience using this vector showing risk assessment dashboard icon ppt powerpoint presentation professional picture pdf. This PPT design covers three stages, thus making it a great tool to use. It also caters to a variety of topics including vector showing risk assessment dashboard. Download this PPT design now to present a convincing pitch that not only emphasizes the topic but also showcases your presentation skills.
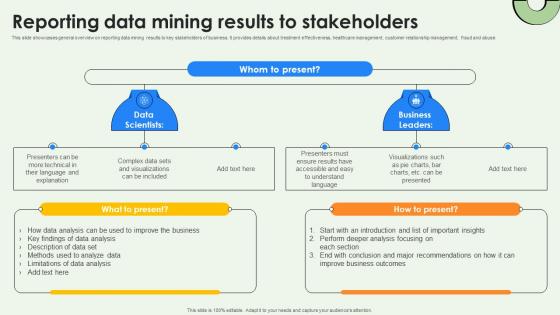
Data Warehousing And Reporting Data Mining Results To Stakeholders AI SS V
This slide showcases general overview on reporting data mining results to key stakeholders of business. It provides details about treatment effectiveness, healthcare management, customer relationship management, fraud and abuse. Are you in need of a template that can accommodate all of your creative concepts This one is crafted professionally and can be altered to fit any style. Use it with Google Slides or PowerPoint. Include striking photographs, symbols, depictions, and other visuals. Fill, move around, or remove text boxes as desired. Test out color palettes and font mixtures. Edit and save your work, or work with colleagues. Download Data Warehousing And Reporting Data Mining Results To Stakeholders AI SS V and observe how to make your presentation outstanding. Give an impeccable presentation to your group and make your presentation unforgettable. This slide showcases general overview on reporting data mining results to key stakeholders of business. It provides details about treatment effectiveness, healthcare management, customer relationship management, fraud and abuse.
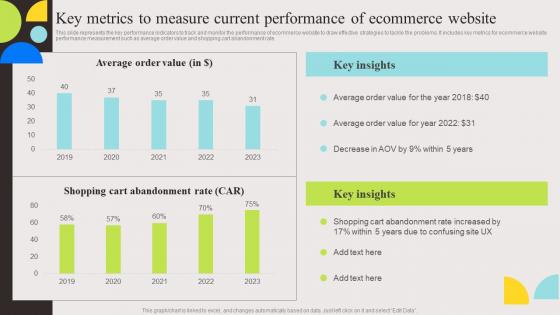
Key Metrics To Measure Current Evaluation And Deployment Of Enhanced Professional Pdf
This slide represents the key performance indicators to track and monitor the performance of ecommerce website to draw effective strategies to tackle the problems. It includes key metrics for ecommerce website performance measurement such as average order value and shopping cart abandonment rate. Are you searching for a Key Metrics To Measure Current Evaluation And Deployment Of Enhanced Professional Pdf that is uncluttered, straightforward, and original It is easy to edit, and you can change the colors to suit your personal or business branding. For a presentation that expresses how much effort you have put in, this template is ideal With all of its features, including tables, diagrams, statistics, and lists, it is perfect for a business plan presentation. Make your ideas more appealing with these professional slides. Download Key Metrics To Measure Current Evaluation And Deployment Of Enhanced Professional Pdf from Slidegeeks today. This slide represents the key performance indicators to track and monitor the performance of ecommerce website to draw effective strategies to tackle the problems. It includes key metrics for ecommerce website performance measurement such as average order value and shopping cart abandonment rate.

Global Data Security Industry Report Overview Of Cybersecurity Market Landscape IR SS V
The slide highlights a comprehensive overview of the cyber security industry. The purpose of the slide is to provide insights to stakeholders enabling them to make strategic decisions. The slide covers market sizing, and statistics related to cybersecurity spending, cybercrimes, and venture funding. This modern and well-arranged Global Data Security Industry Report Overview Of Cybersecurity Market Landscape IR SS V provides lots of creative possibilities. It is very simple to customize and edit with the Powerpoint Software. Just drag and drop your pictures into the shapes. All facets of this template can be edited with Powerpoint, no extra software is necessary. Add your own material, put your images in the places assigned for them, adjust the colors, and then you can show your slides to the world, with an animated slide included. The slide highlights a comprehensive overview of the cyber security industry. The purpose of the slide is to provide insights to stakeholders enabling them to make strategic decisions. The slide covers market sizing, and statistics related to cybersecurity spending, cybercrimes, and venture funding.

Global Data Security Industry Report Blueprint Of The Global Cybersecurity Industry Report IR SS V
The slide shows the overview of the cybersecurity industry report. It sets the stage for subsequent content by introducing the key topics covered in the report to capture the readers attention. It covers a detailed scope, research methodology, and objectives. Slidegeeks is one of the best resources for PowerPoint templates. You can download easily and regulate Global Data Security Industry Report Blueprint Of The Global Cybersecurity Industry Report IR SS V for your personal presentations from our wonderful collection. A few clicks is all it takes to discover and get the most relevant and appropriate templates. Use our Templates to add a unique zing and appeal to your presentation and meetings. All the slides are easy to edit and you can use them even for advertisement purposes. The slide shows the overview of the cybersecurity industry report. It sets the stage for subsequent content by introducing the key topics covered in the report to capture the readers attention. It covers a detailed scope, research methodology, and objectives.
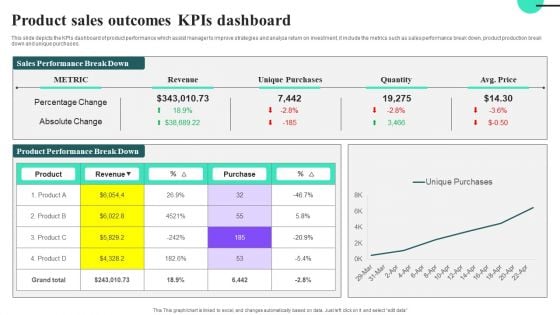
Product Sales Outcomes Kpis Dashboard Ideas PDF
This slide depicts the KPIs dashboard of product performance which assist manager to improve strategies and analyze return on investment, it include the metrics such as sales performance break down, product production break down and unique purchases.Showcasing this set of slides titled Product Sales Outcomes Kpis Dashboard Ideas PDF. The topics addressed in these templates are Percentage Change, Absolute Change. All the content presented in this PPT design is completely editable. Download it and make adjustments in color, background, font etc. as per your unique business setting.
Activity Tracker Dashboard In Powerpoint And Google Slides Cpb
Presenting our innovatively-designed set of slides titled Activity Tracker Dashboard In Powerpoint And Google Slides Cpb This completely editable PowerPoint graphic exhibits Activity Tracker Dashboard that will help you convey the message impactfully. It can be accessed with Google Slides and is available in both standard screen and widescreen aspect ratios. Apart from this, you can download this well-structured PowerPoint template design in different formats like PDF, JPG, and PNG. So, click the download button now to gain full access to this PPT design. Our Activity Tracker Dashboard In Powerpoint And Google Slides Cpb are topically designed to provide an attractive backdrop to any subject. Use them to look like a presentation pro.
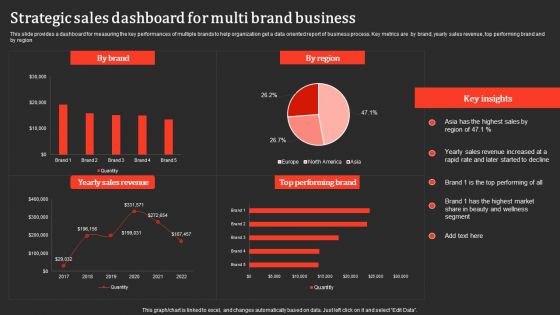
Strategic Sales Dashboard For Multi Brand Business Professional PDF
This slide provides a dashboard for measuring the key performances of multiple brands to help organization get a data oriented report of business process. Key metrics are by brand, yearly sales revenue, top performing brand and by region. Pitch your topic with ease and precision using this Strategic Sales Dashboard For Multi Brand Business Professional PDF. This layout presents information on Yearly Sales Revenue, Performing Brand. It is also available for immediate download and adjustment. So, changes can be made in the color, design, graphics or any other component to create a unique layout.

Global Data Security Industry Report Executive Summary Of Cybersecurity Industry Report IR SS V
The purpose of the slide is to provide a concise overview of the cybersecurity industry, serving as a valuable resource for industry professionals, investors, and policymakers. It includes a short description of the market, growth factors, restraints, and competitive landscape. Do you have an important presentation coming up Are you looking for something that will make your presentation stand out from the rest Look no further than Global Data Security Industry Report Executive Summary Of Cybersecurity Industry Report IR SS V. With our professional designs, you can trust that your presentation will pop and make delivering it a smooth process. And with Slidegeeks, you can trust that your presentation will be unique and memorable. So why wait Grab Global Data Security Industry Report Executive Summary Of Cybersecurity Industry Report IR SS V today and make your presentation stand out from the rest The purpose of the slide is to provide a concise overview of the cybersecurity industry, serving as a valuable resource for industry professionals, investors, and policymakers. It includes a short description of the market, growth factors, restraints, and competitive landscape.
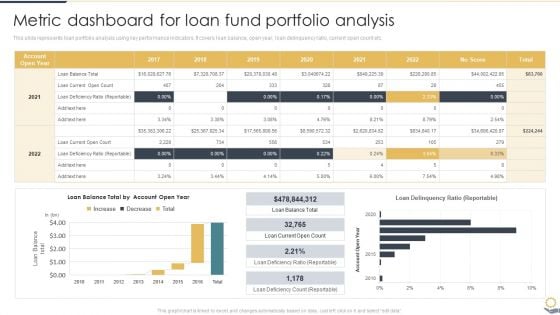
Metric Dashboard For Loan Fund Portfolio Analysis Portfolio Investment Analysis Formats PDF
This slide represents loan portfolio analysis using key performance indicators. It covers loan balance, open year, loan delinquency ratio, current open count etc.From laying roadmaps to briefing everything in detail, our templates are perfect for you. You can set the stage with your presentation slides. All you have to do is download these easy-to-edit and customizable templates. Metric Dashboard For Loan Fund Portfolio Analysis Portfolio Investment Analysis Formats PDF will help you deliver an outstanding performance that everyone would remember and praise you for. Do download this presentation today.
Dashboard For Tracking Aftersales Customer Services Team Performance Portrait PDF
This slide covers the KPI dashboard for ticket tracking. It includes metrics such as tickets by month, service level, and details of customer service department agents. Retrieve professionally designed Dashboard For Tracking Aftersales Customer Services Team Performance Portrait PDF to effectively convey your message and captivate your listeners. Save time by selecting pre-made slideshows that are appropriate for various topics, from business to educational purposes. These themes come in many different styles, from creative to corporate, and all of them are easily adjustable and can be edited quickly. Access them as PowerPoint templates or as Google Slides themes. You do not have to go on a hunt for the perfect presentation because Slidegeeks got you covered from everywhere.
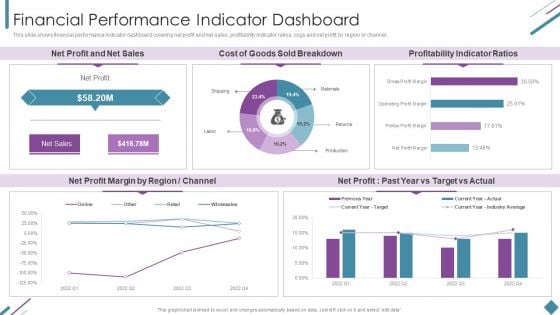
Metrics To Measure Business Performance Financial Performance Indicator Dashboard Pictures PDF
This slide shows financial performance indicator dashboard covering net profit and net sales, profitability indicator ratios, cogs and net profit by region or channel. Deliver an awe inspiring pitch with this creative Metrics To Measure Business Performance Financial Performance Indicator Dashboard Pictures PDF bundle. Topics like Net Profit, Net Sales, Cost Goods, Sold Breakdown can be discussed with this completely editable template. It is available for immediate download depending on the needs and requirements of the user.

Risk Key Performance Indicator Dashboard Ppt PowerPoint Presentation Complete Deck With Slides
Boost your confidence and team morale with this well-structured Risk Key Performance Indicator Dashboard Ppt PowerPoint Presentation Complete Deck With Slides. This prefabricated set gives a voice to your presentation because of its well-researched content and graphics. Our experts have added all the components very carefully, thus helping you deliver great presentations with a single click. Not only that, it contains a set of sixteen slides that are designed using the right visuals, graphics, etc. Various topics can be discussed, and effective brainstorming sessions can be conducted using the wide variety of slides added in this complete deck. Apart from this, our PPT design contains clear instructions to help you restructure your presentations and create multiple variations. The color, format, design anything can be modified as deemed fit by the user. Not only this, it is available for immediate download. So, grab it now.
Overview Of BI For Enhanced Decision Making Business Intelligence Key Metrics Dashboard Icons PDF
This slide covers the key performance tracking dashboard of an organization prepared with the help of BI software. It includes key metrics such as data exchange trend, department distribution, data sampling etc. Slidegeeks is one of the best resources for PowerPoint templates. You can download easily and regulate Overview Of BI For Enhanced Decision Making Business Intelligence Key Metrics Dashboard Icons PDF for your personal presentations from our wonderful collection. A few clicks is all it takes to discover and get the most relevant and appropriate templates. Use our Templates to add a unique zing and appeal to your presentation and meetings. All the slides are easy to edit and you can use them even for advertisement purposes.
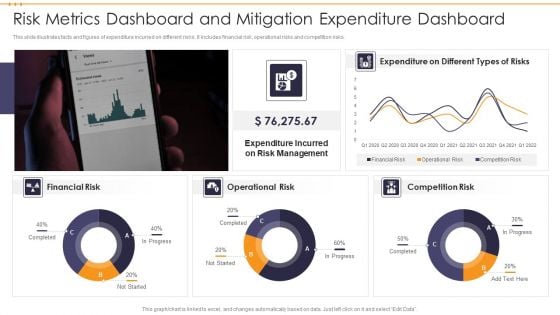
Risk Metrics Dashboard And Mitigation Expenditure Dashboard Ideas PDF
This slide illustrates facts and figures of expenditure incurred on different risks. It includes financial risk, operational risks and competition risks. Pitch your topic with ease and precision using this Risk Metrics Dashboard And Mitigation Expenditure Dashboard Ideas PDF. This layout presents information on Management, Expenditure, Risk. It is also available for immediate download and adjustment. So, changes can be made in the color, design, graphics or any other component to create a unique layout.

Product Sales Report Dashboard For Profit Margin Analysis Ppt PowerPoint Presentation Ideas Slide Portrait
This is a product sales report dashboard for profit margin analysis ppt powerpoint presentation ideas slide portrait. This is a four stage process. The stages in this process are business analytics, ba, organizations data.
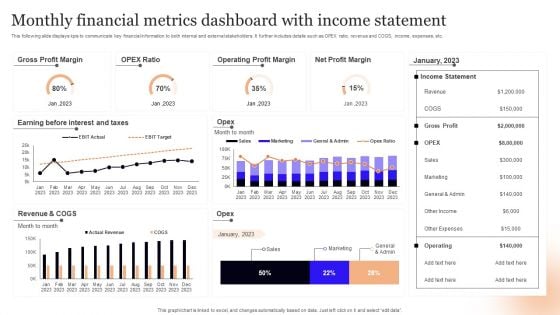
Monthly Financial Metrics Dashboard With Income Statement Infographics PDF
This following slide displays kpis to communicate key financial information to both internal and external stakeholders. It further includes details such as OPEX ratio, revenue and COGS, income, expenses, etc. Showcasing this set of slides titled Monthly Financial Metrics Dashboard With Income Statement Infographics PDF. The topics addressed in these templates are Gross Profit Margin, Taxes, Revenue. All the content presented in this PPT design is completely editable. Download it and make adjustments in color, background, font etc. as per your unique business setting.

Store Performance Dashboard In Powerpoint And Google Slides Cpb
Introducing our well designed Store Performance Dashboard In Powerpoint And Google Slides Cpb. This PowerPoint design presents information on topics like Store Performance Dashboard. As it is predesigned it helps boost your confidence level. It also makes you a better presenter because of its high quality content and graphics. This PPT layout can be downloaded and used in different formats like PDF, PNG, and JPG. Not only this, it is available in both Standard Screen and Widescreen aspect ratios for your convenience. Therefore, click on the download button now to persuade and impress your audience. Our Store Performance Dashboard In Powerpoint And Google Slides Cpb are topically designed to provide an attractive backdrop to any subject. Use them to look like a presentation pro.
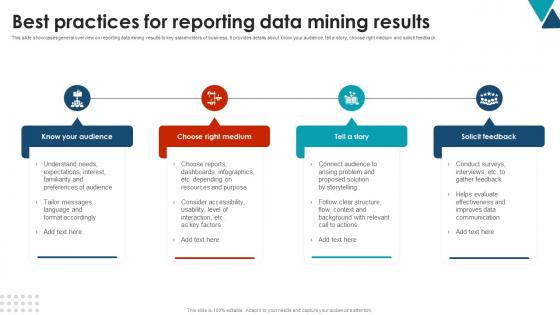
Best Practices For Reporting Data Mining Results Using Data Mining Tools To Optimize Processes AI SS V
This slide showcases general overview on reporting data mining results to key stakeholders of business. It provides details about know your audience, tell a story, choose right medium and solicit feedback. From laying roadmaps to briefing everything in detail, our templates are perfect for you. You can set the stage with your presentation slides. All you have to do is download these easy-to-edit and customizable templates. Best Practices For Reporting Data Mining Results Using Data Mining Tools To Optimize Processes AI SS V will help you deliver an outstanding performance that everyone would remember and praise you for. Do download this presentation today. This slide showcases general overview on reporting data mining results to key stakeholders of business. It provides details about know your audience, tell a story, choose right medium and solicit feedback.
Education Metrics Dashboard For Tracking Student Ethnicity And Specially Abled Characteristics Brochure PDF
This slide covers the education key performance indicator tracker. It include metrics such as total applications, conversion rate, offers year to date, applications by ethnicity and disabilities, etc. Showcasing this set of slides titled Education Metrics Dashboard For Tracking Student Ethnicity And Specially Abled Characteristics Brochure PDF. The topics addressed in these templates are Total Applications, Conversion Rate 2022, Ethnicity. All the content presented in this PPT design is completely editable. Download it and make adjustments in color, background, font etc. as per your unique business setting.
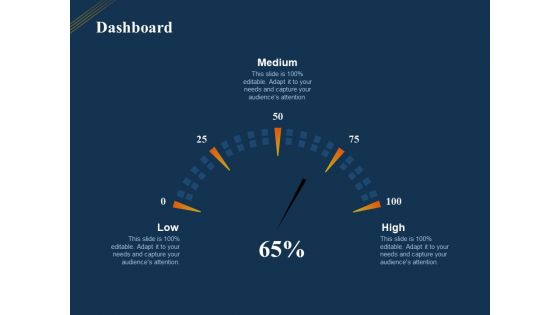
Product Distribution Sales And Marketing Channels Dashboard Ppt Example PDF
Presenting this set of slides with name product distribution sales and marketing channels dashboard ppt example pdf. The topics discussed in these slides are low, medium, high. This is a completely editable PowerPoint presentation and is available for immediate download. Download now and impress your audience.
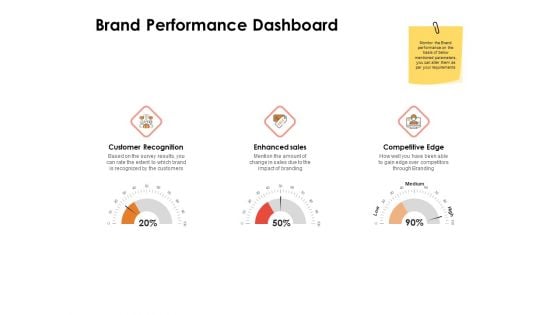
Label Identity Design Brand Performance Dashboard Ppt File Rules PDF
Deliver an awe-inspiring pitch with this creative label identity design brand performance dashboard ppt file rules pdf bundle. Topics like customer recognition, enhanced sales, competitive edge can be discussed with this completely editable template. It is available for immediate download depending on the needs and requirements of the user.
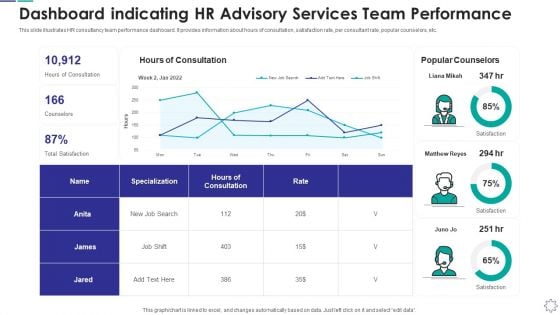
Dashboard Indicating Hr Advisory Services Team Performance
This slide illustrates HR consultancy team performance dashboard. It provides information about hours of consultation, satisfaction rate, per consultant rate, popular counselors, etc. Pitch your topic with ease and precision using this dashboard indicating hr advisory services team performance download pdf. This layout presents information on dashboard indicating hr advisory services team performance. It is also available for immediate download and adjustment. So, changes can be made in the color, design, graphics or any other component to create a unique layout.
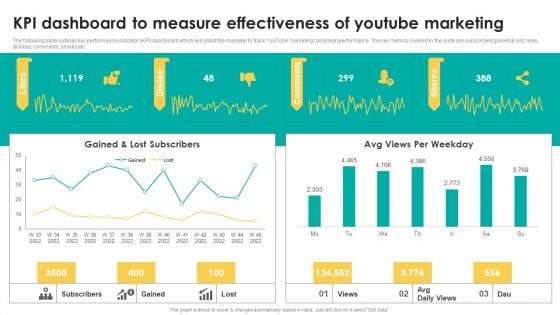
KPI Dashboard To Measure Effectiveness Of Youtube Marketing Pictures PDF
The following slide outlines key performance indicator KPI dashboard which will assist the marketer to track YouTube marketing campaign performance. The key metrics covered in the slide are subscribers gained and lost, likes, dislikes, comments, shares etc. Present like a pro with KPI Dashboard To Measure Effectiveness Of Youtube Marketing Pictures PDF Create beautiful presentations together with your team, using our easy to use presentation slides. Share your ideas in real time and make changes on the fly by downloading our templates. So whether you are in the office, on the go, or in a remote location, you can stay in sync with your team and present your ideas with confidence. With Slidegeeks presentation got a whole lot easier. Grab these presentations today.
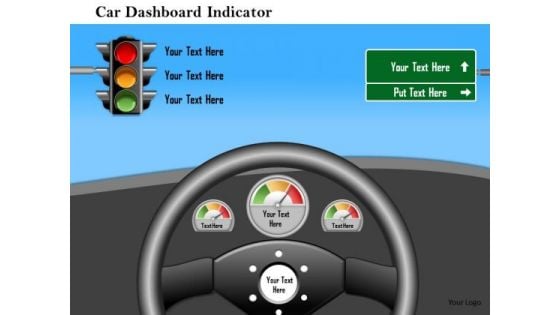
Business Framework Car Dashboard Indicator PowerPoint Presentation
Define the concept of target achievement and success with this exclusive PPT slide. To display this concept we have used graphic of target board and dart. This PPT slide also defines the concept of bull's eye condition. Use this PPT for business and marketing target related presentations.
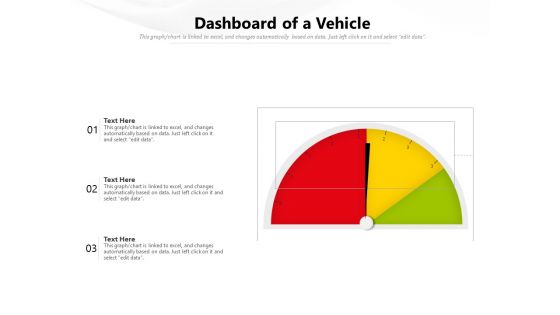
Dashboard Of A Vehicle Ppt PowerPoint Presentation Outline Layout Ideas PDF
Showcasing this set of slides titled dashboard of a vehicle ppt powerpoint presentation outline layout ideas pdf. The topics addressed in these templates are dashboard of a vehicle. All the content presented in this PPT design is completely editable. Download it and make adjustments in color, background, font etc. as per your unique business setting.
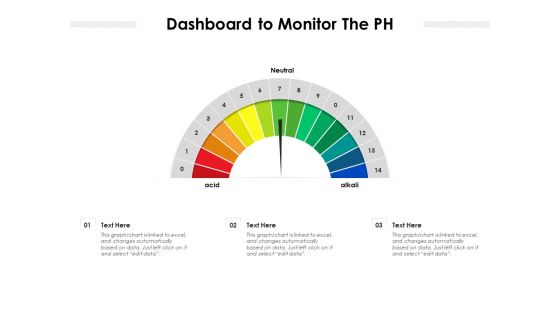
Dashboard To Monitor The PH Ppt PowerPoint Presentation Outline Master Slide PDF
Showcasing this set of slides titled dashboard to monitor the ph ppt powerpoint presentation outline master slide pdf. The topics addressed in these templates are dashboard to monitor the ph. All the content presented in this PPT design is completely editable. Download it and make adjustments in color, background, font etc. as per your unique business setting.
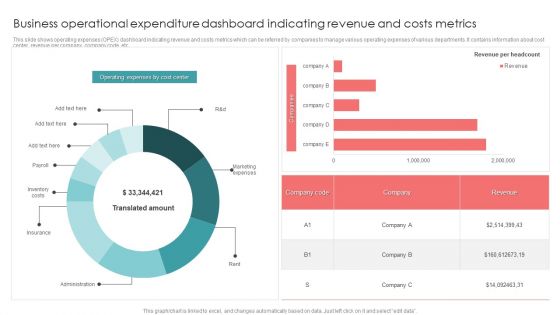
Business Operational Expenditure Dashboard Indicating Revenue And Costs Metrics Pictures PDF
This slide shows operating expenses OPEX dashboard indicating revenue and costs metrics which can be referred by companies to manage various operating expenses of various departments. It contains information about cost center, revenue per company, company code, etc. Pitch your topic with ease and precision using this Business Operational Expenditure Dashboard Indicating Revenue And Costs Metrics Pictures PDF. This layout presents information on Business Operational, Costs Metrics, Revenue. It is also available for immediate download and adjustment. So, changes can be made in the color, design, graphics or any other component to create a unique layout.
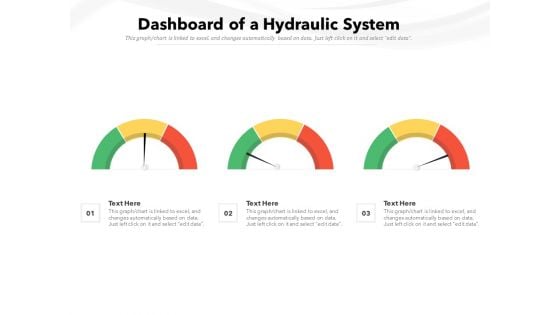
Dashboard Of A Hydraulic System Ppt PowerPoint Presentation Summary Display PDF
Pitch your topic with ease and precision using this dashboard of a hydraulic system ppt powerpoint presentation summary display pdf. This layout presents information on dashboard of a hydraulic system. It is also available for immediate download and adjustment. So, changes can be made in the color, design, graphics or any other component to create a unique layout.
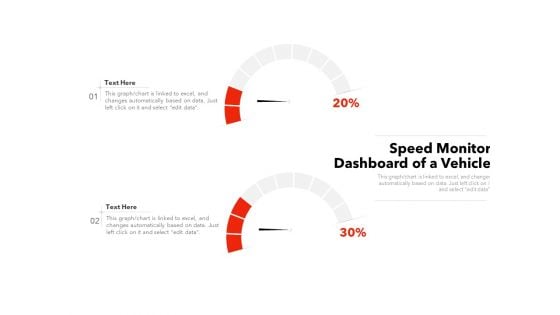
Speed Monitor Dashboard Of A Vehicle Ppt PowerPoint Presentation Model Summary PDF
Pitch your topic with ease and precision using this speed monitor dashboard of a vehicle ppt powerpoint presentation model summary pdf. This layout presents information on speed monitor dashboard of a vehicle. It is also available for immediate download and adjustment. So, changes can be made in the color, design, graphics or any other component to create a unique layout.


 Continue with Email

 Home
Home


