Snapshot
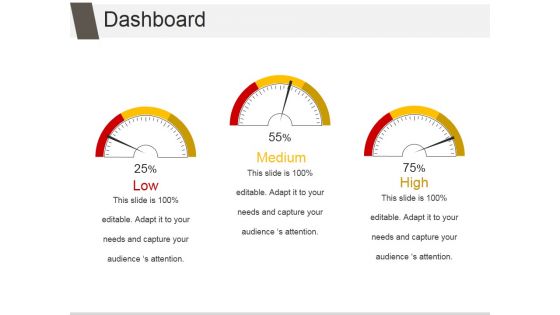
Dashboard Ppt PowerPoint Presentation Inspiration File Formats
This is a dashboard ppt powerpoint presentation inspiration file formats. This is a three stage process. The stages in this process are speed, meter, business, marketing, equipment.
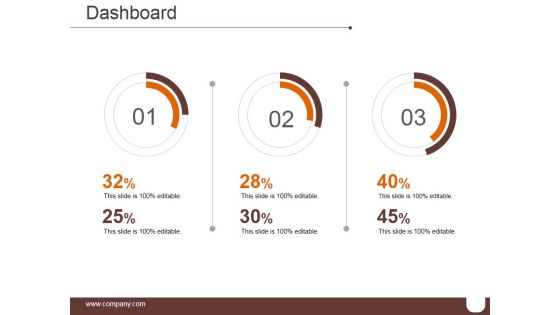
Dashboard Ppt PowerPoint Presentation Infographics Format Ideas
This is a dashboard ppt powerpoint presentation infographics format ideas. This is a three stage process. The stages in this process are speed, meter, business, marketing, equipment.
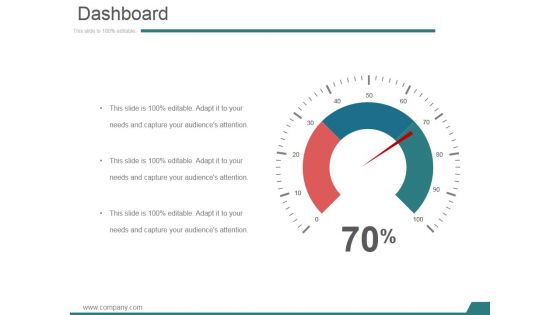
Dashboard Ppt PowerPoint Presentation Infographics Sample
This is a dashboard ppt powerpoint presentation infographics sample. This is a one stage process. The stages in this process are speed, meter, business, marketing, equipment.
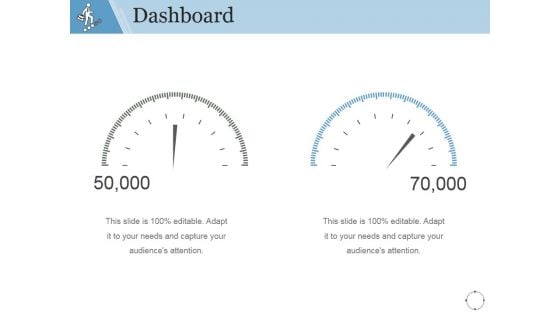
Dashboard Ppt PowerPoint Presentation Gallery Layouts
This is a dashboard ppt powerpoint presentation gallery layouts. This is a two stage process. The stages in this process are speed, meter, business, marketing, equipment.
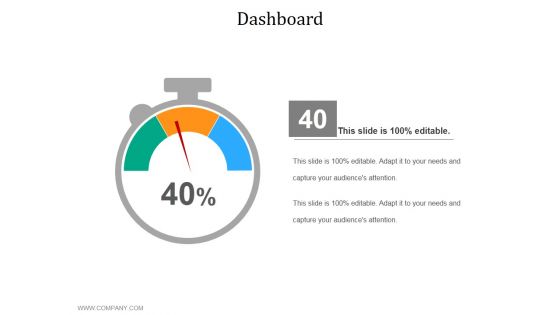
Dashboard Ppt PowerPoint Presentation Summary Example Topics
This is a dashboard ppt powerpoint presentation summary example topics. This is a one stage process. The stages in this process are speed, meter, business, marketing, equipment.
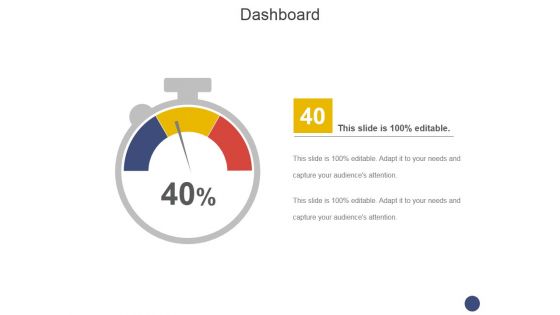
Dashboard Ppt PowerPoint Presentation Layouts Diagrams
This is a dashboard ppt powerpoint presentation layouts diagrams. This is a one stage process. The stages in this process are speed, meter, business, marketing, equipment.
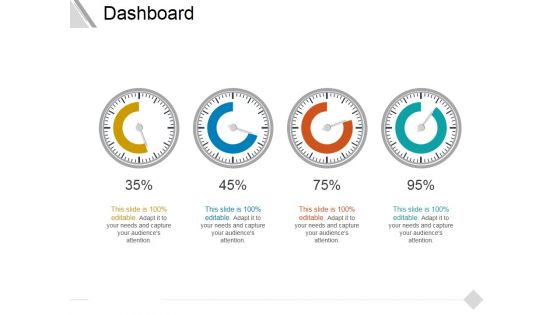
Dashboard Ppt PowerPoint Presentation Slides Styles
This is a dashboard ppt powerpoint presentation slides styles. This is a four stage process. The stages in this process are speed, meter, business, marketing, equipment.
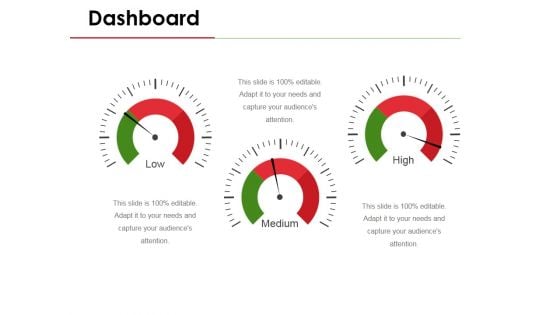
Dashboard Ppt PowerPoint Presentation File Background
This is a dashboard ppt powerpoint presentation file background. This is a three stage process. The stages in this process are speed, meter, business, marketing, equipment.
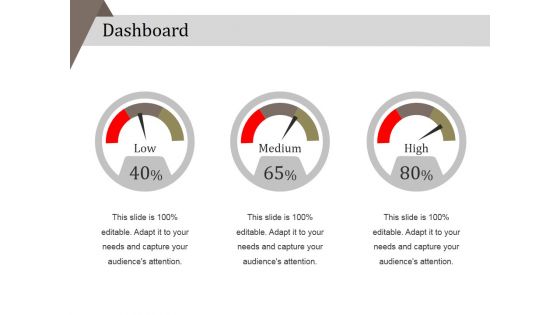
Dashboard Ppt PowerPoint Presentation Styles Smartart
This is a dashboard ppt powerpoint presentation styles smartart. This is a three stage process. The stages in this process are low, medium, high, marketing, business.

dashboard ppt powerpoint presentation gallery deck
This is a dashboard ppt powerpoint presentation gallery deck. This is a four stage process. The stages in this process are percentage, process, business, marketing, strategy.
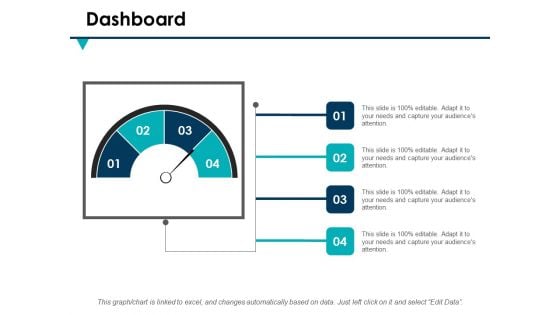
Dashboard Ppt PowerPoint Presentation Infographic Template Graphics
This is a dashboard ppt powerpoint presentation infographic template graphics. This is a four stage process. The stages in this process are marketing, management, technology, business, planning.
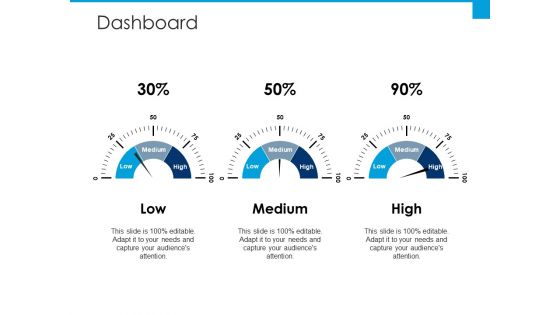
Dashboard Ppt PowerPoint Presentation File Portrait
This is a dashboard ppt powerpoint presentation file portrait. This is a three stage process. The stages in this process are business, management, marketing, strategy, planning.

Current Scenario Analysis Of Big Data Management And Analytics Streamlining Production Ppt Slide
The following slide showcases current scenario analysis of big data management to assess scope of improvement. It includes KPIs such as data accuracy, downtime reduction, etc. Make sure to capture your audiences attention in your business displays with our gratis customizable Current Scenario Analysis Of Big Data Management And Analytics Streamlining Production Ppt Slide These are great for business strategies, office conferences, capital raising or task suggestions. If you desire to acquire more customers for your tech business and ensure they stay satisfied, create your own sales presentation with these plain slides. The following slide showcases current scenario analysis of big data management to assess scope of improvement. It includes KPIs such as data accuracy, downtime reduction, etc.
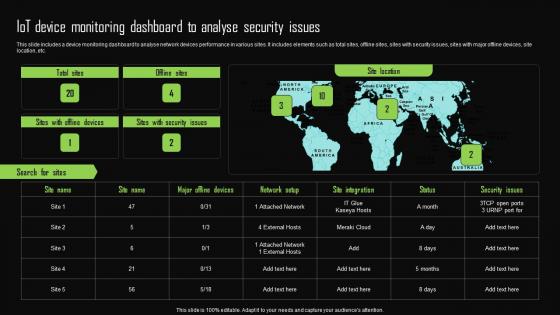
Iot Device Monitoring Dashboard To Analyse Security Issues Iot Device Management Template Pdf
This slide includes a device monitoring dashboard to analyse network devices performance in various sites. It includes elements such as total sites, offline sites, sites with security issues, sites with major offline devices, site location, etc. This Iot Device Monitoring Dashboard To Analyse Security Issues Iot Device Management Template Pdf from Slidegeeks makes it easy to present information on your topic with precision. It provides customization options, so you can make changes to the colors, design, graphics, or any other component to create a unique layout. It is also available for immediate download, so you can begin using it right away. Slidegeeks has done good research to ensure that you have everything you need to make your presentation stand out. Make a name out there for a brilliant performance. This slide includes a device monitoring dashboard to analyse network devices performance in various sites. It includes elements such as total sites, offline sites, sites with security issues, sites with major offline devices, site location, etc.

Freelance Content Marketing Dashboard With Metrics Demonstration PDF
The following slide highlights the freelance content marketing dashboard with metrics illustrating most visited content, monthly total visit, average content score. It depicts key metrics which includes content reach, unique visits, organic ranking, number of shares, rating, session time and repeat visitors. Showcasing this set of slides titled Freelance Content Marketing Dashboard With Metrics Demonstration PDF. The topics addressed in these templates are Organic Ranking, Manufacturing, Average Content Score. All the content presented in this PPT design is completely editable. Download it and make adjustments in color, background, font etc. as per your unique business setting.
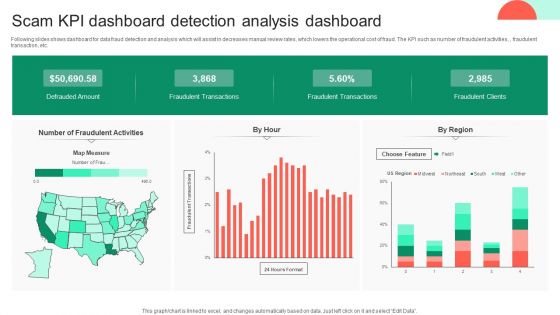
Scam KPI Dashboard Detection Analysis Dashboard Background PDF
Following slides shows dashboard for data fraud detection and analysis which will assist in decreases manual review rates, which lowers the operational cost of fraud. The KPI such as number of fraudulent activities, , fraudulent transaction, etc. Showcasing this set of slides titled Scam KPI Dashboard Detection Analysis Dashboard Background PDF. The topics addressed in these templates are Scam Kpi Dashboard, Detection Analysis Dashboard. All the content presented in this PPT design is completely editable. Download it and make adjustments in color, background, font etc. as per your unique business setting.
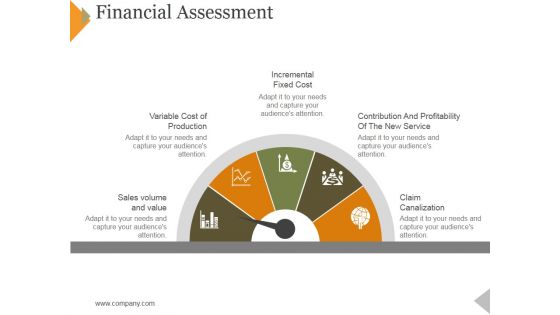
Financial Assessment Ppt PowerPoint Presentation Infographic Template Graphics Pictures
This is a financial assessment ppt powerpoint presentation infographic template graphics pictures. This is a five stage process. The stages in this process are incremental fixed cost, variable cost of production, volume and value, claim canalization.
Data Requirements For Analytics Dashboard Icon Graphics PDF
Showcasing this set of slides titled data requirements for analytics dashboard icon graphics pdf. The topics addressed in these templates are data requirements for analytics dashboard icon. All the content presented in this PPT design is completely editable. Download it and make adjustments in color, background, font etc. as per your unique business setting.
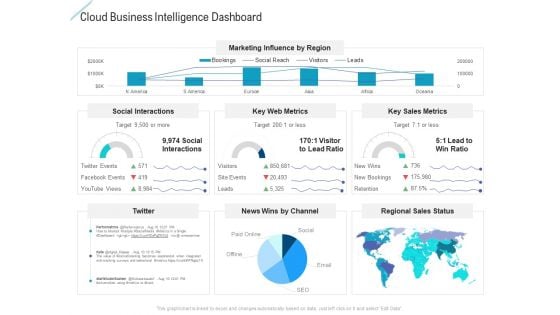
Cloud Business Intelligence Dashboard Graphics PDF
Deliver and pitch your topic in the best possible manner with this cloud business intelligence dashboard graphics pdf. Use them to share invaluable insights on social interactions, key web metrics, key sales metrics and impress your audience. This template can be altered and modified as per your expectations. So, grab it now.
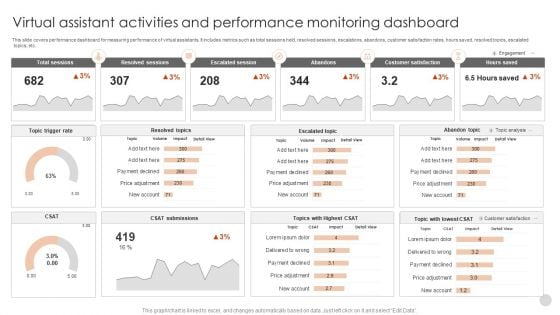
Virtual Assistant Activities And Performance Monitoring Dashboard Guidelines PDF
This slide covers performance dashboard for measuring performance of virtual assistants. It includes metrics such as total sessions held, resolved sessions, escalations, abandons, customer satisfaction rates, hours saved, resolved topics, escalated topics, etc.Pitch your topic with ease and precision using this Virtual Assistant Activities And Performance Monitoring Dashboard Guidelines PDF. This layout presents information on Total Sessions, Resolved Sessions, Escalated Session. It is also available for immediate download and adjustment. So, changes can be made in the color, design, graphics or any other component to create a unique layout.
Lead Tracking Dashboard With Metric Comparison Brochure PDF
This slide showcases dashboard of lead pipeline that can help to identify total number of leads generated and expenses incurred to acquire the audience. It also showcases other key performance metrics like lead breakdown by status and number of leads per month. Pitch your topic with ease and precision using this Lead Tracking Dashboard With Metric Comparison Brochure PDF. This layout presents information on Metric Comparison, Lead Pipeline, Lead Breakdown Status. It is also available for immediate download and adjustment. So, changes can be made in the color, design, graphics or any other component to create a unique layout.

Key Performance Indicators For Power Strategy Template Pdf
This slide shows key performance indicators for energy plan. The purpose of this slide is to highlight main key performance indicators that should be considered for performance measurement. It include indicators such as facility wide units and process unit levels, etc.Pitch your topic with ease and precision using this Key Performance Indicators For Power Strategy Template Pdf This layout presents information on Electricity Consumption, Process Measuring, Temperature Steam Systems It is also available for immediate download and adjustment. So, changes can be made in the color, design, graphics or any other component to create a unique layout. This slide shows key performance indicators for energy plan. The purpose of this slide is to highlight main key performance indicators that should be considered for performance measurement. It include indicators such as facility wide units and process unit levels, etc.
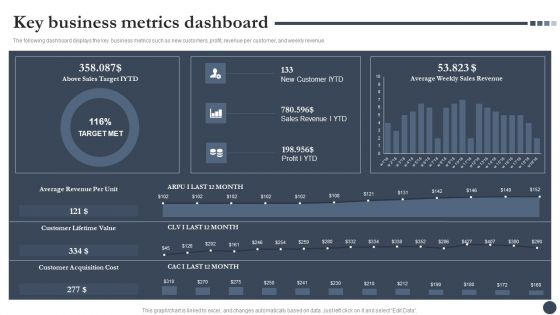
Strategic Playbook For Enterprise Administration Key Business Metrics Dashboard Pictures PDF
The following dashboard displays the key business metrics such as new customers, profit, revenue per customer, and weekly revenue. Deliver and pitch your topic in the best possible manner with this Strategic Playbook For Enterprise Administration Key Business Metrics Dashboard Pictures PDF. Use them to share invaluable insights on Average Revenue Per Unit, Customer Lifetime Value, Customer Acquisition Cost and impress your audience. This template can be altered and modified as per your expectations. So, grab it now.
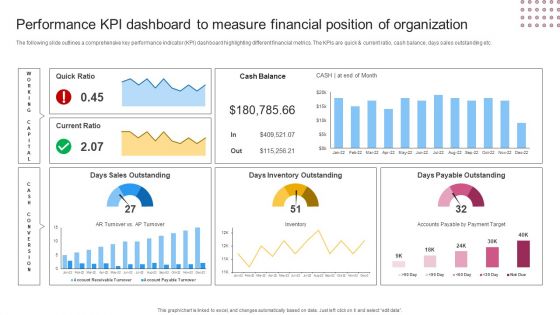
Performance KPI Dashboard To Measure Financial Position Of Organization Pictures PDF
The following slide outlines a comprehensive key performance indicator KPI dashboard highlighting different financial metrics. The KPIs are quick and current ratio, cash balance, days sales outstanding etc. Slidegeeks is here to make your presentations a breeze with Performance KPI Dashboard To Measure Financial Position Of Organization Pictures PDF With our easy to use and customizable templates, you can focus on delivering your ideas rather than worrying about formatting. With a variety of designs to choose from, you are sure to find one that suits your needs. And with animations and unique photos, illustrations, and fonts, you can make your presentation pop. So whether you are giving a sales pitch or presenting to the board, make sure to check out Slidegeeks first.
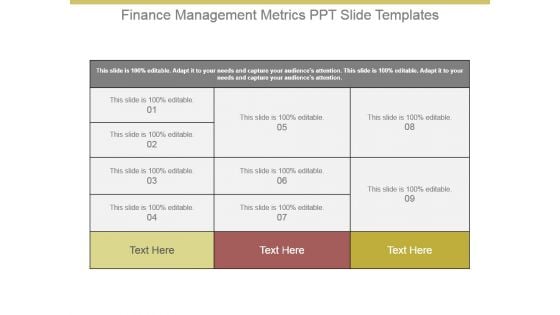
Finance Management Metrics Ppt Slide Templates
This is a finance management metrics ppt slide templates. This is a nine stage process. The stages in this process are business, marketing, management, table.
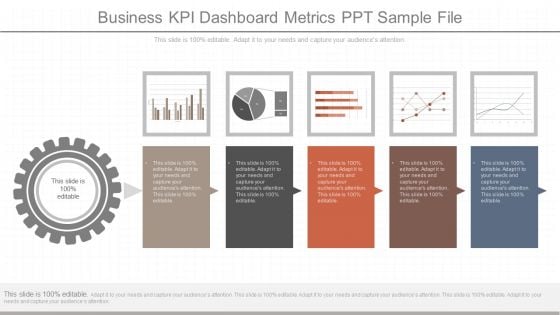
Business Kpi Dashboard Metrics Ppt Sample File
This is a business kpi dashboard metrics ppt sample file. This is a five stage process. The stages in this process are business, finance, management, success, marketing, presentation.
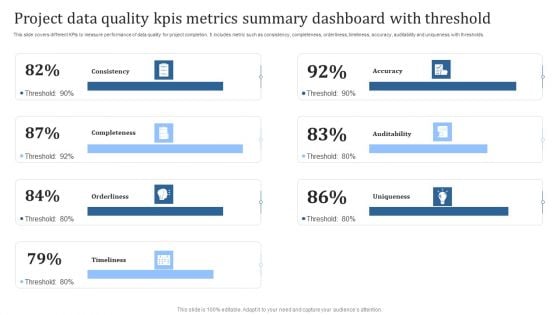
Project Data Quality Kpis Metrics Summary Dashboard With Threshold Guidelines PDF
This slide covers different KPIs to measure performance of data quality for project completion. It includes metric such as consistency, completeness, orderliness, timeliness, accuracy, auditability and uniqueness with thresholds. Pitch your topic with ease and precision using this Project Data Quality Kpis Metrics Summary Dashboard With Threshold Guidelines PDF. This layout presents information on Consistency, Completeness, Orderliness. It is also available for immediate download and adjustment. So, changes can be made in the color, design, graphics or any other component to create a unique layout.
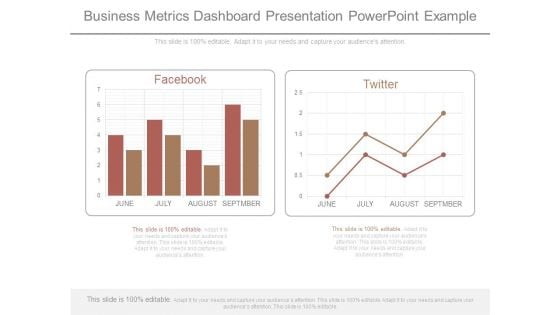
Business Metrics Dashboard Presentation Powerpoint Example
This is a business metrics dashboard presentation powerpoint example. This is a two stage process. The stages in this process are facebook, twitter.
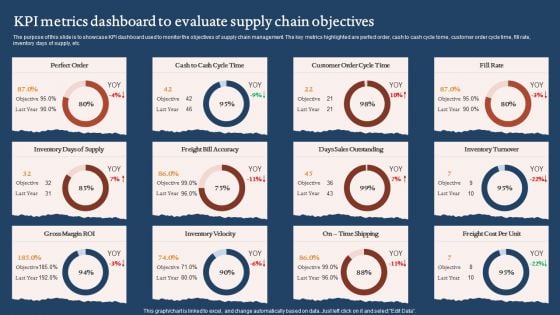
KPI Metrics Dashboard To Evaluate Supply Chain Objectives Graphics PDF
The purpose of this slide is to showcase KPI dashboard used to monitor the objectives of supply chain management. The key metrics highlighted are perfect order, cash to cash cycle tome, customer order cycle time, fill rate, inventory days of supply, etc. Pitch your topic with ease and precision using this KPI Metrics Dashboard To Evaluate Supply Chain Objectives Graphics PDF. This layout presents information on Days Sales Outstanding, Inventory Velocity, Gross Margin Roi. It is also available for immediate download and adjustment. So, changes can be made in the color, design, graphics or any other component to create a unique layout.
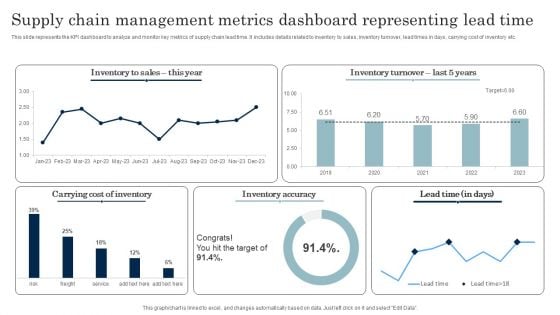
Supply Chain Management Metrics Dashboard Representing Lead Time Download PDF
This slide represents the KPI dashboard to analyze and monitor key metrics of supply chain lead time. It includes details related to inventory to sales, inventory turnover, lead times in days, carrying cost of inventory etc. Pitch your topic with ease and precision using this Supply Chain Management Metrics Dashboard Representing Lead Time Download PDF. This layout presents information on Inventory Accuracy, Carrying Cost Of Inventory. It is also available for immediate download and adjustment. So, changes can be made in the color, design, graphics or any other component to create a unique layout.
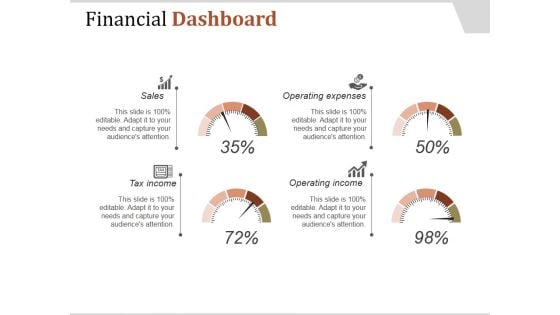
Financial Dashboard Ppt PowerPoint Presentation Influencers
This is a financial dashboard ppt powerpoint presentation influencers. This is a four stage process. The stages in this process are sales, tax income, operating income, operating expenses.

Dashboard Ppt PowerPoint Presentation Gallery Clipart Images
This is a dashboard ppt powerpoint presentation gallery clipart images. This is a three stage process. The stages in this process are low, medium, high.

Dashboard Ppt PowerPoint Presentation Model Infographic Template
This is a dashboard ppt powerpoint presentation model infographic template. This is a three stage process. The stages in this process are low, medium, high.

Dashboard Ppt PowerPoint Presentation File Layout
This is a dashboard ppt powerpoint presentation file layout. This is a three stage process. The stages in this process are low, medium, high.
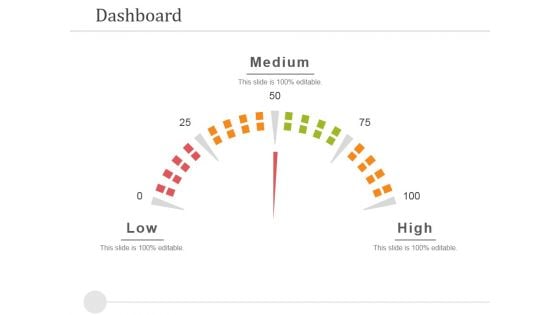
Dashboard Ppt PowerPoint Presentation Slides Good
This is a dashboard ppt powerpoint presentation slides good. This is a three stage process. The stages in this process are low, medium, high.
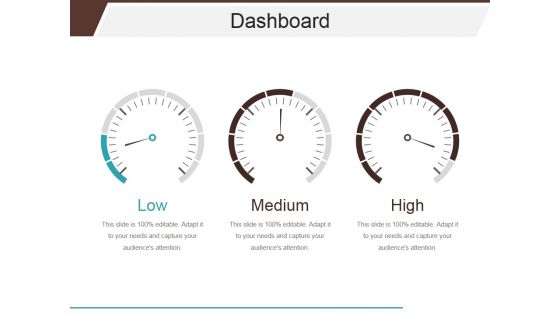
Dashboard Ppt PowerPoint Presentation Portfolio Template
This is a dashboard ppt powerpoint presentation portfolio template. This is a three stage process. The stages in this process are low, medium, high.
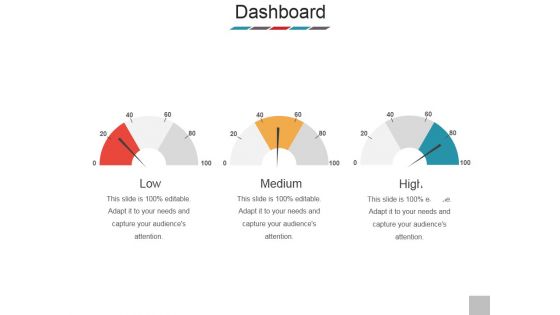
Dashboard Ppt PowerPoint Presentation Layouts Summary
This is a dashboard ppt powerpoint presentation layouts summary. This is a three stage process. The stages in this process are low, medium, high.
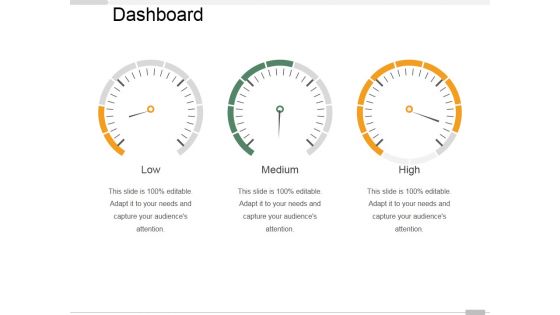
Dashboard Ppt PowerPoint Presentation Show Guidelines
This is a dashboard ppt powerpoint presentation show guidelines. This is a three stage process. The stages in this process are low, medium, high.
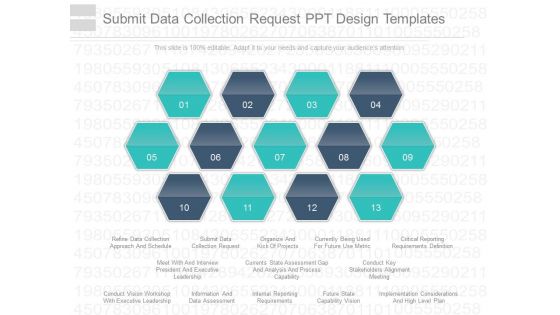
Submit Data Collection Request Ppt Design Templates
This is a submit data collection request ppt design templates. This is a thirteen stage process. The stages in this process are refine data collection approach and schedule, submit data collection request, organize and kick of projects, currently being used for future use metric, critical reporting requirements definition, meet with and interview president and executive leadership, currents state assessment gap and analysis and process capability, conduct key stakeholders alignment meeting, conduct vision workshop with executive leadership, information and data assessment, internal reporting requirements, future state capability vision, implementation considerations and high level plan.
Dashboard Measuring Ppt PowerPoint Presentation Ideas Icons
Presenting this set of slides with name dashboard measuring ppt powerpoint presentation ideas icons. This is a three stage process. The stages in this process are dashboard, low, high, management, business. This is a completely editable PowerPoint presentation and is available for immediate download. Download now and impress your audience.
Cybersecurity Key Performance Indicator And Padlock Icon Clipart Pdf
Showcasing this set of slides titled Cybersecurity Key Performance Indicator And Padlock Icon Clipart Pdf The topics addressed in these templates are Cybersecurity Key, Performance Indicator, Padlock Icon All the content presented in this PPT design is completely editable. Download it and make adjustments in color, background, font etc. as per your unique business setting. Our Cybersecurity Key Performance Indicator And Padlock Icon Clipart Pdf are topically designed to provide an attractive backdrop to any subject. Use them to look like a presentation pro.
Human Resource Analytics Key Performance Indicator Icon Elements Pdf
Showcasing this set of slides titled Human Resource Analytics Key Performance Indicator Icon Elements Pdf The topics addressed in these templates are Human Resource, Analytics Key Performance, Indicator Icon All the content presented in this PPT design is completely editable. Download it and make adjustments in color, background, font etc. as per your unique business setting. Our Human Resource Analytics Key Performance Indicator Icon Elements Pdf are topically designed to provide an attractive backdrop to any subject. Use them to look like a presentation pro.

Marketers Guide To Data Analysis Optimization Social Media Analytics KPI Dashboard Clipart PDF
This slide covers a dashboard for tracking social media KPIs such as face engagements, total likes, followers, audience growth, YouTube subscribers, views, Instagram reach and , likes, LinkedIn impressions, etc. Find a pre designed and impeccable Marketers Guide To Data Analysis Optimization Social Media Analytics KPI Dashboard Clipart PDF. The templates can ace your presentation without additional effort. You can download these easy to edit presentation templates to make your presentation stand out from others. So, what are you waiting for Download the template from Slidegeeks today and give a unique touch to your presentation.
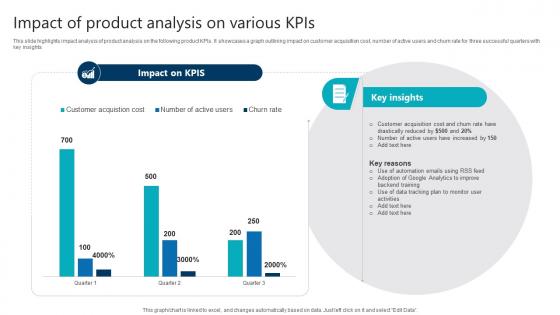
Impact Of Product Analysis On Various Kpis Product Analytics Implementation Data Analytics V
This slide highlights impact analysis of product analysis on the following product KPIs. It showcases a graph outlining impact on customer acquisition cost, number of active users and churn rate for three successful quarters with key insights Are you searching for a Impact Of Product Analysis On Various Kpis Product Analytics Implementation Data Analytics V that is uncluttered, straightforward, and original Its easy to edit, and you can change the colors to suit your personal or business branding. For a presentation that expresses how much effort you have put in, this template is ideal With all of its features, including tables, diagrams, statistics, and lists, its perfect for a business plan presentation. Make your ideas more appealing with these professional slides. Download Impact Of Product Analysis On Various Kpis Product Analytics Implementation Data Analytics V from Slidegeeks today. This slide highlights impact analysis of product analysis on the following product KPIs. It showcases a graph outlining impact on customer acquisition cost, number of active users and churn rate for three successful quarters with key insights
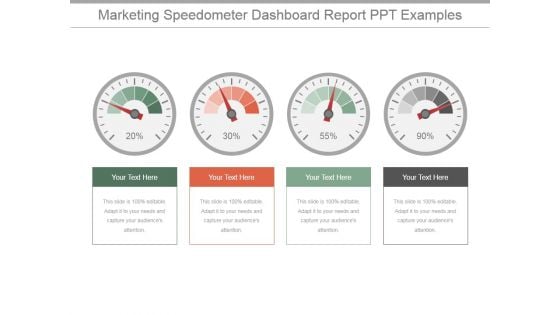
Marketing Speedometer Dashboard Report Ppt PowerPoint Presentation Designs Download
This is a marketing speedometer dashboard report ppt powerpoint presentation designs download. This is a four stage process. The stages in this process are dashboard, measurement, percentage, business, finance.
Performance Dashboard Template 1 Ppt PowerPoint Presentation Icon Design Templates
This is a performance dashboard template 1 ppt powerpoint presentation icon design templates. This is a one stage process. The stages in this dashboard, planning, management, strategy, marketing, business.
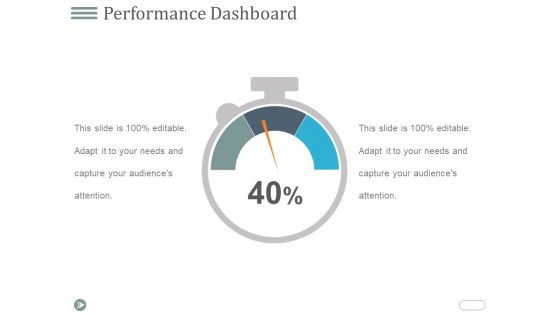
Performance Dashboard Ppt PowerPoint Presentation Visual Aids Example 2015
This is a performance dashboard ppt powerpoint presentation visual aids example 2015. This is a one stage process. The stages in this process are dashboard, percentage, business, marketing, strategy.
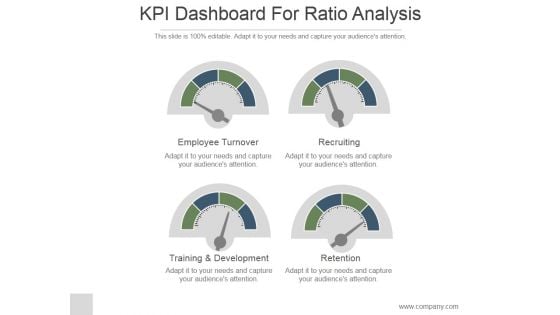
KPI Dashboard For Ratio Analysis Ppt PowerPoint Presentation Show
This is a kpi dashboard for ratio analysis ppt powerpoint presentation show. This is a four stage process. The stages in this process are business, strategy, marketing, dashboard, management, analysis.
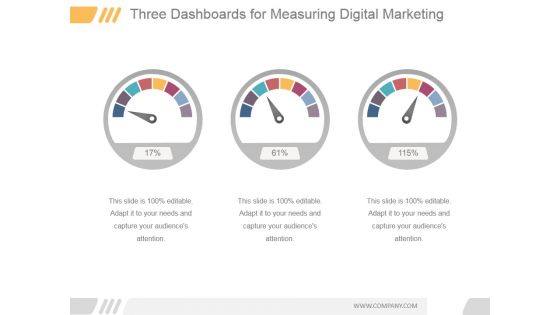
Three Dashboards For Measuring Digital Marketing Ppt PowerPoint Presentation Slide
This is a three dashboards for measuring digital marketing ppt powerpoint presentation slide. This is a three stage process. The stages in this process are dashboard, measuring, business, marketing, percentage.
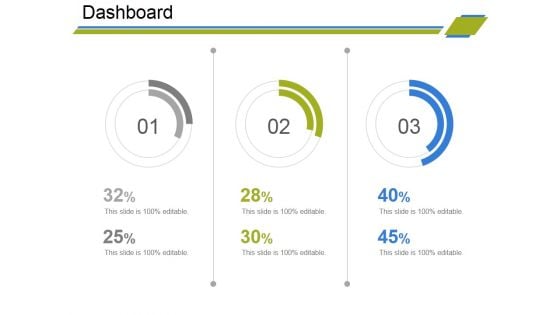
Dashboard Ppt PowerPoint Presentation Infographic Template Graphics Template
This is a dashboard ppt powerpoint presentation infographic template graphics template. This is a three stage process. The stages in this process are dashboard, measurement, marketing, analysis, business, strategy.
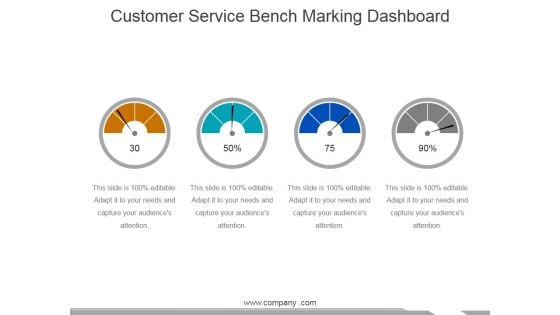
Customer Service Bench Marking Dashboard Ppt PowerPoint Presentation Summary Format
This is a customer service bench marking dashboard ppt powerpoint presentation summary format. This is a four stage process. The stages in this process are business, marketing, dashboard, management.
Performance Dashboard Template 1 Ppt PowerPoint Presentation Icon Guidelines
This is a performance dashboard template 1 ppt powerpoint presentation icon guidelines. This is a one stage process. The stages in this process are performance dashboard, business, marketing, management.

Performance Dashboard Template 1 Ppt PowerPoint Presentation Model Topics
This is a performance dashboard template 1 ppt powerpoint presentation model topics. This is a three stage process. The stages in this process are dashboard, marketing, analysis, measurement, business.
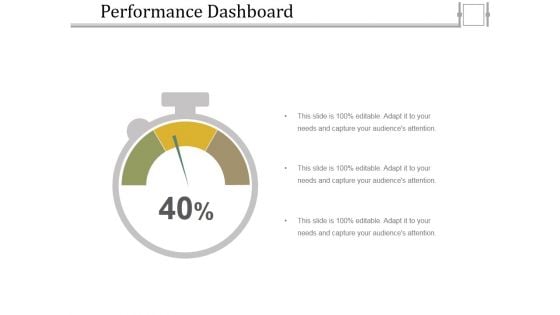
Performance Dashboard Template 2 Ppt PowerPoint Presentation Slides Graphics
This is a performance dashboard template 2 ppt powerpoint presentation slides graphics. This is a one stage process. The stages in this process are dashboard, marketing, analysis, measurement, business.
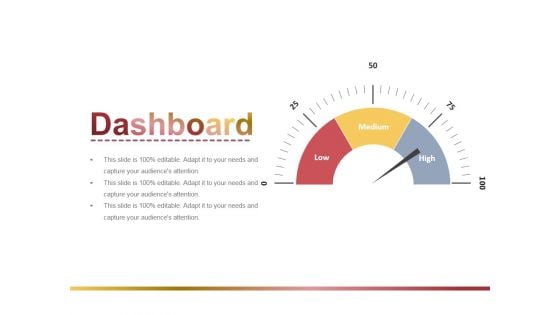
Dashboard Ppt PowerPoint Presentation Infographic Template Graphics Design
This is a dashboard ppt powerpoint presentation infographic template graphics design. This is a three stage process. The stages in this process are business, strategy, marketing, analysis, finance, dashboard.
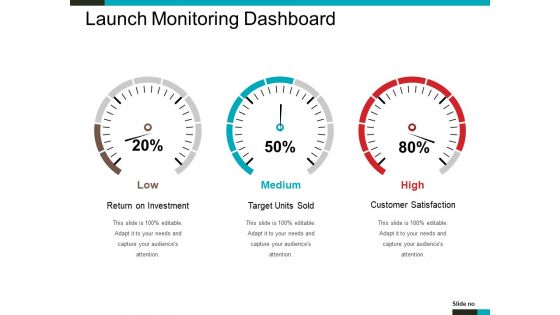
Launch Monitoring Dashboard Ppt PowerPoint Presentation Gallery Files
This is a launch monitoring dashboard ppt powerpoint presentation gallery files. This is a three stage process. The stages in this process are low, medium, high, dashboard, business, percentage.
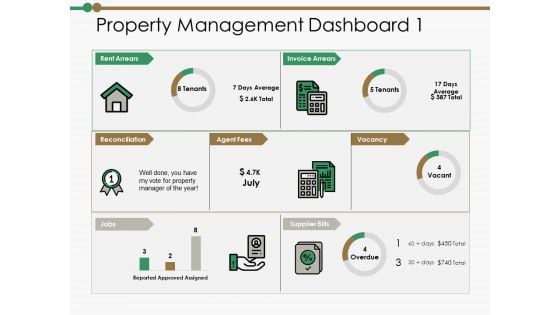
Property Management Dashboard Reconciliation Ppt PowerPoint Presentation Portfolio Graphics Example
This is a property management dashboard reconciliation ppt powerpoint presentation portfolio graphics example. This is a two stage process. The stages in this process are dashboard, management, marketing, business.
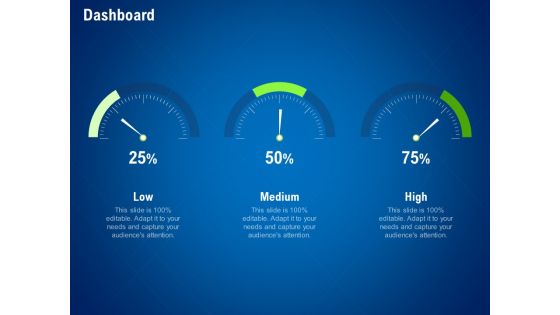
strategies distinguish nearest business rivals dashboard ppt infographic template smartart pdf
Presenting strategies distinguish nearest business rivals dashboard ppt infographic template smartart pdf to provide visual cues and insights. Share and navigate important information on three stages that need your due attention. This template can be used to pitch topics like low, medium, high. In addition, this PPT design contains high-resolution images, graphics, etc, that are easily editable and available for immediate download.
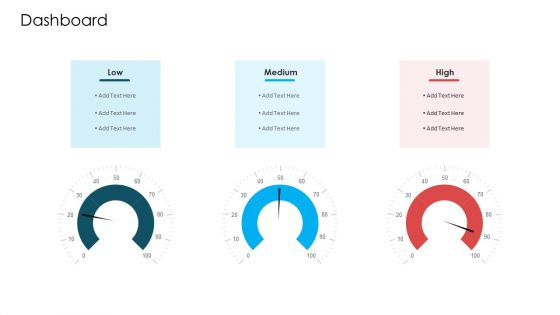
COVID 19 Business Survive Adapt Post Recovery Strategy Online Industry Dashboard Information PDF
Presenting covid 19 business survive adapt post recovery strategy online industry dashboard information pdf to provide visual cues and insights. Share and navigate important information on three stages that need your due attention. This template can be used to pitch topics like low, medium, high. In addition, this PPT design contains high-resolution images, graphics, etc, that are easily editable and available for immediate download.
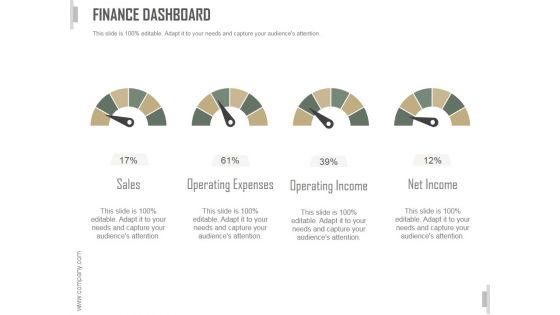
Finance Dashboard Ppt PowerPoint Presentation Clipart
This is a finance dashboard ppt powerpoint presentation clipart. This is a four stage process. The stages in this process are sales, operating expenses, operating income, net income.


 Continue with Email

 Home
Home


