Snapshot
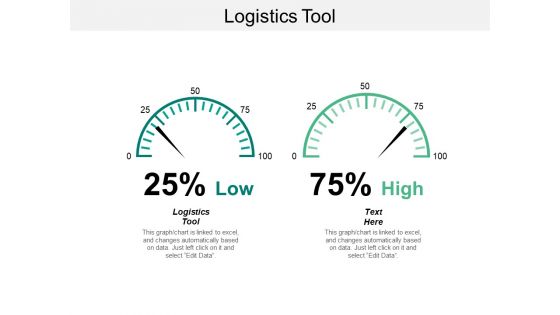
Logistics Tool Ppt Powerpoint Presentation Ideas Show Cpb
This is a logistics tool ppt powerpoint presentation ideas show cpb. This is a two stage process. The stages in this process are logistics tool.
Project Profit Analysis Vector Icon Ppt PowerPoint Presentation Outline Graphics Template PDF
Presenting this set of slides with name project profit analysis vector icon ppt powerpoint presentation outline graphics template pdf. This is a three stage process. The stages in this process are project profit analysis vector icon. This is a completely editable PowerPoint presentation and is available for immediate download. Download now and impress your audience.
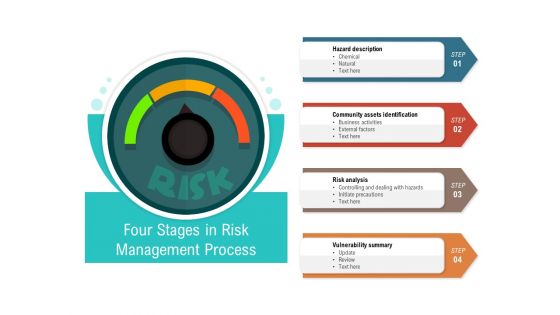
Four Stages In Risk Management Process Ppt PowerPoint Presentation Professional Grid PDF
Persuade your audience using this four stages in risk management process ppt powerpoint presentation professional grid pdf. This PPT design covers four stages, thus making it a great tool to use. It also caters to a variety of topics including hazard description, community assets identification, risk analysis, vulnerability summary. Download this PPT design now to present a convincing pitch that not only emphasizes the topic but also showcases your presentation skills.
Company Website Trust Meter Vector Icon Ppt PowerPoint Presentation Infographics Example PDF
Persuade your audience using this company website trust meter vector icon ppt powerpoint presentation infographics example pdf. This PPT design covers two stages, thus making it a great tool to use. It also caters to a variety of topics including company website trust meter vector icon. Download this PPT design now to present a convincing pitch that not only emphasizes the topic but also showcases your presentation skills.
Customer Relationship Management Vector Icon Ppt PowerPoint Presentation Portfolio Rules PDF
Presenting customer relationship management vector icon ppt powerpoint presentation portfolio rules pdf to dispense important information. This template comprises three stages. It also presents valuable insights into the topics including customer relationship management vector icon. This is a completely customizable PowerPoint theme that can be put to use immediately. So, download it and address the topic impactfully.
Employee Trust Meter Vector Icon Ppt PowerPoint Presentation Infographics Good PDF
Persuade your audience using this employee trust meter vector icon ppt powerpoint presentation infographics good pdf. This PPT design covers three stages, thus making it a great tool to use. It also caters to a variety of topics including employee trust meter vector icon. Download this PPT design now to present a convincing pitch that not only emphasizes the topic but also showcases your presentation skills.
Like Symbol With Meter Vector Icon Ppt PowerPoint Presentation Infographics Rules PDF
Presenting like symbol with meter vector icon ppt powerpoint presentation infographics rules pdf to dispense important information. This template comprises one stages. It also presents valuable insights into the topics including like symbol with meter vector icon. This is a completely customizable PowerPoint theme that can be put to use immediately. So, download it and address the topic impactfully.
Security Shield And Meter Vector Icon Ppt PowerPoint Presentation Styles Summary PDF
Persuade your audience using this security shield and meter vector icon ppt powerpoint presentation styles summary pdf. This PPT design covers three stages, thus making it a great tool to use. It also caters to a variety of topics including security shield and meter vector icon. Download this PPT design now to present a convincing pitch that not only emphasizes the topic but also showcases your presentation skills.
Fuel Meter Vector Icon Ppt PowerPoint Presentation Professional Examples PDF
Persuade your audience using this fuel meter vector icon ppt powerpoint presentation professional examples pdf. This PPT design covers four stages, thus making it a great tool to use. It also caters to a variety of topics including fuel meter vector icon. Download this PPT design now to present a convincing pitch that not only emphasizes the topic but also showcases your presentation skills.
Vector Illustration Of Fuel Gauge Icon Ppt PowerPoint Presentation Layouts Graphics Design PDF
Presenting vector illustration of fuel gauge icon ppt powerpoint presentation layouts graphics design pdf to dispense important information. This template comprises three stages. It also presents valuable insights into the topics including vector illustration of fuel gauge icon. This is a completely customizable PowerPoint theme that can be put to use immediately. So, download it and address the topic impactfully.
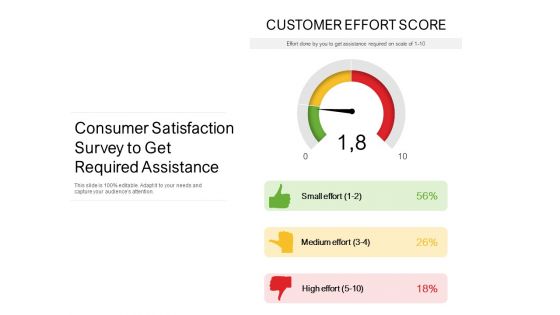
Consumer Satisfaction Survey To Get Required Assistance Ppt PowerPoint Presentation Gallery Elements PDF
Presenting consumer satisfaction survey to get required assistance ppt powerpoint presentation gallery elements pdf to dispense important information. This template comprises three stages. It also presents valuable insights into the topics including small effort, medium effort, high effort. This is a completely customizable PowerPoint theme that can be put to use immediately. So, download it and address the topic impactfully.
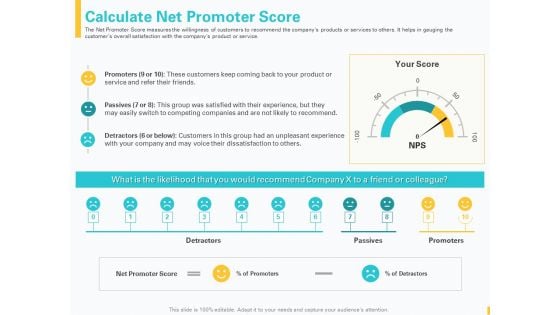
Designing Great Client Experience Action Plan Calculate Net Promoter Score Ppt Gallery Ideas PDF
The Net Promoter Score measures the willingness of customers to recommend the companys products or services to others. It helps in gauging the customers overall satisfaction with the companys product or service. This is a designing great client experience action plan calculate net promoter score ppt gallery ideas pdf template with various stages. Focus and dispense information on one stages using this creative set, that comes with editable features. It contains large content boxes to add your information on topics like promoters, passives, detractors, customers, net promoter score. You can also showcase facts, figures, and other relevant content using this PPT layout. Grab it now.
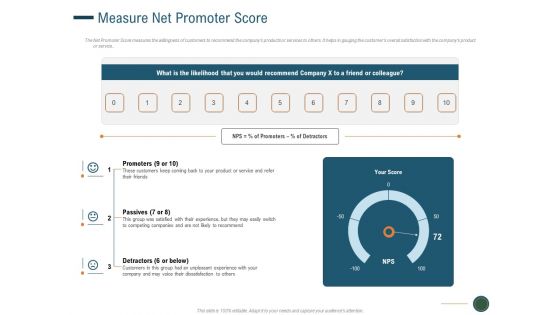
Enhance Profit Client Journey Analysis Measure Net Promoter Score Clipart PDF
The Net Promoter Score measures the willingness of customers to recommend the companys products or services to others. It helps in gauging the customers overall satisfaction with the companys product or service. This is a enhance profit client journey analysis measure net promoter score clipart pdf template with various stages. Focus and dispense information on three stages using this creative set, that comes with editable features. It contains large content boxes to add your information on topics like promoters, passives, detractors. You can also showcase facts, figures, and other relevant content using this PPT layout. Grab it now.
Enterprise Analysis Customer Satisfaction Ppt Icon Backgrounds PDF
This is a enterprise analysis customer satisfaction ppt icon backgrounds pdf template with various stages. Focus and dispense information on three stages using this creative set, that comes with editable features. It contains large content boxes to add your information on topics like overall satisfaction with service, satisfaction with value for money, overall satisfaction with relationship. You can also showcase facts, figures, and other relevant content using this PPT layout. Grab it now.
Deal Assessment Audit Process Customer Satisfaction Icons PDF
Presenting deal assessment audit process customer satisfaction icons pdf to provide visual cues and insights. Share and navigate important information on three stages that need your due attention. This template can be used to pitch topics like overall satisfaction with service, satisfaction with value for money, overall satisfaction with relationship. In addition, this PPT design contains high-resolution images, graphics, etc, that are easily editable and available for immediate download.
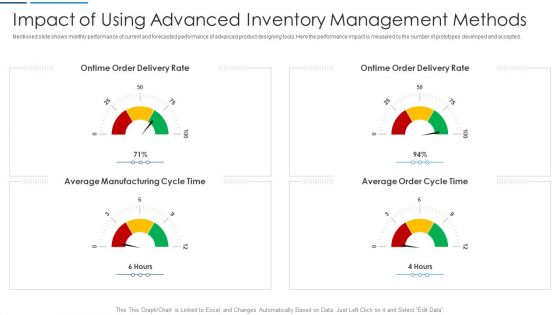
Information Technology Transformation Impact Of Using Advanced Inventory Management Methods Time Guidelines PDF
Mentioned slide shows monthly performance of current and forecasted performance of advanced product designing tools. Here the performance impact is measured by the number of prototypes developed and accepted. This is a information technology transformation impact of using advanced inventory management methods time guidelines pdf template with various stages. Focus and dispense information on four stages using this creative set, that comes with editable features. It contains large content boxes to add your information on topics like average manufacturing cycle, average order cycle time, inventory management. You can also showcase facts, figures, and other relevant content using this PPT layout. Grab it now.
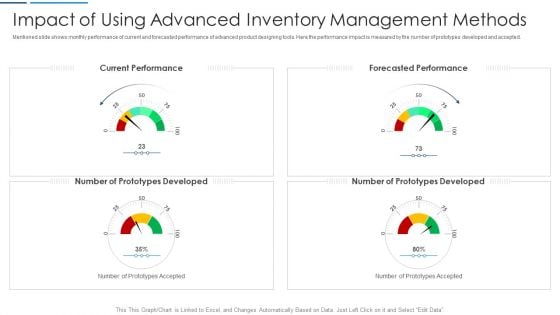
Information Technology Transformation Impact Of Using Advanced Inventory Management Methods Background PDF
Mentioned slide shows monthly performance of current and forecasted performance of advanced product designing tools. Here the performance impact is measured by the number of prototypes developed and accepted. Presenting information technology transformation impact of using advanced inventory management methods background pdf to provide visual cues and insights. Share and navigate important information on four stages that need your due attention. This template can be used to pitch topics like current performance, forecasted performance, developed. In addtion, this PPT design contains high resolution images, graphics, etc, that are easily editable and available for immediate download.
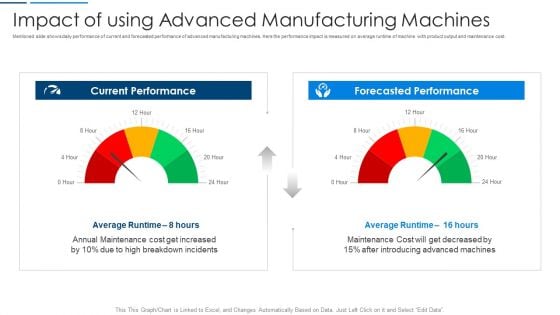
Information Technology Transformation Impact Of Using Advanced Manufacturing Machines Diagrams PDF
Mentioned slide shows daily performance of current and forecasted performance of advanced manufacturing machines. Here the performance impact is measured on average runtime of machine with product output and maintenance cost. This is a information technology transformation impact of using advanced manufacturing machines diagrams pdf template with various stages. Focus and dispense information on two stages using this creative set, that comes with editable features. It contains large content boxes to add your information on topics like forecasted performance, current performance, maintenance cost. You can also showcase facts, figures, and other relevant content using this PPT layout. Grab it now.
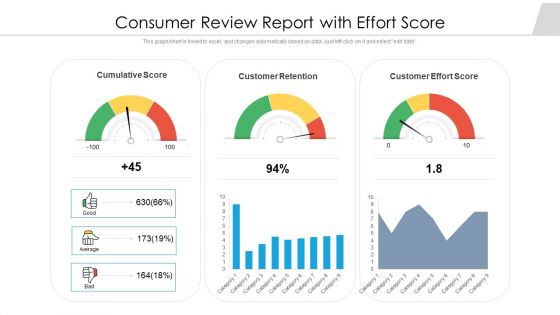
Consumer Review Report With Effort Score Ppt Layouts Graphics Tutorials PDF
Presenting consumer review report with effort score ppt layouts graphics tutorials pdf to dispense important information. This template comprises three stages. It also presents valuable insights into the topics including customer effort score, customer retention, cumulative score. This is a completely customizable PowerPoint theme that can be put to use immediately. So, download it and address the topic impactfully.
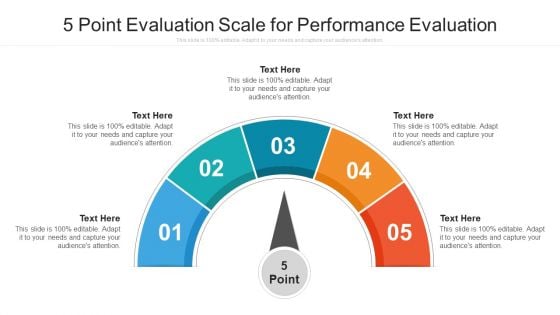
5 Point Evaluation Scale For Performance Evaluation Ppt PowerPoint Presentation File Graphics Template PDF
Presenting 5 point evaluation scale for performance evaluation ppt powerpoint presentation file graphics template pdf to dispense important information. This template comprises five stages. It also presents valuable insights into the topics including 5 point evaluation scale for performance evaluation. This is a completely customizable PowerPoint theme that can be put to use immediately. So, download it and address the topic impactfully.
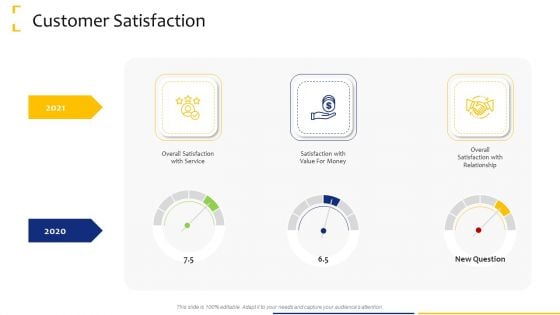
Tactical Analysis Customer Satisfaction Ppt Gallery Graphics Template PDF
This is a tactical analysis customer satisfaction ppt gallery graphics template pdf template with various stages. Focus and dispense information on three stages using this creative set, that comes with editable features. It contains large content boxes to add your information on topics like customer satisfaction. You can also showcase facts, figures, and other relevant content using this PPT layout. Grab it now.
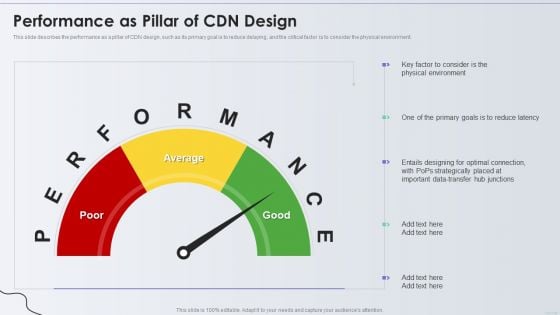
Distribution Network Performance As Pillar Of CDN Design Introduction PDF
This slide describes the performance as a pillar of CDN design, such as its primary goal is to reduce delaying, and the critical factor is to consider the physical environment. Presenting Distribution Network Performance As Pillar Of CDN Design Introduction PDF to provide visual cues and insights. Share and navigate important information on five stages that need your due attention. This template can be used to pitch topics like Strategically, Goals, Physical Environment. In addtion, this PPT design contains high resolution images, graphics, etc, that are easily editable and available for immediate download.
Disaster Threat Severity Assessment Icon Ppt Show Slides PDF
Persuade your audience using this Disaster Threat Severity Assessment Icon Ppt Show Slides PDF. This PPT design covers four stages, thus making it a great tool to use. It also caters to a variety of topics including Disaster Threat, Severity Assessment, Icon. Download this PPT design now to present a convincing pitch that not only emphasizes the topic but also showcases your presentation skills.
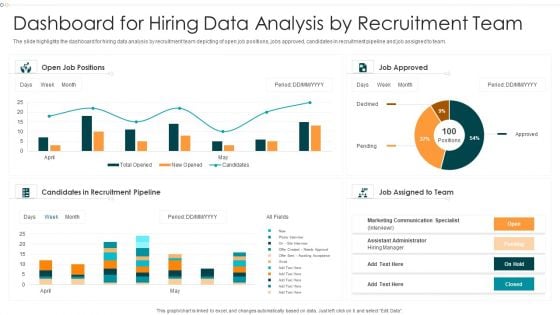
Dashboard For Hiring Data Analysis By Recruitment Team Formats PDF
The slide highlights the dashboard for hiring data analysis by recruitment team depicting of open job positions, jobs approved, candidates in recruitment pipeline and job assigned to team.Pitch your topic with ease and precision using this Dashboard For Hiring Data Analysis By Recruitment Team Formats PDF This layout presents information on Candidates Recruitment, Marketing Communication, Approved It is also available for immediate download and adjustment. So, changes can be made in the color, design, graphics or any other component to create a unique layout.
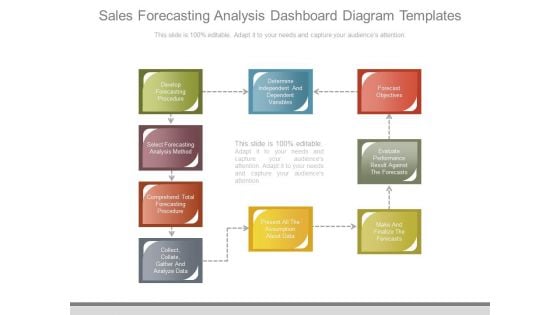
Sales Forecasting Analysis Dashboard Diagram Templates
This is a sales forecasting analysis dashboard diagram templates. This is a nine stage process. The stages in this process are develop forecasting procedure, select forecasting analysis method, comprehend total forecasting procedure, collect collate gather and analyze data, determine independent and dependent variables, present all the assumption about data, forecast objectives, evaluate performance result against the forecasts, make and finalize the forecasts.
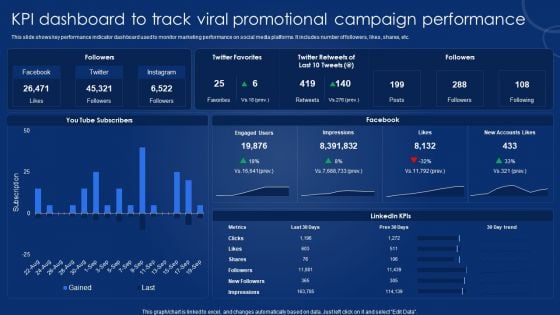
KPI Dashboard To Track Viral Promotional Campaign Performance Icons PDF
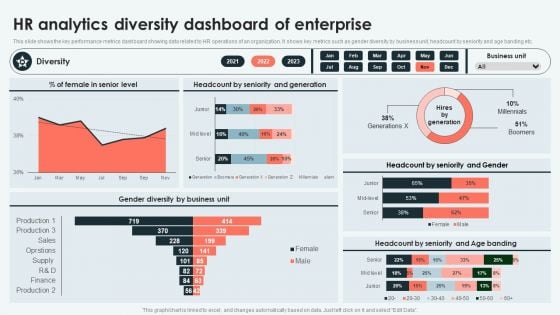
Analyzing And Deploying HR Analytics Diversity Dashboard Of Enterprise Inspiration PDF
This slide shows the key performance metrics dashboard showing data related to HR operations of an organization. It shows key metrics such as gender diversity by business unit, headcount by seniority and age banding etc. Want to ace your presentation in front of a live audience Our Analyzing And Deploying HR Analytics Diversity Dashboard Of Enterprise Inspiration PDF can help you do that by engaging all the users towards you. Slidegeeks experts have put their efforts and expertise into creating these impeccable powerpoint presentations so that you can communicate your ideas clearly. Moreover, all the templates are customizable, and easy-to-edit and downloadable. Use these for both personal and commercial use.
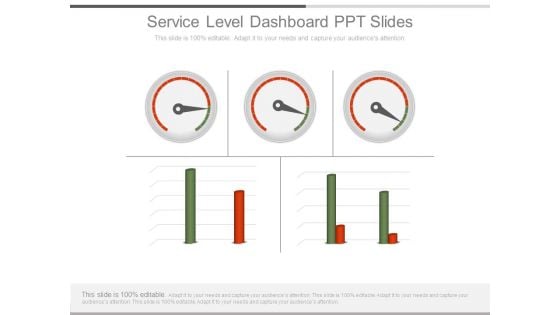
Service Level Dashboard Ppt Slides
This is a service level dashboard ppt slides. This is a three stage process. The stages in this process are dashboard, graph, growth.
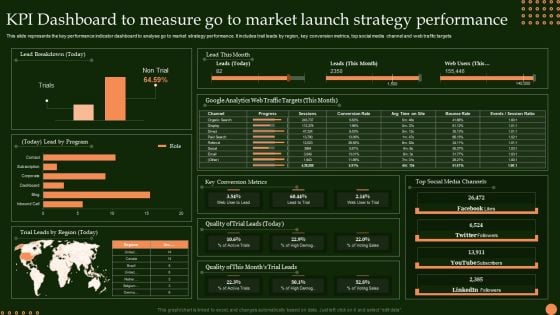
KPI Dashboard To Measure Go To Market Launch Strategy Performance Sample PDF
This slide represents the key performance indicator dashboard to analyse go to market strategy performance. It includes trail leads by region, key conversion metrics, top social media channel and web traffic targets Pitch your topic with ease and precision using this KPI Dashboard To Measure Go To Market Launch Strategy Performance Sample PDF. This layout presents information on Lead Breakdown, Lead By Program, Trial Leads Region. It is also available for immediate download and adjustment. So, changes can be made in the color, design, graphics or any other component to create a unique layout.
Development And Operations KPI Dashboard IT Devops Performance KPI Dashboard Icons PDF
This template covers DevOps assessment key performance indicators such as activity by application, storefront users, revenue by hours etc. Deliver an awe inspiring pitch with this creative development and operations kpi dashboard it devops performance kpi dashboard icons pdf bundle. Topics like revenue, service can be discussed with this completely editable template. It is available for immediate download depending on the needs and requirements of the user.
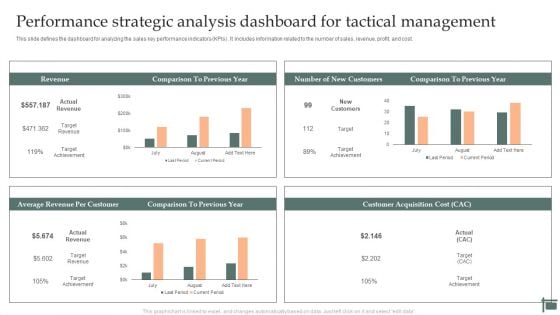
Performance Strategic Analysis Dashboard For Tactical Management Rules PDF
This slide defines the dashboard for analyzing the sales key performance indicators KPIs. It includes information related to the number of sales, revenue, profit, and cost. Showcasing this set of slides titled Performance Strategic Analysis Dashboard For Tactical Management Rules PDF. The topics addressed in these templates are Revenue, New Customers, Average Revenue, Per Customer. All the content presented in this PPT design is completely editable. Download it and make adjustments in color, background, font etc. as per your unique business setting.
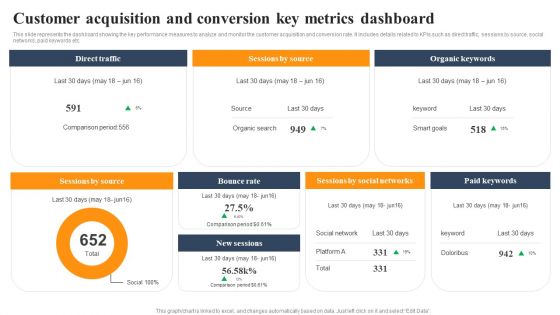
Implementing An Effective Ecommerce Management Framework Customer Acquisition And Conversion Key Metrics Dashboard Information PDF
Do you have to make sure that everyone on your team knows about any specific topic I yes, then you should give Implementing An Effective Ecommerce Management This slide represents the dashboard showing the key performance measures to analyze and monitor the customer acquisition and conversion rate. It includes details related to KPIs such as direct traffic, sessions by source, social networks, paid keywords etc. Framework Customer Acquisition And Conversion Key Metrics Dashboard Information PDF a try. Our experts have put a lot of knowledge and effort into creating this impeccable Implementing An Effective Ecommerce Management Framework Customer Acquisition And Conversion Key Metrics Dashboard Information PDF. You can use this template for your upcoming presentations, as the slides are perfect to represent even the tiniest detail. You can download these templates from the Slidegeeks website and these are easy to edit. So grab these today
Sports Team And Brand Engagement Tracking Dashboard In Depth Campaigning Guide Diagrams PDF
This slide showcases major impact of sports marketing strategies on overall stakeholder engagement. It provides details about repeated store visit, brand awareness, brand recall, employee engagement, sports sponsorship, etc. Slidegeeks is here to make your presentations a breeze with Sports Team And Brand Engagement Tracking Dashboard In Depth Campaigning Guide Diagrams PDF With our easy-to-use and customizable templates, you can focus on delivering your ideas rather than worrying about formatting. With a variety of designs to choose from, you are sure to find one that suits your needs. And with animations and unique photos, illustrations, and fonts, you can make your presentation pop. So whether you are giving a sales pitch or presenting to the board, make sure to check out Slidegeeks first This slide showcases major impact of sports marketing strategies on overall stakeholder engagement. It provides details about repeated store visit, brand awareness, brand recall, employee engagement, sports sponsorship, etc.

Dashboards Track Effectiveness Administering Diversity And Inclusion At Workplace Themes Pdf
The performance tracker includes health and safety measures which are incidence rate, critical incidence, type of incidence, consequences of injuries etc. Slidegeeks is here to make your presentations a breeze with Dashboards Track Effectiveness Administering Diversity And Inclusion At Workplace Themes Pdf With our easy to use and customizable templates, you can focus on delivering your ideas rather than worrying about formatting. With a variety of designs to choose from, you are sure to find one that suits your needs. And with animations and unique photos, illustrations, and fonts, you can make your presentation pop. So whether you are giving a sales pitch or presenting to the board, make sure to check out Slidegeeks first The performance tracker includes health and safety measures which are incidence rate, critical incidence, type of incidence, consequences of injuries etc.
Finance Metrics Dashboard Illustrating Account Payables Icons PDF
This graph or chart is linked to excel, and changes automatically based on data. Just left click on it and select edit data. Pitch your topic with ease and precision using this Total Income Budget, Total Expenses Balance, Net Profit Quick, Ratio Current Ratio. This layout presents information on Account Payable Age, Average Creditor Days, Cash On Hand. It is also available for immediate download and adjustment. So, changes can be made in the color, design, graphics or any other component to create a unique layout.
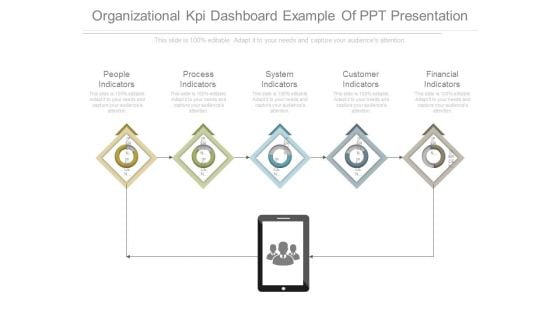
Organizational Kpi Dashboard Example Of Ppt Presentation
This is a organizational kpi dashboard example of ppt presentation. This is a five stage process. The stages in this process are people indicators, process indicators, system indicators, customer indicators, financial indicators.
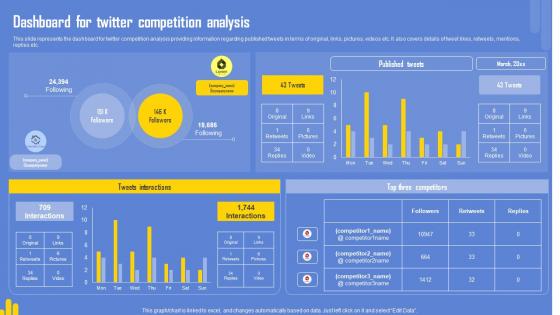
Optimizing Twitter For Online Dashboard For Twitter Competition Analysis Professional Pdf
This slide represents the dashboard for twitter competition analysis providing information regarding published tweets in terms of original, links, pictures, videos etc. It also covers details of tweet likes, retweets, mentions, replies etc. From laying roadmaps to briefing everything in detail, our templates are perfect for you. You can set the stage with your presentation slides. All you have to do is download these easy-to-edit and customizable templates. Optimizing Twitter For Online Dashboard For Twitter Competition Analysis Professional Pdf will help you deliver an outstanding performance that everyone would remember and praise you for. Do download this presentation today. This slide represents the dashboard for twitter competition analysis providing information regarding published tweets in terms of original, links, pictures, videos etc. It also covers details of tweet likes, retweets, mentions, replies etc.
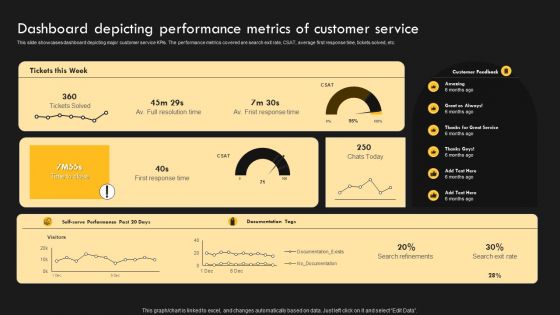
Service Improvement Techniques For Client Retention Dashboard Depicting Performance Metrics Diagrams PDF
This slide provides an overview of customer feedback survey conducted to evaluate their satisfaction level. It includes description, steps and benefits which are measure customer satisfaction This modern and well arranged Service Improvement Techniques For Client Retention Dashboard Depicting Performance Metrics Diagrams PDF provides lots of creative possibilities. It is very simple to customize and edit with the Powerpoint Software. Just drag and drop your pictures into the shapes. All facets of this template can be edited with Powerpoint no extra software is necessary. Add your own material, put your images in the places assigned for them, adjust the colors, and then you can show your slides to the world, with an animated slide included.
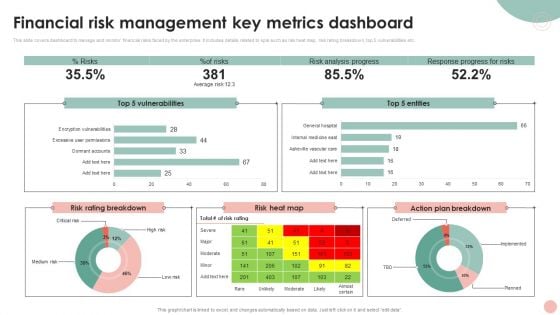
Company Risk Assessment Plan Financial Risk Management Key Metrics Dashboard Brochure PDF
This slide covers dashboard to manage and monitor financial risks faced by the enterprise. It includes details related to kpis such as risk heat map, risk rating breakdown, top 5 vulnerabilities etc. Crafting an eye catching presentation has never been more straightforward. Let your presentation shine with this tasteful yet straight forward Company Risk Assessment Plan Financial Risk Management Key Metrics Dashboard Brochure PDF template. It offers a minimalistic and classy look that is great for making a statement. The colors have been employed intelligently to add a bit of playfulness while still remaining professional. Construct the ideal Company Risk Assessment Plan Financial Risk Management Key Metrics Dashboard Brochure PDF that effortlessly grabs the attention of your audience. Begin now and be certain to wow your customers.
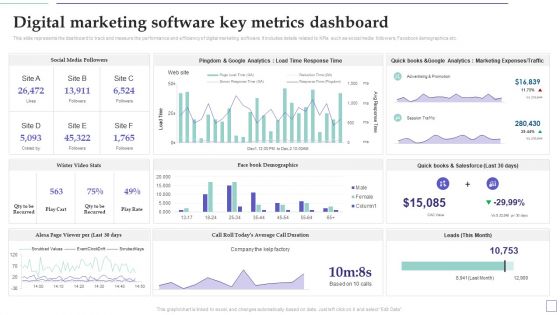
System Deployment Project Digital Marketing Software Key Metrics Dashboard Graphics PDF
This slide represents the dashboard to track and measure the performance and efficiency of digital marketing software. It includes details related to KPIs such as social media followers, Facebook demographics etc. If you are looking for a format to display your unique thoughts, then the professionally designed System Deployment Project Digital Marketing Software Key Metrics Dashboard Graphics PDF is the one for you. You can use it as a Google Slides template or a PowerPoint template. Incorporate impressive visuals, symbols, images, and other charts. Modify or reorganize the text boxes as you desire. Experiment with shade schemes and font pairings. Alter, share or cooperate with other people on your work. Download System Deployment Project Digital Marketing Software Key Metrics Dashboard Graphics PDF and find out how to give a successful presentation. Present a perfect display to your team and make your presentation unforgettable.
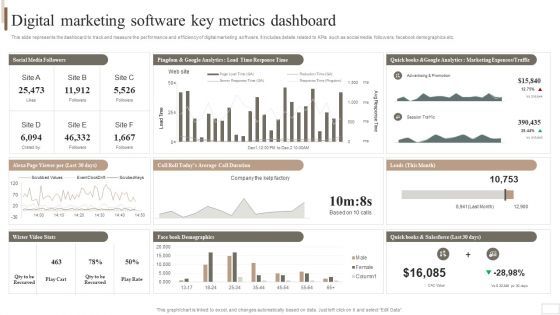
Strategic Plan For Enterprise Digital Marketing Software Key Metrics Dashboard Brochure PDF
This slide represents the dashboard to track and measure the performance and efficiency of digital marketing software. It includes details related to KPIs such as social media followers, facebook demographics etc. Do you have an important presentation coming up Are you looking for something that will make your presentation stand out from the rest Look no further than Strategic Plan For Enterprise Digital Marketing Software Key Metrics Dashboard Brochure PDF. With our professional designs, you can trust that your presentation will pop and make delivering it a smooth process. And with Slidegeeks, you can trust that your presentation will be unique and memorable. So why wait Grab Strategic Plan For Enterprise Digital Marketing Software Key Metrics Dashboard Brochure PDF today and make your presentation stand out from the rest.

Customer Relationship Management Dashboard CRM Data Analysis Sample PDF
Deliver an aweinspiring pitch with this creative customer relationship management dashboard crm data analysis sample pdf bundle. Topics like entities by rep, completed activities l, biz notes this month, activity last 3 months, sales last 3 months can be discussed with this completely editable template. It is available for immediate download depending on the needs and requirements of the user.
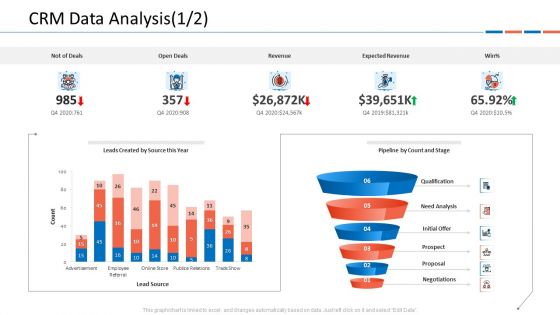
Customer Relationship Management Dashboard CRM Data Analysis Deals Ideas PDF
This graph or chart is linked to excel, and changes automatically based on data. Just left click on it and select Edit Data.Deliver and pitch your topic in the best possible manner with this customer relationship management dashboard crm data analysis deals ideas pdf. Use them to share invaluable insights on v and impress your audience. This template can be altered and modified as per your expectations. So, grab it now.
Organization Cyber Security Dashboard Ppt Icon Sample PDF
This slide covers the cyber security key performance indicators for the organization including application health, device license consumption, data encryption status and many more Deliver and pitch your topic in the best possible manner with this organization cyber security dashboard ppt icon sample pdf. Use them to share invaluable insights on makes and models, application health, license consumption, operating systems and impress your audience. This template can be altered and modified as per your expectations. So, grab it now.
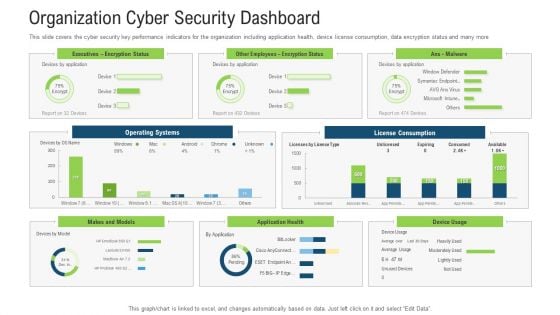
Organization Cyber Security Dashboard Ppt Show Outfit PDF
This slide covers the cyber security key performance indicators for the organization including application health, device license consumption, data encryption status and many more. Deliver an awe inspiring pitch with this creative organization cyber security dashboard ppt show outfit pdf bundle. Topics like operating systems, license consumption, makes and models, other employees can be discussed with this completely editable template. It is available for immediate download depending on the needs and requirements of the user.
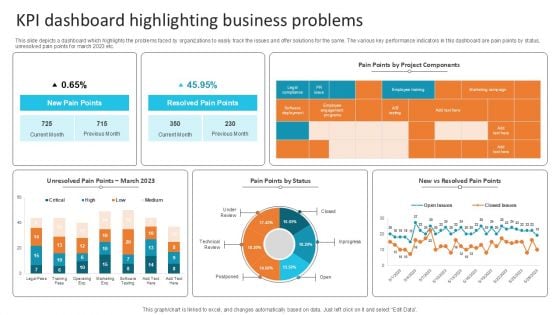
KPI Dashboard Highlighting Business Problems Microsoft PDF
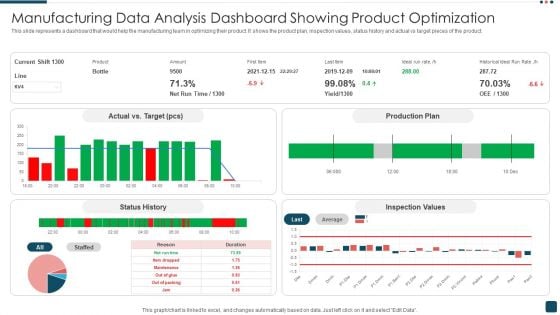
Manufacturing Data Analysis Dashboard Showing Product Optimization Structure PDF
This slide represents a dashboard that would help the manufacturing team in optimizing their product. It shows the product plan, inspection values, status history and actual vs target pieces of the product. Pitch your topic with ease and precision using this Manufacturing Data Analysis Dashboard Showing Product Optimization Structure PDF. This layout presents information on Target, Production Plan, Inspection Values. It is also available for immediate download and adjustment. So, changes can be made in the color, design, graphics or any other component to create a unique layout.
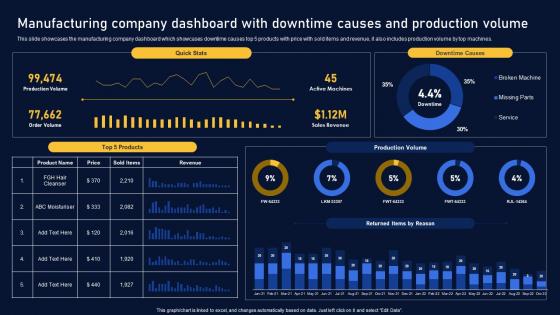
Manufacturing Company Dashboard Multinational Organization Customer Goods Diagrams Pdf
This slide showcases the manufacturing company dashboard which showcases downtime causes top 5 products with price with sold items and revenue, it also includes production volume by top machines. This modern and well arranged Manufacturing Company Dashboard Multinational Organization Customer Goods Diagrams Pdf provides lots of creative possibilities. It is very simple to customize and edit with the Powerpoint Software. Just drag and drop your pictures into the shapes. All facets of this template can be edited with Powerpoint, no extra software is necessary. Add your own material, put your images in the places assigned for them, adjust the colors, and then you can show your slides to the world, with an animated slide included. This slide showcases the manufacturing company dashboard which showcases downtime causes top 5 products with price with sold items and revenue, it also includes production volume by top machines.

Digital Approach To Client Digital Banking Dashboard Showcasing Transaction
This slide showcases dashboard which illustrates performance of digital wallet and payment cards used for online banking. It provides information regarding network volume, debit and credit card performance, cards weekly transaction volume, value and network value. This modern and well-arranged Digital Approach To Client Digital Banking Dashboard Showcasing Transaction provides lots of creative possibilities. It is very simple to customize and edit with the Powerpoint Software. Just drag and drop your pictures into the shapes. All facets of this template can be edited with Powerpoint, no extra software is necessary. Add your own material, put your images in the places assigned for them, adjust the colors, and then you can show your slides to the world, with an animated slide included. This slide showcases dashboard which illustrates performance of digital wallet and payment cards used for online banking. It provides information regarding network volume, debit and credit card performance, cards weekly transaction volume, value and network value.
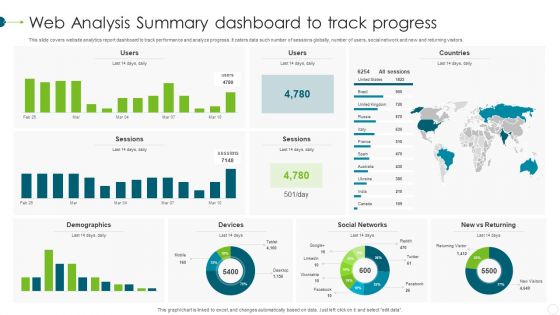
Web Analysis Summary Dashboard To Track Progress Elements PDF
This slide covers website analytics report dashboard to track performance and analyze progress. It caters data such number of sessions globally, number of users, social network and new and returning visitors. Showcasing this set of slides titled Web Analysis Summary Dashboard To Track Progress Elements PDF. The topics addressed in these templates are Demographics, Devices, Social Networks. All the content presented in this PPT design is completely editable. Download it and make adjustments in color, background, font etc. as per your unique business setting.
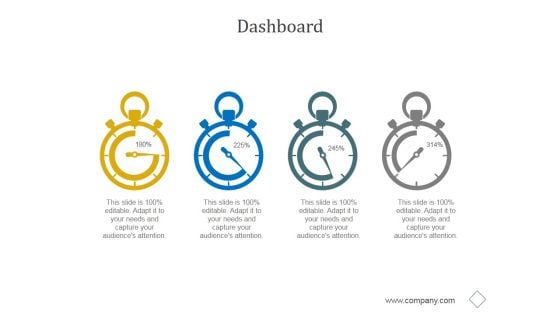
Dashboard Ppt PowerPoint Presentation Guide
This is a dashboard ppt powerpoint presentation guide. This is a four stage process. The stages in this process are business, marketing, management, dashboard, analysis.
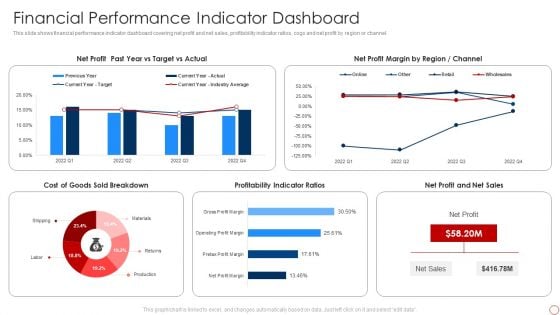
Kpis For Evaluating Business Sustainability Financial Performance Indicator Dashboard Demonstration PDF
This slide shows financial performance indicator dashboard covering net profit and net sales, profitability indicator ratios, cogs and net profit by region or channel. Deliver and pitch your topic in the best possible manner with this Kpis For Evaluating Business Sustainability Financial Performance Indicator Dashboard Demonstration PDF. Use them to share invaluable insights on Net Profit, Net Profit Margin, Profitability Indicator Ratios and impress your audience. This template can be altered and modified as per your expectations. So, grab it now.
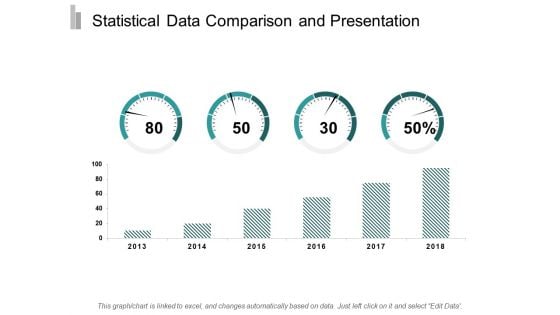
Statistical Data Comparison And Presentation Ppt Powerpoint Presentation Gallery Backgrounds
This is a statistical data comparison and presentation ppt powerpoint presentation gallery backgrounds. This is a two stage process. The stages in this process are data presentation, content presentation, information presentation.
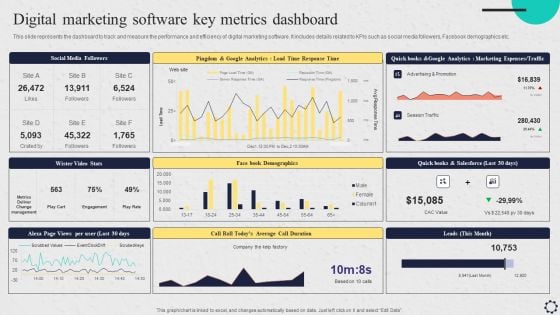
Software Implementation Strategy Digital Marketing Software Key Metrics Dashboard Template PDF
This slide represents the dashboard to track and measure the performance and efficiency of digital marketing software. It includes details related to KPIs such as social media followers, Facebook demographics etc. Crafting an eye catching presentation has never been more straightforward. Let your presentation shine with this tasteful yet straightforward Software Implementation Strategy Digital Marketing Software Key Metrics Dashboard Template PDF template. It offers a minimalistic and classy look that is great for making a statement. The colors have been employed intelligently to add a bit of playfulness while still remaining professional. Construct the idealSoftware Implementation Strategy Digital Marketing Software Key Metrics Dashboard Template PDF that effortlessly grabs the attention of your audience Begin now and be certain to wow your customers.
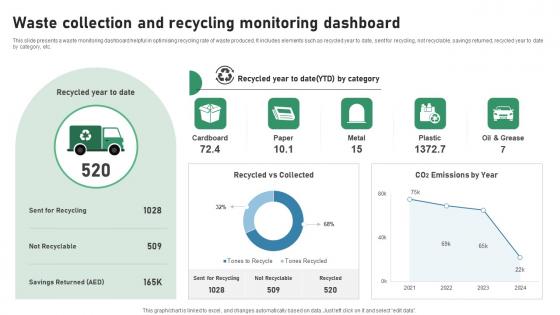
Waste Collection And Recycling Monitoring Dashboard IOT Applications In Smart Waste IoT SS V
This slide presents a waste monitoring dashboard helpful in optimising recycling rate of waste produced. It includes elements such as recycled year to date, sent for recycling, not recyclable, savings returned, recycled year to date by category, etc. Slidegeeks is here to make your presentations a breeze with Waste Collection And Recycling Monitoring Dashboard IOT Applications In Smart Waste IoT SS V With our easy-to-use and customizable templates, you can focus on delivering your ideas rather than worrying about formatting. With a variety of designs to choose from, you are sure to find one that suits your needs. And with animations and unique photos, illustrations, and fonts, you can make your presentation pop. So whether you are giving a sales pitch or presenting to the board, make sure to check out Slidegeeks first This slide presents a waste monitoring dashboard helpful in optimising recycling rate of waste produced. It includes elements such as recycled year to date, sent for recycling, not recyclable, savings returned, recycled year to date by category, etc.
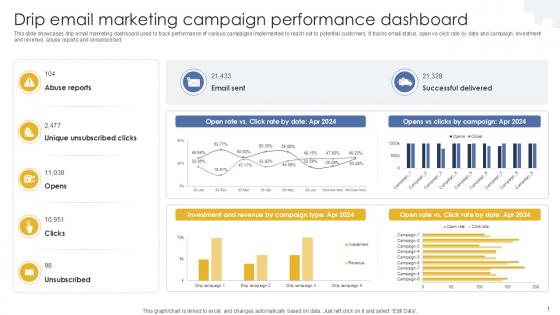
Drip Email Marketing Campaign Performance Dashboard PPT Template MKT SS V
This slide showcases drip email marketing dashboard used to track performance of various campaigns implemented to reach out to potential customers. It tracks email status, open vs click rate by date and campaign, investment and revenue, abuse reports and unsubscribed. Slidegeeks is here to make your presentations a breeze with Drip Email Marketing Campaign Performance Dashboard PPT Template MKT SS V With our easy-to-use and customizable templates, you can focus on delivering your ideas rather than worrying about formatting. With a variety of designs to choose from, you are sure to find one that suits your needs. And with animations and unique photos, illustrations, and fonts, you can make your presentation pop. So whether you are giving a sales pitch or presenting to the board, make sure to check out Slidegeeks first This slide showcases drip email marketing dashboard used to track performance of various campaigns implemented to reach out to potential customers. It tracks email status, open vs click rate by date and campaign, investment and revenue, abuse reports and unsubscribed.
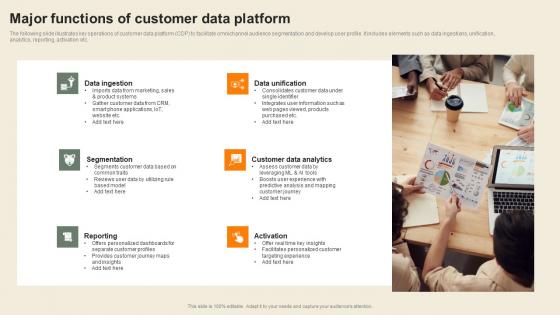
Major Functions Of Customer Data Platform Usability Of CDP Software Tool Mockup Pdf
The following slide illustrates key operations of customer data platform CDP to facilitate omnichannel audience segmentation and develop user profile. It includes elements such as data ingestions, unification, analytics, reporting, activation etc. Retrieve professionally designed Major Functions Of Customer Data Platform Usability Of CDP Software Tool Mockup Pdf to effectively convey your message and captivate your listeners. Save time by selecting pre-made slideshows that are appropriate for various topics, from business to educational purposes. These themes come in many different styles, from creative to corporate, and all of them are easily adjustable and can be edited quickly. Access them as PowerPoint templates or as Google Slides themes. You do not have to go on a hunt for the perfect presentation because Slidegeeks got you covered from everywhere. The following slide illustrates key operations of customer data platform CDP to facilitate omnichannel audience segmentation and develop user profile. It includes elements such as data ingestions, unification, analytics, reporting, activation etc.
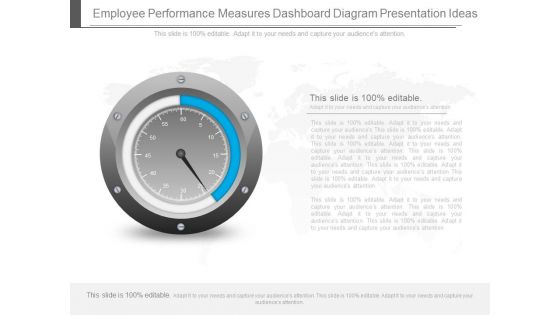
Employee Performance Measures Dashboard Diagram Presentation Ideas
This is a employee performance measures dashboard diagram presentation ideas. This is a one stage process. The stages in this process are business, marketing, dashboard, measuring.
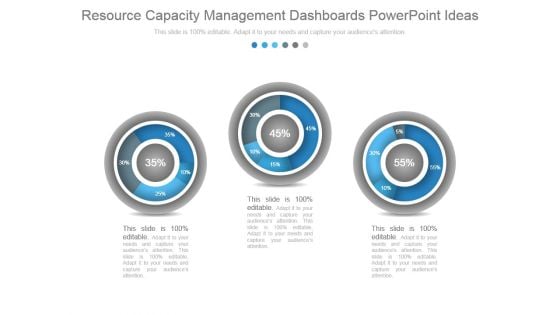
Resource Capacity Management Dashboards Powerpoint Ideas
This is a resource capacity management dashboards powerpoint ideas. This is a three stage process. The stages in this process are dashboard, percentage, measuring, business, marketing.
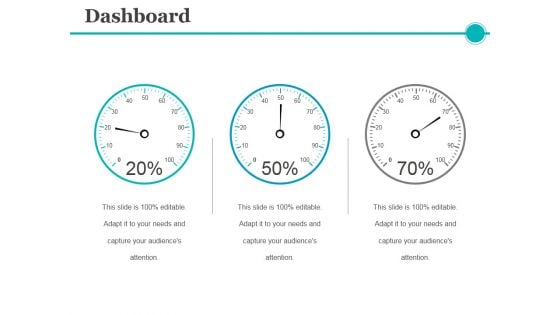
Dashboard Ppt PowerPoint Presentation Portfolio Background Image
This is a dashboard ppt powerpoint presentation portfolio background image. This is a three stage process. The stages in this process are dashboard, measurement, business, marketing.


 Continue with Email

 Home
Home


