Snapshot
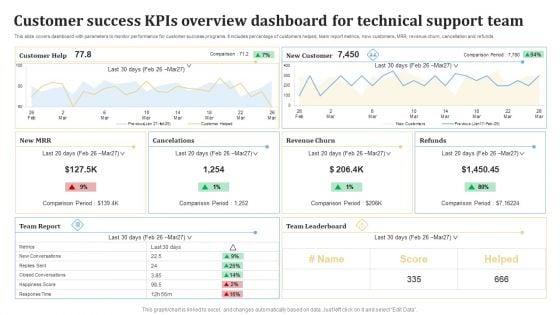
Customer Success KPIS Overview Dashboard For Technical Support Team Ppt PowerPoint Presentation Gallery Layouts PDF
This slide covers dashboard with parameters to monitor performance for customer success programs. It includes percentage of customers helped, team report metrics, new customers, MRR, revenue churn, cancellation and refunds. Showcasing this set of slides titled Customer Success KPIS Overview Dashboard For Technical Support Team Ppt PowerPoint Presentation Gallery Layouts PDF. The topics addressed in these templates are Customer, Cancelations, New Customer, Revenue Churn. All the content presented in this PPT design is completely editable. Download it and make adjustments in color, background, font etc. as per your unique business setting.

HR Recruitment Dashboard Kpis With Open Positions Ppt Model Good PDF
Following slide showcases the recruitment dashboard metrics for measuring placement per department. It include KPIs like applications received by departments, applicant details, sources, time to hire. Pitch your topic with ease and precision using this HR Recruitment Dashboard Kpis With Open Positions Ppt Model Good PDF. This layout presents information on Offer Acceptance Ratio, Recruitment Funnel, Applicant Details. It is also available for immediate download and adjustment. So, changes can be made in the color, design, graphics or any other component to create a unique layout.
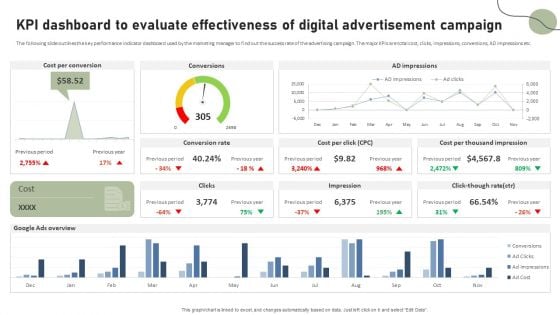
KPI Dashboard To Evaluate Effectiveness Of Digital Advertisement Campaign Pictures PDF
The following slide outlines the key performance indicator dashboard used by the marketing manager to find out the success rate of the advertising campaign. The major KPIs are total cost, clicks, impressions, conversions, AD impressions etc. Do you have to make sure that everyone on your team knows about any specific topic I yes, then you should give KPI Dashboard To Evaluate Effectiveness Of Digital Advertisement Campaign Pictures PDF a try. Our experts have put a lot of knowledge and effort into creating this impeccable KPI Dashboard To Evaluate Effectiveness Of Digital Advertisement Campaign Pictures PDF. You can use this template for your upcoming presentations, as the slides are perfect to represent even the tiniest detail. You can download these templates from the Slidegeeks website and these are easy to edit. So grab these today.
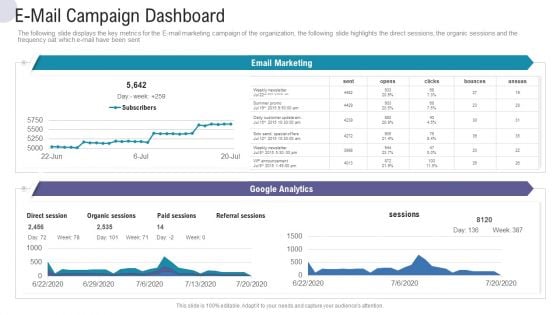
E-Mail Campaign Dashboard Commercial Activities Marketing Tools Mockup PDF
The following slide displays the key metrics for the E mail marketing campaign of the organization, the following slide highlights the direct sessions, the organic sessions and the frequency oat which e mail have been sent. Deliver and pitch your topic in the best possible manner with this e mail campaign dashboard commercial activities marketing tools mockup pdf. Use them to share invaluable insights on e mail campaign dashboard and impress your audience. This template can be altered and modified as per your expectations. So, grab it now.
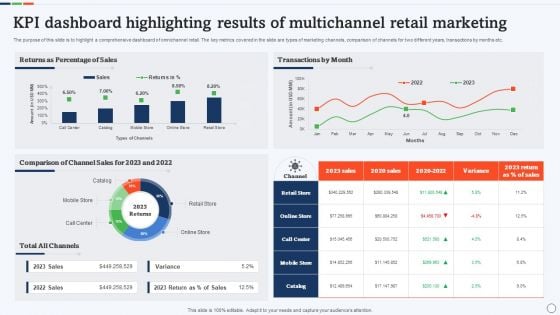
KPI Dashboard Highlighting Results Of Multichannel Retail Marketing Rules PDF
The purpose of this slide is to highlight a comprehensive dashboard of omnichannel retail. The key metrics covered in the slide are types of marketing channels, comparison of channels for two different years, transactions by months etc. Pitch your topic with ease and precision using this KPI Dashboard Highlighting Results Of Multichannel Retail Marketing Rules PDF. This layout presents information on Comparison Of Channel Sales, Percentage Of Sales, Transactions By Month. It is also available for immediate download and adjustment. So, changes can be made in the color, design, graphics or any other component to create a unique layout.

Dashboard Showing Emarketing Performance Digital Marketing Strategy Deployment Demonstration PDF
This slide focuses on the dashboard that shows the e-marketing performance such ad lead funnel, traffic sources, monthly leads and key metrics.Want to ace your presentation in front of a live audience Our Dashboard Showing Emarketing Performance Digital Marketing Strategy Deployment Demonstration PDF can help you do that by engaging all the users towards you.. Slidegeeks experts have put their efforts and expertise into creating these impeccable powerpoint presentations so that you can communicate your ideas clearly. Moreover, all the templates are customizable, and easy-to-edit and downloadable. Use these for both personal and commercial use.
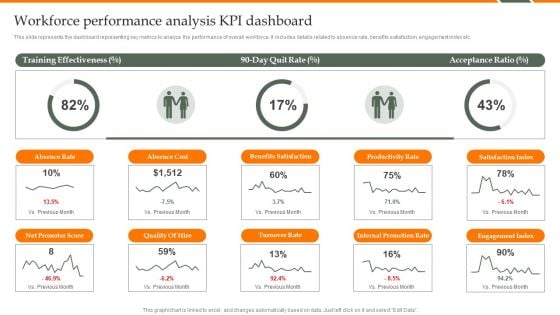
Human Resource Analytics Workforce Performance Analysis KPI Dashboard Structure PDF
This slide represents the dashboard representing key metrics to analyze the performance of overall workforce. It includes details related to absence rate, benefits satisfaction, engagement index etc. Find a pre-designed and impeccable Human Resource Analytics Workforce Performance Analysis KPI Dashboard Structure PDF. The templates can ace your presentation without additional effort. You can download these easy-to-edit presentation templates to make your presentation stand out from others. So, what are you waiting for Download the template from Slidegeeks today and give a unique touch to your presentation.
Website Leads Tracking Dashboard With Traffic Sources Infographics PDF
This slide showcases dashboard for lead generation that can help organziation to identify the traffic sources plus visitors and make changes in SEO of website. It also showcases key metrics that are bounce rate by week, visitors by user type, top channels by conversion, top campaign by conversion and top pages by conversion. Pitch your topic with ease and precision using this Website Leads Tracking Dashboard With Traffic Sources Infographics PDF. This layout presents information on Visitors User Type, Traffic Sources, Bounce Rate Week. It is also available for immediate download and adjustment. So, changes can be made in the color, design, graphics or any other component to create a unique layout.

Picture Of Working Overtime To Improve Income Ppt PowerPoint Presentation File Graphic Tips PDF
Presenting picture of working overtime to improve income ppt powerpoint presentation file graphic tips pdf to dispense important information. This template comprises three stages. It also presents valuable insights into the topics including picture of working overtime to improve income. This is a completely customizable PowerPoint theme that can be put to use immediately. So, download it and address the topic impactfully.

Picture Showing Speedometer Of Bike Ppt PowerPoint Presentation File Shapes PDF
Presenting picture showing speedometer of bike ppt powerpoint presentation file shapes pdf to dispense important information. This template comprises three stages. It also presents valuable insights into the topics including picture showing speedometer of bike. This is a completely customizable PowerPoint theme that can be put to use immediately. So, download it and address the topic impactfully.
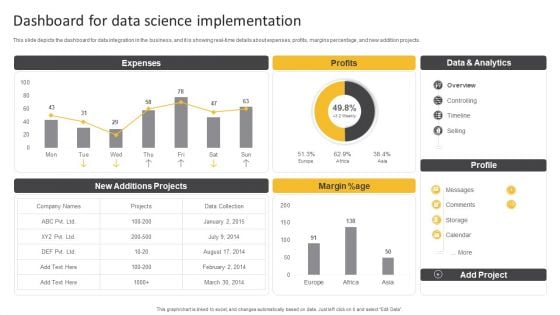
Information Science Dashboard For Data Science Implementation Ppt PowerPoint Presentation Slides Maker PDF
This slide depicts the dashboard for data integration in the business, and it is showing real-time details about expenses, profits, margins percentage, and new addition projects.Deliver and pitch your topic in the best possible manner with this Information Science Dashboard For Data Science Implementation Ppt PowerPoint Presentation Slides Maker PDF. Use them to share invaluable insights on Expenses, Data Analytics, New Projects and impress your audience. This template can be altered and modified as per your expectations. So, grab it now.
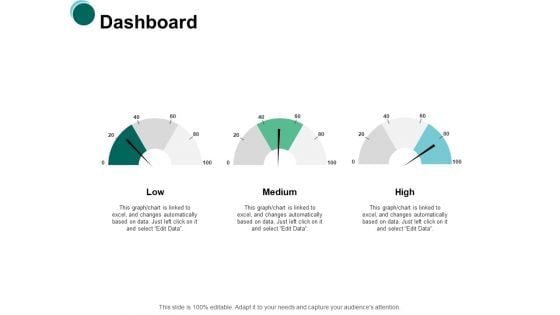
Dashboard Meausrement Ppt PowerPoint Presentation Portfolio Visual Aids
Presenting this set of slides with name dashboard meausrement ppt powerpoint presentation portfolio visual aids. This is a stage process. The stages in this process are dashboard, marketing, management, investment, analysis. This is a completely editable PowerPoint presentation and is available for immediate download. Download now and impress your audience.
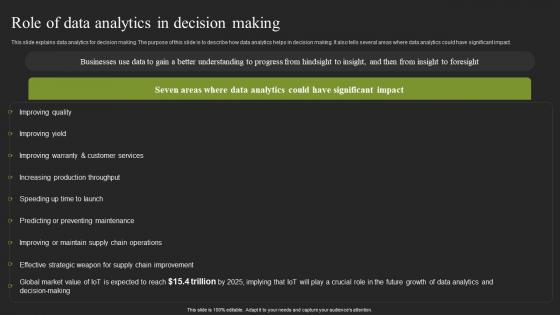
Role Of Data Analytics In Decision Making Cybernetic Systems Slides Pdf
This slide explains data analytics for decision making. The purpose of this slide is to describe how data analytics helps in decision making. It also tells several areas where data analytics could have significant impact. From laying roadmaps to briefing everything in detail, our templates are perfect for you. You can set the stage with your presentation slides. All you have to do is download these easy to edit and customizable templates. Role Of Data Analytics In Decision Making Cybernetic Systems Slides Pdf will help you deliver an outstanding performance that everyone would remember and praise you for. Do download this presentation today. This slide explains data analytics for decision making. The purpose of this slide is to describe how data analytics helps in decision making. It also tells several areas where data analytics could have significant impact.
KPI Dashboard Showing Warehouse Data And Fleet Status Icons PDF
Pitch your topic with ease and precision using this KPI Dashboard Showing Warehouse Data And Fleet Status Icons PDF This layout presents information on Deliveries By Country, Delivery Status, Profit By Country It is also available for immediate download and adjustment. So, changes can be made in the color, design, graphics or any other component to create a unique layout.
Warehouse Data KPI With Order Performance Dashboard Icons PDF
Pitch your topic with ease and precision using this Warehouse Data KPI With Order Performance Dashboard Icons PDF This layout presents information on Inventory Accuracy, Order Accuracy Europe, Total Accuracy It is also available for immediate download and adjustment. So, changes can be made in the color, design, graphics or any other component to create a unique layout.

Picture Of Pocket Watch Dial Ppt PowerPoint Presentation Gallery Demonstration PDF
Persuade your audience using this picture of pocket watch dial ppt powerpoint presentation gallery demonstration pdf. This PPT design covers four stages, thus making it a great tool to use. It also caters to a variety of topics including picture of pocket watch dial. Download this PPT design now to present a convincing pitch that not only emphasizes the topic but also showcases your presentation skills.
Picture Showing Three Alarm Clocks Ppt PowerPoint Presentation File Display PDF
Persuade your audience using this picture showing three alarm clocks ppt powerpoint presentation file display pdf. This PPT design covers two stages, thus making it a great tool to use. It also caters to a variety of topics including picture showing three alarm clocks. Download this PPT design now to present a convincing pitch that not only emphasizes the topic but also showcases your presentation skills.
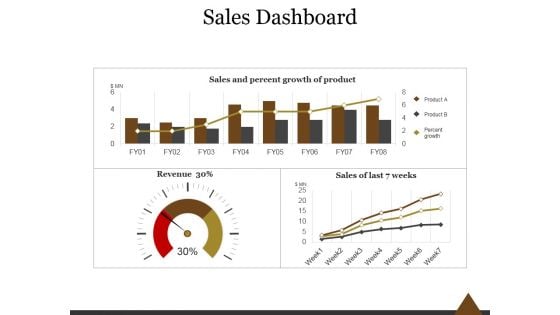
Sales Dashboard Template 1 Ppt PowerPoint Presentation Layouts
This is a sales dashboard template 1 ppt powerpoint presentation layouts. This is a three stage process. The stages in this process are sales and percent growth of product, sales of last weeks, percent growth.
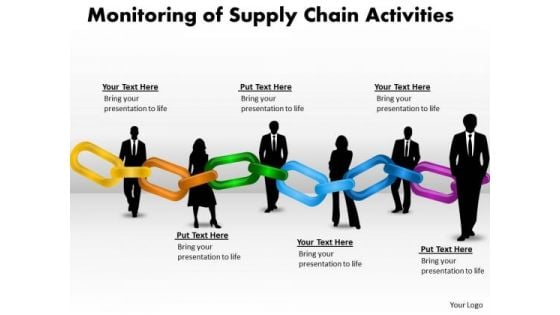
Mba Models And Frameworks Monitoring Of Supply Chain Activities 6 Business Cycle Diagram
Our MBA Models And Frameworks Monitoring of Supply Chain Activities 6 Business Cycle Diagram Powerpoint Templates Team Are A Dogged Lot. They Keep At It Till They Get It Right.
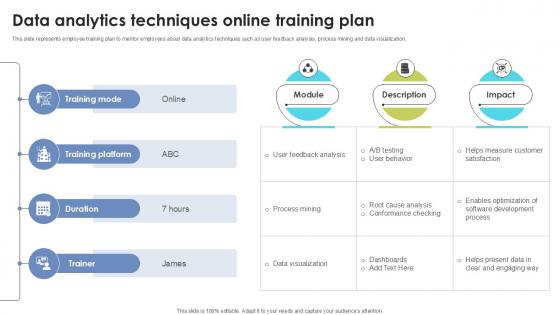
Data Analytics Techniques Online Skill Building Plan For Application PPT Example DTE SS V
This slide represents employee training plan to mentor employees about data analytics techniques such as user feedback analysis, process mining and data visualization. Do you have to make sure that everyone on your team knows about any specific topic I yes, then you should give Data Analytics Techniques Online Skill Building Plan For Application PPT Example DTE SS V a try. Our experts have put a lot of knowledge and effort into creating this impeccable Data Analytics Techniques Online Skill Building Plan For Application PPT Example DTE SS V. You can use this template for your upcoming presentations, as the slides are perfect to represent even the tiniest detail. You can download these templates from the Slidegeeks website and these are easy to edit. So grab these today This slide represents employee training plan to mentor employees about data analytics techniques such as user feedback analysis, process mining and data visualization.
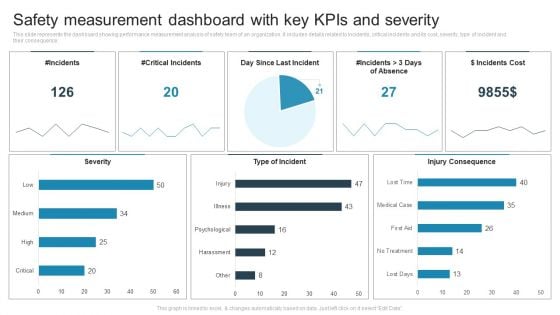
Safety Measurement Dashboard With Key Kpis And Severity Sample PDF
This slide represents the dashboard showing performance measurement analysis of safety team of an organization. It includes details related to incidents, critical incidents and its cost, severity, type of incident and their consequence. Showcasing this set of slides titled Safety Measurement Dashboard With Key Kpis And Severity Sample PDF. The topics addressed in these templates are Incidents, Critical Incidents, Day Since Last Incident. All the content presented in this PPT design is completely editable. Download it and make adjustments in color, background, font etc. as per your unique business setting.
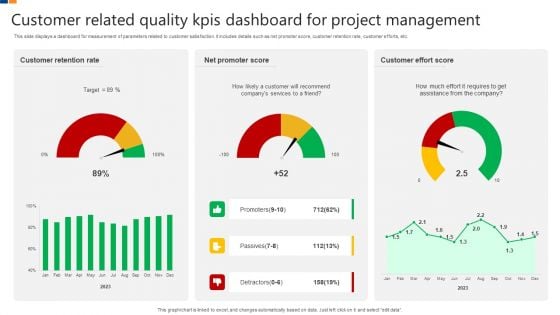
Customer Related Quality Kpis Dashboard For Project Management Brochure PDF
This slide displays a dashboard for measurement of parameters related to customer satisfaction. It includes details such as net promoter score, customer retention rate, customer efforts, etc. Showcasing this set of slides titled Customer Related Quality Kpis Dashboard For Project Management Brochure PDF. The topics addressed in these templates are Customer Retention Rate, Net Promoter Score, Customer Effort Score. All the content presented in this PPT design is completely editable. Download it and make adjustments in color, background, font etc. as per your unique business setting.
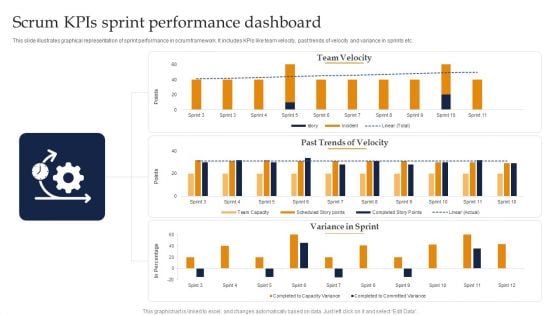
Scrum Kpis Sprint Performance Dashboard Ppt Portfolio Example Introduction PDF
This slide illustrates graphical representation of sprint performance in scrum framework. It includes KPIs like team velocity, past trends of velocity and variance in sprints etc. Showcasing this set of slides titled Scrum Kpis Sprint Performance Dashboard Ppt Portfolio Example Introduction PDF. The topics addressed in these templates are Team Velocity, Past Trends Velocity, Variance Sprint. All the content presented in this PPT design is completely editable. Download it and make adjustments in color, background, font etc. as per your unique business setting.
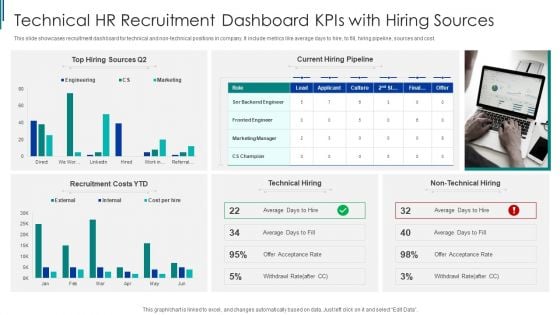
Technical HR Recruitment Dashboard Kpis With Hiring Sources Ppt Outline PDF
This slide showcases recruitment dashboard for technical and non-technical positions in company. It include metrics like average days to hire, to fill, hiring pipeline, sources and cost. Showcasing this set of slides titled Technical HR Recruitment Dashboard Kpis With Hiring Sources Ppt Outline PDF. The topics addressed in these templates are Recruitment Costs, Technical Hiring, Top Hiring Sources. All the content presented in this PPT design is completely editable. Download it and make adjustments in color, background, font etc. as per your unique business setting.
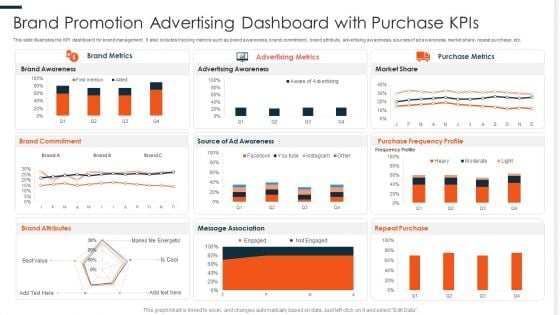
Brand Promotion Advertising Dashboard With Purchase Kpis Ppt PowerPoint Presentation File Format PDF
This slide illustrates the KPI dashboard for brand management. It also includes tracking metrics such as brand awareness, brand commitment, brand attribute, advertising awareness, sources of ad awareness, market share, repeat purchase, etc. Showcasing this set of slides titled Brand Promotion Advertising Dashboard With Purchase Kpis Ppt PowerPoint Presentation File Format PDF. The topics addressed in these templates are Brand Awareness, Advertising Awareness, Purchase Frequency. All the content presented in this PPT design is completely editable. Download it and make adjustments in color, background, font etc. as per your unique business setting.
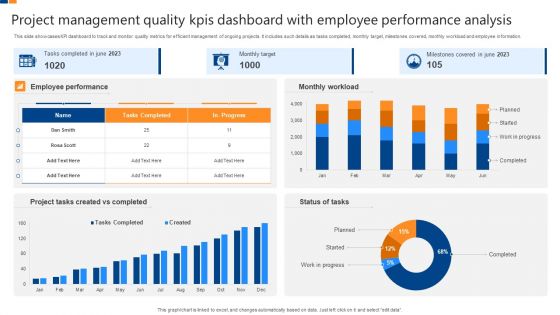
Project Management Quality Kpis Dashboard With Employee Performance Analysis Professional PDF
This slide showcases KPI dashboard to track and monitor quality metrics for efficient management of ongoing projects. It includes such details as tasks completed, monthly target, milestones covered, monthly workload and employee information. Showcasing this set of slides titled Project Management Quality Kpis Dashboard With Employee Performance Analysis Professional PDF. The topics addressed in these templates are Employee Performance, Monthly Workload, Milestones Covered, Monthly Target, Project Tasks Created Completed. All the content presented in this PPT design is completely editable. Download it and make adjustments in color, background, font etc. as per your unique business setting.
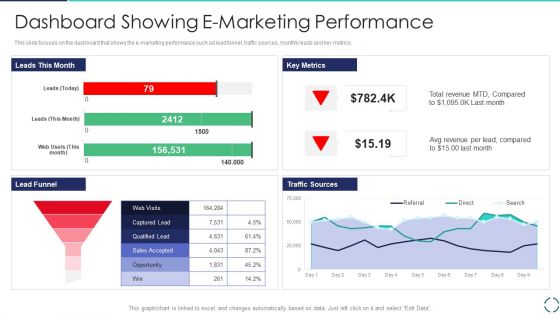
Optimizing E Business Promotion Plan Dashboard Showing E Marketing Performance Ideas PDF
This slide focuses on the dashboard that shows the e-marketing performance such ad lead funnel, traffic sources, monthly leads and key metrics. Deliver an awe inspiring pitch with this creative Optimizing E Business Promotion Plan Dashboard Showing E Marketing Performance Ideas PDF bundle. Topics like Lead Funnel, Key Metrics, Traffic Sources can be discussed with this completely editable template. It is available for immediate download depending on the needs and requirements of the user.
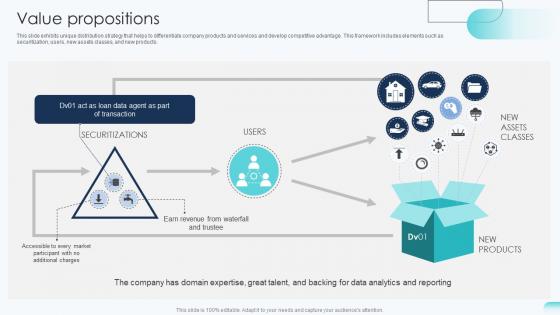
Value Propositions Big Data Analytics Investor Funding Elevator Pitch Deck
This slide exhibits unique distribution strategy that helps to differentiate company products and services and develop competitive advantage. This framework includes elements such as securitization, users, new assets classes, and new products. Explore a selection of the finest Value Propositions Big Data Analytics Investor Funding Elevator Pitch Deck here. With a plethora of professionally designed and pre-made slide templates, you can quickly and easily find the right one for your upcoming presentation. You can use our Value Propositions Big Data Analytics Investor Funding Elevator Pitch Deck to effectively convey your message to a wider audience. Slidegeeks has done a lot of research before preparing these presentation templates. The content can be personalized and the slides are highly editable. Grab templates today from Slidegeeks. This slide exhibits unique distribution strategy that helps to differentiate company products and services and develop competitive advantage. This framework includes elements such as securitization, users, new assets classes, and new products.
Stop Watch In Human Hand Vector Icon Ppt PowerPoint Presentation Infographics Pictures PDF
Presenting this set of slides with name stop watch in human hand vector icon ppt powerpoint presentation infographics pictures pdf. This is a three stage process. The stages in this process are stop watch in human hand vector icon. This is a completely editable PowerPoint presentation and is available for immediate download. Download now and impress your audience.
Upward Arrow With Clock And Text Holders Ppt PowerPoint Presentation Icon Pictures PDF
Presenting this set of slides with name upward arrow with clock and text holders ppt powerpoint presentation icon pictures pdf. This is a three stage process. The stages in this process are upward arrow with clock and text holders. This is a completely editable PowerPoint presentation and is available for immediate download. Download now and impress your audience.

Bike Odometer With Red Pointer Ppt PowerPoint Presentation Pictures Templates PDF
Presenting bike odometer with red pointer ppt powerpoint presentation pictures templates pdf to dispense important information. This template comprises three stages. It also presents valuable insights into the topics including bike odometer with red pointer. This is a completely customizable PowerPoint theme that can be put to use immediately. So, download it and address the topic impactfully.
Variance Analysis Techniques And Models Efficient Operations Cycle Icon Introduction PDF
Persuade your audience using this variance analysis techniques and models efficient operations cycle icon introduction pdf. This PPT design covers four stages, thus making it a great tool to use. It also caters to a variety of topics including variance analysis techniques and models efficient operations cycle icon. Download this PPT design now to present a convincing pitch that not only emphasizes the topic but also showcases your presentation skills.
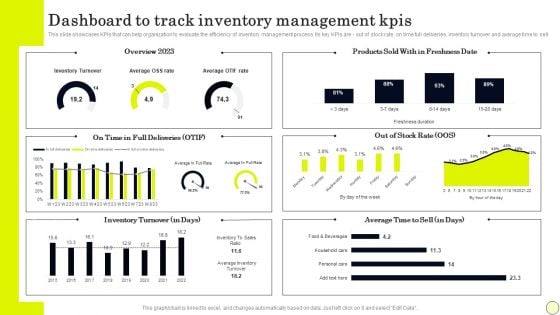
Dashboard To Track Inventory Management Kpis Portrait PDF
This slide showcases KPIs that can help organization to evaluate the efficiency of inventory management process. Its key KPIs are out of stock rate, on time full deliveries, inventory turnover and average time to sell. Here you can discover an assortment of the finest PowerPoint and Google Slides templates. With these templates, you can create presentations for a variety of purposes while simultaneously providing your audience with an eye catching visual experience. Download Dashboard To Track Inventory Management Kpis Portrait PDF to deliver an impeccable presentation. These templates will make your job of preparing presentations much quicker, yet still, maintain a high level of quality. Slidegeeks has experienced researchers who prepare these templates and write high quality content for you. Later on, you can personalize the content by editing the Dashboard To Track Inventory Management Kpis Portrait PDF.
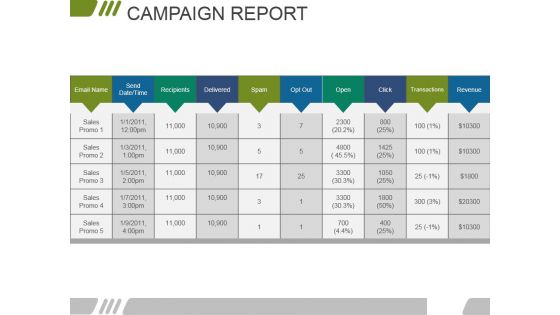
Campaign Report Ppt PowerPoint Presentation Slides Professional
This is a campaign report ppt powerpoint presentation slides professional. This is a five stage process. The stages in this process are email name, send date time, recipients, delivered, spam, opt out, open, click, transactions, revenue.
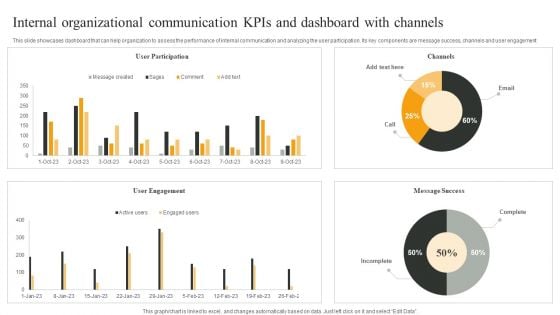
Internal Organizational Communication Kpis And Dashboard With Channels Infographics PDF
This slide showcases dashboard that can help organization to assess the performance of internal communication and analyzing the user participation. Its key components are message success, channels and user engagement. Pitch your topic with ease and precision using this Internal Organizational Communication Kpis And Dashboard With Channels Infographics PDF. This layout presents information on User Participation, User Engagement, Message Success. It is also available for immediate download and adjustment. So, changes can be made in the color, design, graphics or any other component to create a unique layout.
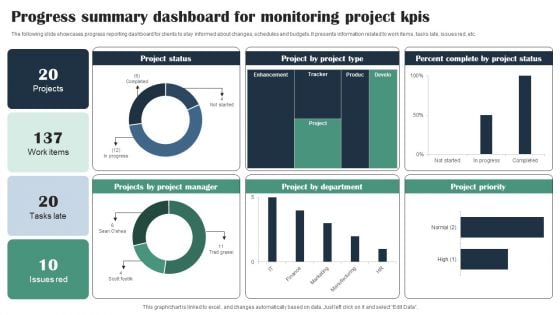
Progress Summary Dashboard For Monitoring Project Kpis Infographics PDF
The following slide showcases progress reporting dashboard for clients to stay informed about changes, schedules and budgets. It presents information related to work items, tasks late, issues red, etc. Pitch your topic with ease and precision using this Progress Summary Dashboard For Monitoring Project Kpis Infographics PDF. This layout presents information on Project Status, Project Manager, Project Type, Percent Complete. It is also available for immediate download and adjustment. So, changes can be made in the color, design, graphics or any other component to create a unique layout.
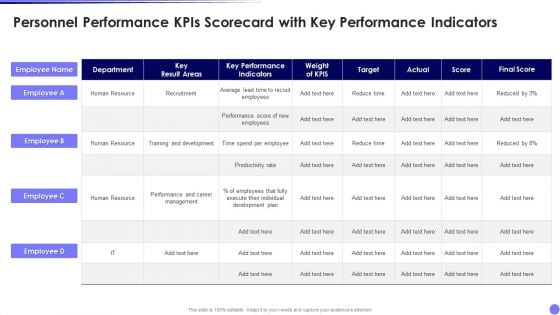
Personnel Performance Kpis Scorecard With Key Performance Indicators Designs PDF
Pitch your topic with ease and precision using this Personnel Performance Kpis Scorecard With Key Performance Indicators Designs PDF. This layout presents information on Key Performance Indicators, Target, Final Score, Employee. It is also available for immediate download and adjustment. So, changes can be made in the color, design, graphics or any other component to create a unique layout.
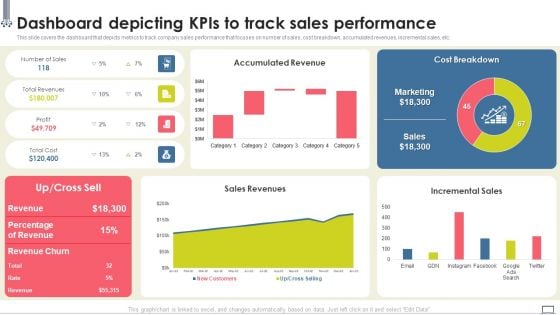
Change Management Strategy Dashboard Depicting Kpis To Track Sales Performance Ideas PDF
This slide covers the dashboard that depicts metrics to track company sales performance that focuses on number of sales, cost breakdown, accumulated revenues, incremental sales, etc. From laying roadmaps to briefing everything in detail, our templates are perfect for you. You can set the stage with your presentation slides. All you have to do is download these easy-to-edit and customizable templates. Change Management Strategy Dashboard Depicting Kpis To Track Sales Performance Ideas PDF will help you deliver an outstanding performance that everyone would remember and praise you for. Do download this presentation today.
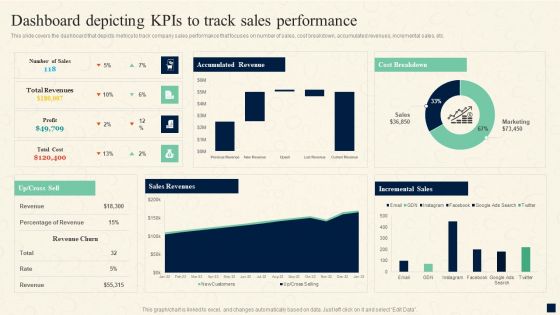
Change Management Process Dashboard Depicting Kpis To Track Sales Performance Introduction PDF
This slide covers the dashboard that depicts metrics to track company sales performance that focuses on number of sales, cost breakdown, accumulated revenues, incremental sales, etc. From laying roadmaps to briefing everything in detail, our templates are perfect for you. You can set the stage with your presentation slides. All you have to do is download these easy-to-edit and customizable templates. Change Management Process Dashboard Depicting Kpis To Track Sales Performance Introduction PDF will help you deliver an outstanding performance that everyone would remember and praise you for. Do download this presentation today.
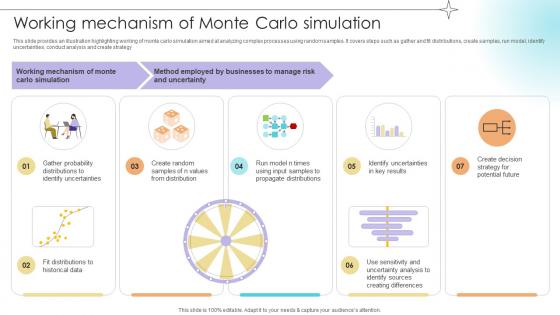
Working Mechanism Of Monte Carlo Simulation Data Analytics SS V
This slide provides an illustration highlighting working of monte carlo simulation aimed at analyzing complex processes using random samples. It covers steps such as gather and fit distributions, create samples, run model, identify uncertainties, conduct analysis and create strategy.Slidegeeks has constructed Working Mechanism Of Monte Carlo Simulation Data Analytics SS V after conducting extensive research and examination. These presentation templates are constantly being generated and modified based on user preferences and critiques from editors. Here, you will find the most attractive templates for a range of purposes while taking into account ratings and remarks from users regarding the content. This is an excellent jumping-off point to explore our content and will give new users an insight into our top-notch PowerPoint Templates. This slide provides an illustration highlighting working of monte carlo simulation aimed at analyzing complex processes using random samples. It covers steps such as gather and fit distributions, create samples, run model, identify uncertainties, conduct analysis and create strategy.
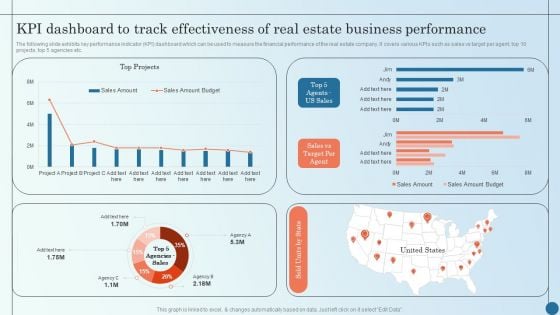
KPI Dashboard To Track Effectiveness Of Real Estate Business Managing Commercial Property Risks Demonstration PDF
The following slide exhibits key performance indicator KPI dashboard which can be used to measure the financial performance of the real estate company. It covers various KPIs such as sales vs target per agent, top 10 projects, top 5 agencies etc.Deliver an awe inspiring pitch with this creative KPI Dashboard To Track Effectiveness Of Real Estate Business Managing Commercial Property Risks Demonstration PDF bundle. Topics like Kpi Dashboard, Track Effectiveness, Estate Business can be discussed with this completely editable template. It is available for immediate download depending on the needs and requirements of the user.
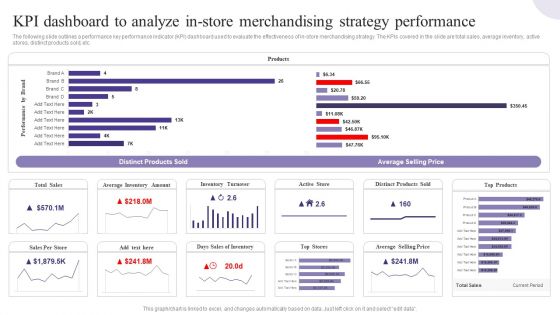
KPI Dashboard To Analyze In Store Merchandising Strategy Performance Introduction PDF
The following slide outlines a performance key performance indicator KPI dashboard used to evaluate the effectiveness of in-store merchandising strategy. The KPIs covered in the slide are total sales, average inventory, active stores, distinct products sold, etc. Formulating a presentation can take up a lot of effort and time, so the content and message should always be the primary focus. The visuals of the PowerPoint can enhance the presenters message, so our KPI Dashboard To Analyze In Store Merchandising Strategy Performance Introduction PDF was created to help save time. Instead of worrying about the design, the presenter can concentrate on the message while our designers work on creating the ideal templates for whatever situation is needed. Slidegeeks has experts for everything from amazing designs to valuable content, we have put everything into KPI Dashboard To Analyze In Store Merchandising Strategy Performance Introduction PDF.
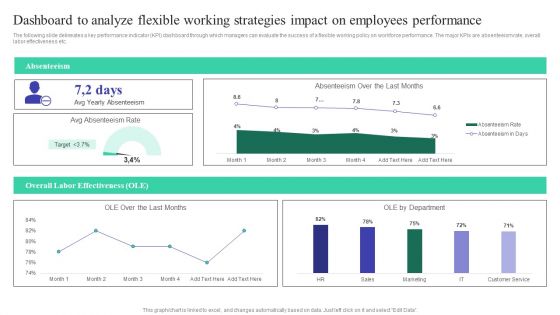
Dashboard To Analyze Flexible Working Strategies Impact On Employees Performance Professional PDF
The following slide delineates a key performance indicator KPI dashboard through which managers can evaluate the success of a flexible working policy on workforce performance. The major KPIs are absenteeism rate, overall labor effectiveness etc. If you are looking for a format to display your unique thoughts, then the professionally designed Dashboard To Analyze Flexible Working Strategies Impact On Employees Performance Professional PDF is the one for you. You can use it as a Google Slides template or a PowerPoint template. Incorporate impressive visuals, symbols, images, and other charts. Modify or reorganize the text boxes as you desire. Experiment with shade schemes and font pairings. Alter, share or cooperate with other people on your work. Download Dashboard To Analyze Flexible Working Strategies Impact On Employees Performance Professional PDF and find out how to give a successful presentation. Present a perfect display to your team and make your presentation unforgettable.
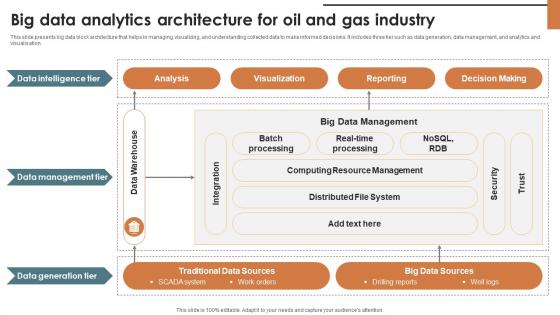
IoT Solutions For Oil Big Data Analytics Architecture For Oil And Gas Industry IoT SS V
This slide presents big data block architecture that helps in managing, visualizing, and understanding collected data to make informed decisions. It includes three tier such as data generation, data management, and analytics and visualisation. From laying roadmaps to briefing everything in detail, our templates are perfect for you. You can set the stage with your presentation slides. All you have to do is download these easy-to-edit and customizable templates. IoT Solutions For Oil Big Data Analytics Architecture For Oil And Gas Industry IoT SS V will help you deliver an outstanding performance that everyone would remember and praise you for. Do download this presentation today. This slide presents big data block architecture that helps in managing, visualizing, and understanding collected data to make informed decisions. It includes three tier such as data generation, data management, and analytics and visualisation.
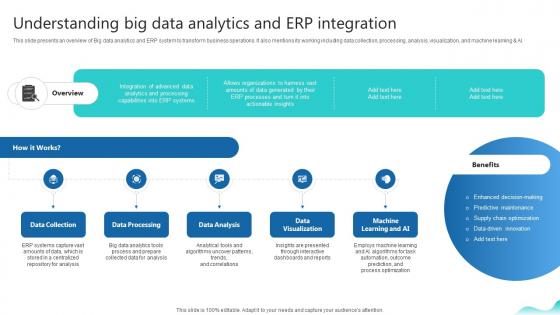
Understanding Big Data Analytics And Erp Integration Erp And Digital Transformation For Maximizing DT SS V
This slide presents an overview of Big data analytics and ERP system to transform business operations. It also mentions its working including data collection, processing, analysis, visualization, and machine learning and AI.There are so many reasons you need a Understanding Big Data Analytics And Erp Integration Erp And Digital Transformation For Maximizing DT SS V. The first reason is you can not spend time making everything from scratch, Thus, Slidegeeks has made presentation templates for you too. You can easily download these templates from our website easily. This slide presents an overview of Big data analytics and ERP system to transform business operations. It also mentions its working including data collection, processing, analysis, visualization, and machine learning and AI.
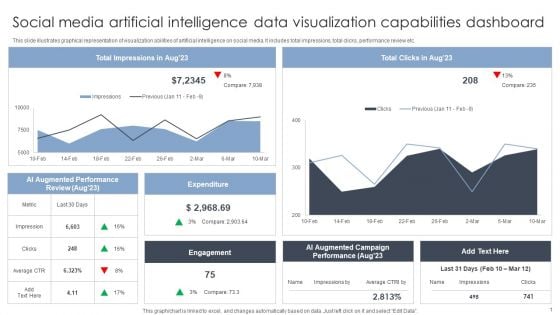
Social Media Artificial Intelligence Data Visualization Capabilities Dashboard Inspiration PDF
This slide illustrates graphical representation of visualization abilities of artificial intelligence on social media. It includes total impressions, total clicks, performance review etc. Pitch your topic with ease and precision using this Social Media Artificial Intelligence Data Visualization Capabilities Dashboard Inspiration PDF. This layout presents information on Artificial Intelligence, Data Visualization Capabilities. It is also available for immediate download and adjustment. So, changes can be made in the color, design, graphics or any other component to create a unique layout.

Multiple Point Of Sale System Dashboard Depicting Restaurants Daily Performance Mockup PDF
This Slide represents point of sale system dashboard depicting restaurants daily performance which can be beneficial for eateries to manage their regular sales. It includes information about sales, expenditure, menu, customer data, bookings and reports. Persuade your audience using this Multiple Point Of Sale System Dashboard Depicting Restaurants Daily Performance Mockup PDF. This PPT design covers four stages, thus making it a great tool to use. It also caters to a variety of topics including Expenditure, Sales, Customer Data. Download this PPT design now to present a convincing pitch that not only emphasizes the topic but also showcases your presentation skills.
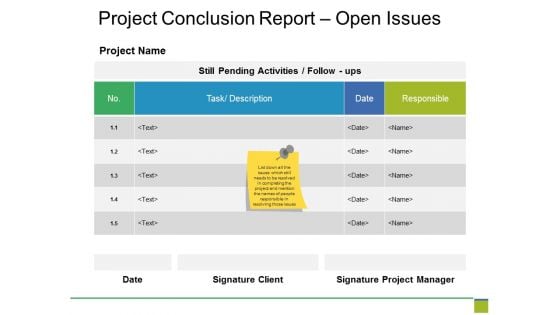
Project Conclusion Report Open Issues Ppt PowerPoint Presentation Outline Gallery
This is a project conclusion report open issues ppt powerpoint presentation outline gallery. This is a five stage process. The stages in this process are project name, table, data analysis, data analysis.

Consumer Packaged Goods Industry Data Analytics Company Outline Mockup PDF
The following slide highlights the research services offered by Kantar company to the consumer packaged goods industry. It also shows the clients and impact of solutions provided. There are so many reasons you need a Consumer Packaged Goods Industry Data Analytics Company Outline Mockup PDF The first reason is you can not spend time making everything from scratch, Thus, Slidegeeks has made presentation templates for you too. You can easily download these templates from our website easily. The following slide highlights the research services offered by Kantar company to the consumer packaged goods industry. It also shows the clients and impact of solutions provided.
Icons Slide Data Analytics Company Outline Sample PDF
Introducing our well designed Icons Slide Data Analytics Company Outline Sample PDF set of slides. The slide displays editable icons to enhance your visual presentation. The icons can be edited easily. So customize according to your business to achieve a creative edge. Download and share it with your audience. The following slide highlights the list of industries that are served by kantar company to provide expert services as research and consulting firm. The industries included are automotive and mobility, consumer packaged goods, energy and utilities, fashion, beauty and luxury, finance, government and public sector, health, hospitality, leisure and travel media, retail, sport and leisure and technology and telecoms.
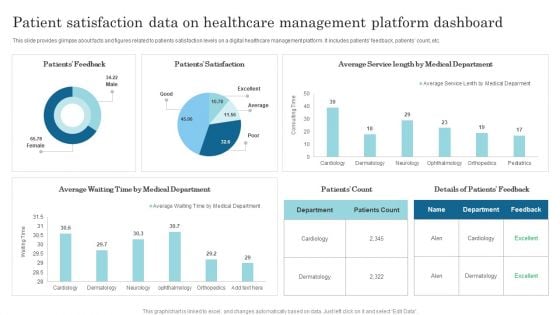
Patient Satisfaction Data On Healthcare Management Platform Dashboard Slides PDF
This slide provides glimpse about facts and figures related to patients satisfaction levels on a digital healthcare management platform. It includes patients feedback, patients count, etc. Showcasing this set of slides titled Patient Satisfaction Data On Healthcare Management Platform Dashboard Slides PDF. The topics addressed in these templates are Patients Feedback, Patients Satisfaction, Average Waiting Time. All the content presented in this PPT design is completely editable. Download it and make adjustments in color, background, font etc. as per your unique business setting.
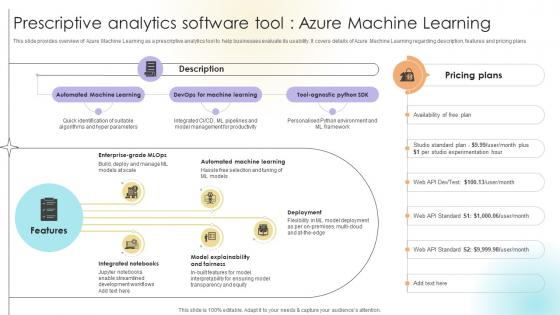
Prescriptive Analytics Software Tool Azure Machine Learning Data Analytics SS V
This slide provides overview of Azure Machine Learning as a prescriptive analytics tool to help businesses evaluate its usability. It covers details of Azure Machine Learning regarding description, features and pricing plans.Welcome to our selection of the Prescriptive Analytics Software Tool Azure Machine Learning Data Analytics SS V. These are designed to help you showcase your creativity and bring your sphere to life. Planning and Innovation are essential for any business that is just starting out. This collection contains the designs that you need for your everyday presentations. All of our PowerPoints are 100 percent editable, so you can customize them to suit your needs. This multi-purpose template can be used in various situations. Grab these presentation templates today. This slide provides overview of Azure Machine Learning as a prescriptive analytics tool to help businesses evaluate its usability. It covers details of Azure Machine Learning regarding description, features and pricing plans.
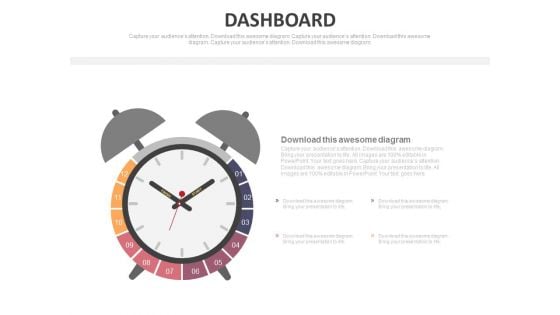
Alarm Clock Dashboard Design For Time Management Powerpoint Slides
This PowerPoint template has been designed with graphics of alarm clock. You may use this dashboard slide design for topics like time management. This PPT slide is powerful tool to describe your ideas.
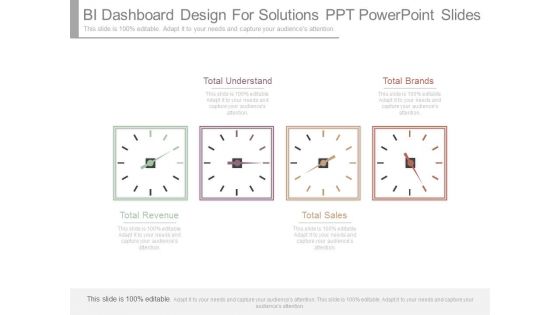
Bi Dashboard Design For Solutions Ppt Powerpoint Slides
This is a bi dashboard design for solutions ppt powerpoint slides. This is a four stage process. The stages in this process are total understand, total brands, total revenue, total sales.
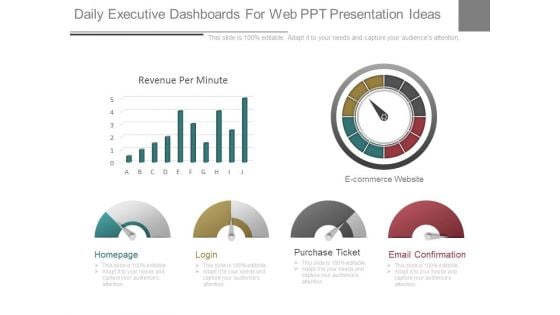
Daily Executive Dashboards For Web Ppt Presentation Ideas
This is a daily executive dashboards for web ppt presentation ideas. This is a six stage process. The stages in this process are homepage, login, purchase ticket, email confirmation, ecommerce website, revenue per minute.
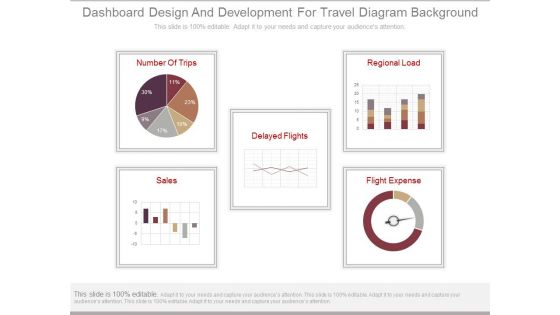
Dashboard Design And Development For Travel Diagram Background
This is a dashboard design and development for travel diagram background. This is a five stage process. The stages in this process are number of trips, sales, delayed flights, regional load, flight expense.
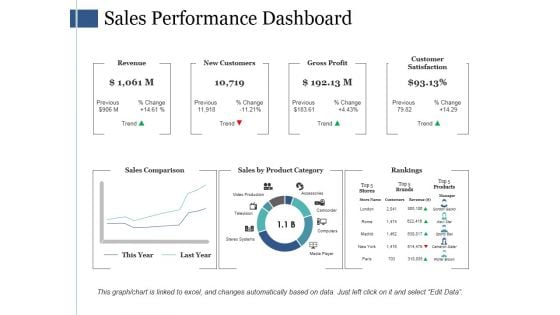
Sales Performance Dashboard Ppt PowerPoint Presentation Ideas Portfolio
This is a sales performance dashboard ppt powerpoint presentation ideas portfolio. This is a three stage process. The stages in this process are revenue, new customers, gross profit, customer satisfaction, sales comparison.
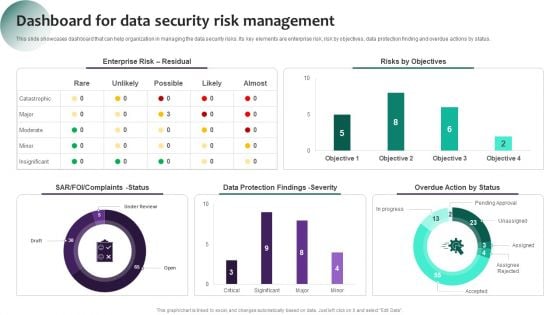
Information Systems Security And Risk Management Plan Dashboard For Data Security Risk Management Information PDF
This slide showcases dashboard that can help organization in managing the data security risks. Its key elements are enterprise risk, risk by objectives, data protection finding and overdue actions by status. If you are looking for a format to display your unique thoughts, then the professionally designed Information Systems Security And Risk Management Plan Dashboard For Data Security Risk Management Information PDF is the one for you. You can use it as a Google Slides template or a PowerPoint template. Incorporate impressive visuals, symbols, images, and other charts. Modify or reorganize the text boxes as you desire. Experiment with shade schemes and font pairings. Alter, share or cooperate with other people on your work. Download Information Systems Security And Risk Management Plan Dashboard For Data Security Risk Management Information PDF and find out how to give a successful presentation. Present a perfect display to your team and make your presentation unforgettable.
Business Research And Analytics Vector Icon Ppt PowerPoint Presentation Professional Show
Presenting this set of slides with name business research and analytics vector icon ppt powerpoint presentation professional show. This is a three stage process. The stages in this process are data visualization icon, research analysis, business focus. This is a completely editable PowerPoint presentation and is available for immediate download. Download now and impress your audience.
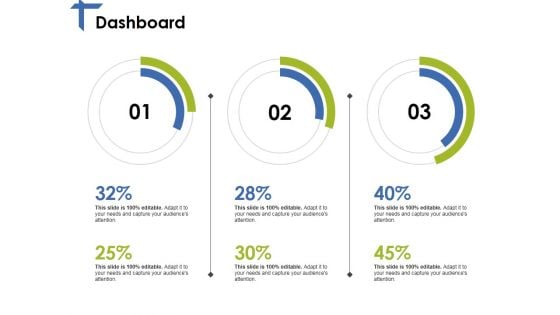
Dashboard Ppt PowerPoint Presentation Ideas Pictures
This is a dashboard ppt powerpoint presentation ideas pictures. This is a three stage process. The stages in this process are dashboard, finance, percentage, business, management.


 Continue with Email

 Home
Home


