Snapshot
Market Potential Big Data Analytics Investor Funding Elevator Pitch Deck
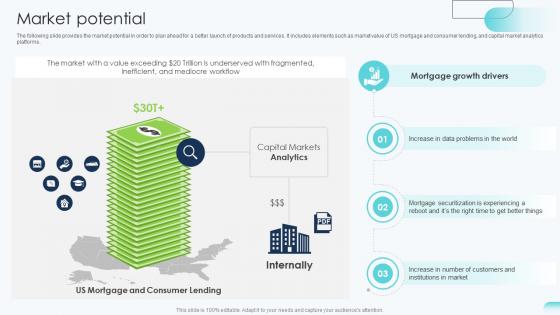
The following slide provides the market potential in order to plan ahead for a better launch of products and services. It includes elements such as market value of US mortgage and consumer lending, and capital market analytics platforms. Are you in need of a template that can accommodate all of your creative concepts This one is crafted professionally and can be altered to fit any style. Use it with Google Slides or PowerPoint. Include striking photographs, symbols, depictions, and other visuals. Fill, move around, or remove text boxes as desired. Test out color palettes and font mixtures. Edit and save your work, or work with colleagues. Download Market Potential Big Data Analytics Investor Funding Elevator Pitch Deck and observe how to make your presentation outstanding. Give an impeccable presentation to your group and make your presentation unforgettable. The following slide provides the market potential in order to plan ahead for a better launch of products and services. It includes elements such as market value of US mortgage and consumer lending, and capital market analytics platforms.
Dashboard Ppt Powerpoint Presentation Pictures Skills
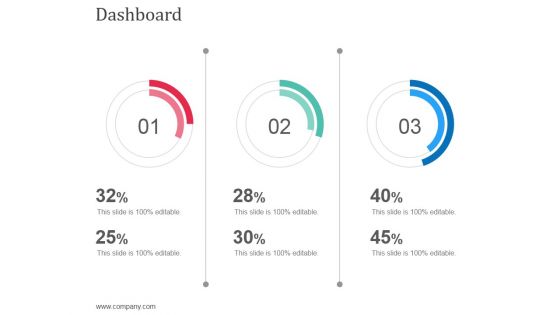
This is a dashboard ppt powerpoint presentation pictures skills. This is a three stage process. The stages in this process are dashboard, business, marketing, finance.
Fixed Asset Management Framework Implementation Metric Dashboard For Tracking Assets And Equipments Pictures PDF
This slide represents fixed asset dashboard for asset tracking. It highlights active assets, processors, operating system, devices etc.Deliver and pitch your topic in the best possible manner with this Fixed Asset Management Framework Implementation Metric Dashboard For Tracking Assets And Equipments Pictures PDF Use them to share invaluable insights on Active Assets, Operating System, Manufacture Model and impress your audience. This template can be altered and modified as per your expectations. So, grab it now.
Data Analytics Reporting Structure Ppt PowerPoint Presentation Infographics Clipart Images Cpb Pdf
Presenting this set of slides with name data analytics reporting structure ppt powerpoint presentation infographics clipart images cpb pdf. This is an editable Powerpoint one stages graphic that deals with topics like data analysis reporting tools to help convey your message better graphically. This product is a premium product available for immediate download and is 100 percent editable in Powerpoint. Download this now and use it in your presentations to impress your audience.
Assessing Impact Of Sales Risk Management With KPI Dashboard Ppt Professional Graphics Pictures PDF
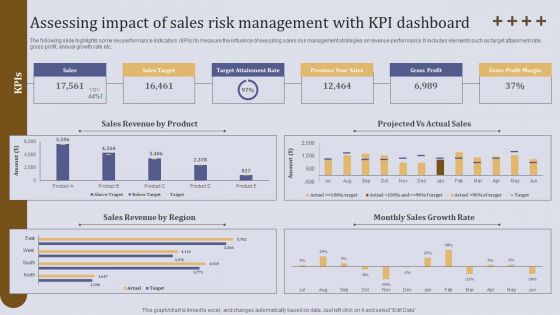
The following slide highlights some key performance indicators KPIs to measure the influence of executing sales risk management strategies on revenue performance. It includes elements such as target attainment rate, gross profit, annual growth rate etc. Are you in need of a template that can accommodate all of your creative concepts This one is crafted professionally and can be altered to fit any style. Use it with Google Slides or PowerPoint. Include striking photographs, symbols, depictions, and other visuals. Fill, move around, or remove text boxes as desired. Test out color palettes and font mixtures. Edit and save your work, or work with colleagues. Download Assessing Impact Of Sales Risk Management With KPI Dashboard Ppt Professional Graphics Pictures PDF and observe how to make your presentation outstanding. Give an impeccable presentation to your group and make your presentation unforgettable.
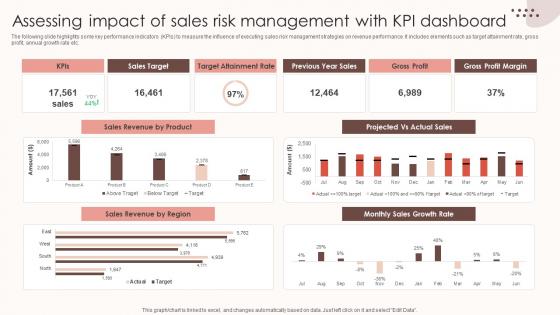
Assessing Sales Risks Assessing Impact Of Sales Risk Management With Kpi Dashboard Topics PDF
The following slide highlights some key performance indicators KPIs to measure the influence of executing sales risk management strategies on revenue performance. It includes elements such as target attainment rate, gross profit, annual growth rate etc. Create an editable Assessing Sales Risks Assessing Impact Of Sales Risk Management With Kpi Dashboard Topics PDF that communicates your idea and engages your audience. Whether you are presenting a business or an educational presentation, pre-designed presentation templates help save time. Assessing Sales Risks Assessing Impact Of Sales Risk Management With Kpi Dashboard Topics PDF is highly customizable and very easy to edit, covering many different styles from creative to business presentations. Slidegeeks has creative team members who have crafted amazing templates. So, go and get them without any delay. The following slide highlights some key performance indicators KPIs to measure the influence of executing sales risk management strategies on revenue performance. It includes elements such as target attainment rate, gross profit, annual growth rate etc.
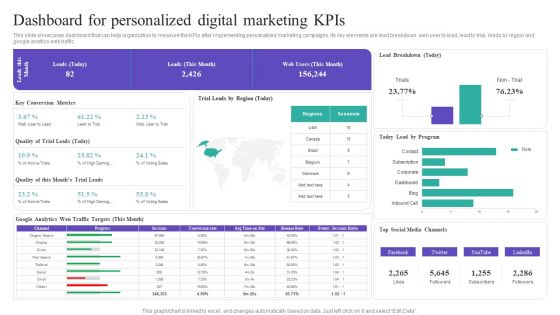
Dashboard For Personalized Digital Marketing Kpis Rules PDF
This slide showcases dashboard that can help organization to measure the KPIs after implementing personalized marketing campaigns. Its key elements are lead breakdown, web user to lead, lead to trial, leads by region and google analtics web traffic. This Dashboard For Personalized Digital Marketing Kpis Rules PDF from Slidegeeks makes it easy to present information on your topic with precision. It provides customization options, so you can make changes to the colors, design, graphics, or any other component to create a unique layout. It is also available for immediate download, so you can begin using it right away. Slidegeeks has done good research to ensure that you have everything you need to make your presentation stand out. Make a name out there for a brilliant performance.
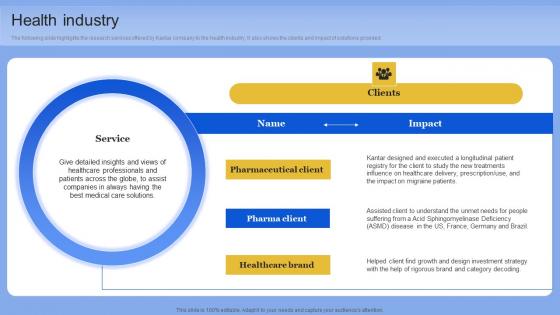
Health Industry Data Analytics Company Outline Professional PDF
The following slide highlights the research services offered by Kantar company to the health industry. It also shows the clients and impact of solutions provided. Coming up with a presentation necessitates that the majority of the effort goes into the content and the message you intend to convey. The visuals of a PowerPoint presentation can only be effective if it supplements and supports the story that is being told. Keeping this in mind our experts created Health Industry Data Analytics Company Outline Professional PDF to reduce the time that goes into designing the presentation. This way, you can concentrate on the message while our designers take care of providing you with the right template for the situation. The following slide highlights the research services offered by Kantar company to the health industry. It also shows the clients and impact of solutions provided
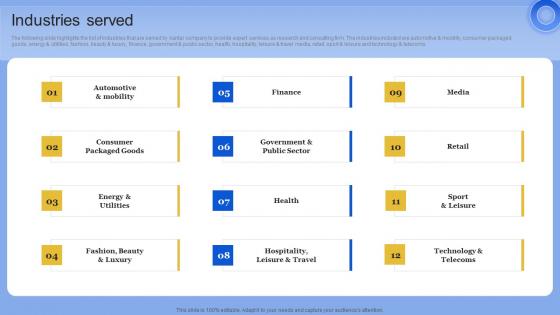
Industries Served Data Analytics Company Outline Inspiration PDF
The following slide highlights the research services offered by Kantar company to the media industry. It also shows the clients and impact of solutions provided. The best PPT templates are a great way to save time, energy, and resources. Slidegeeks have 100 percent editable powerpoint slides making them incredibly versatile. With these quality presentation templates, you can create a captivating and memorable presentation by combining visually appealing slides and effectively communicating your message. Download Industries Served Data Analytics Company Outline Inspiration PDF from Slidegeeks and deliver a wonderful presentation. The following slide highlights the research services offered by Kantar company to the media industry. It also shows the clients and impact of solutions provided
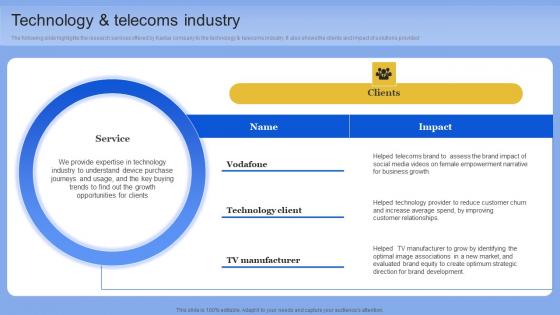
Technology And Telecoms Industry Data Analytics Company Outline Rules PDF
The following slide highlights the research services offered by Kantar company to the technology and telecoms industry. It also shows the clients and impact of solutions provided. Do you know about Slidesgeeks Technology And Telecoms Industry Data Analytics Company Outline Rules PDF These are perfect for delivering any kind od presentation. Using it, create PowerPoint presentations that communicate your ideas and engage audiences. Save time and effort by using our pre-designed presentation templates that are perfect for a wide range of topic. Our vast selection of designs covers a range of styles, from creative to business, and are all highly customizable and easy to edit. Download as a PowerPoint template or use them as Google Slides themes. The following slide highlights the research services offered by Kantar company to the technology and telecoms industry. It also shows the clients and impact of solutions provided

Company Description Big Data Analytics Investor Funding Elevator Pitch Deck
This slide provides information about the company description that helps to give an introduction to investors. It covers details such as mission, vision, business model, industry, founding year, customer, and introduction of the company. Slidegeeks is one of the best resources for PowerPoint templates. You can download easily and regulate Company Description Big Data Analytics Investor Funding Elevator Pitch Deck for your personal presentations from our wonderful collection. A few clicks is all it takes to discover and get the most relevant and appropriate templates. Use our Templates to add a unique zing and appeal to your presentation and meetings. All the slides are easy to edit and you can use them even for advertisement purposes. This slide provides information about the company description that helps to give an introduction to investors. It covers details such as mission, vision, business model, industry, founding year, customer, and introduction of the company.
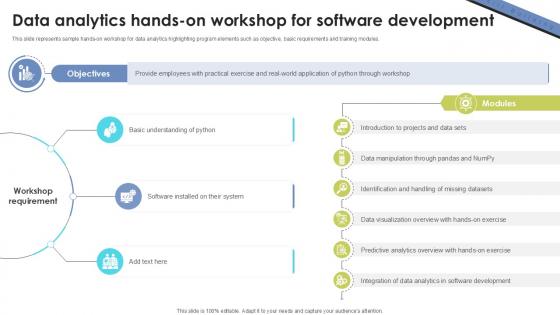
Data Analytics Hands On Workshop Skill Building Plan For Application PPT Slide DTE SS V
This slide represents sample hands-on workshop for data analytics highlighting program elements such as objective, basic requirements and training modules. There are so many reasons you need a Data Analytics Hands On Workshop Skill Building Plan For Application PPT Slide DTE SS V. The first reason is you can not spend time making everything from scratch, Thus, Slidegeeks has made presentation templates for you too. You can easily download these templates from our website easily. This slide represents sample hands-on workshop for data analytics highlighting program elements such as objective, basic requirements and training modules.
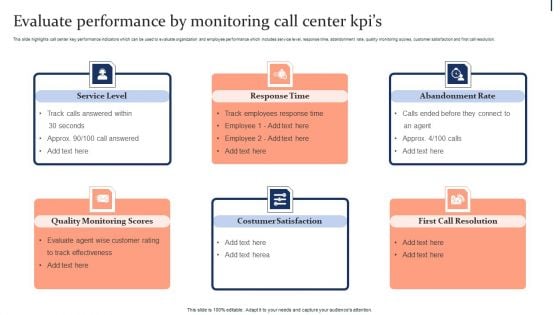
Quality Enhancement Strategic Evaluate Performance By Monitoring Call Center Kpis Rules PDF
This slide highlights call center key performance indicators which can be used to evaluate organization and employee performance which includes service level, response time, abandonment rate, quality monitoring scores, customer satisfaction and first call resolution. Formulating a presentation can take up a lot of effort and time, so the content and message should always be the primary focus. The visuals of the PowerPoint can enhance the presenters message, so our Quality Enhancement Strategic Evaluate Performance By Monitoring Call Center Kpis Rules PDF was created to help save time. Instead of worrying about the design, the presenter can concentrate on the message while our designers work on creating the ideal templates for whatever situation is needed. Slidegeeks has experts for everything from amazing designs to valuable content, we have put everything into Quality Enhancement Strategic Evaluate Performance By Monitoring Call Center Kpis Rules PDF.
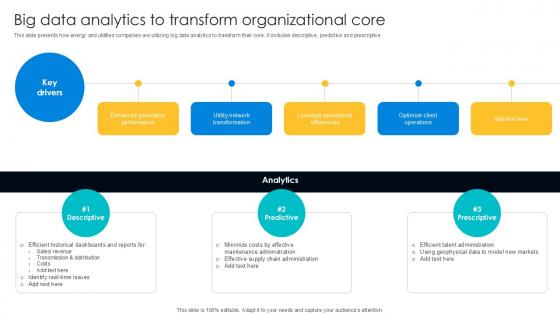
Big Data Analytics To Transform Digital Transformation Journey PPT Template DT SS V
This slide presents how energy and utilities companies are utilizing big data analytics to transform their core. It includes descriptive, predictive and prescriptive. Whether you have daily or monthly meetings, a brilliant presentation is necessary. Big Data Analytics To Transform Digital Transformation Journey PPT Template DT SS V can be your best option for delivering a presentation. Represent everything in detail using Big Data Analytics To Transform Digital Transformation Journey PPT Template DT SS V and make yourself stand out in meetings. The template is versatile and follows a structure that will cater to your requirements. All the templates prepared by Slidegeeks are easy to download and edit. Our research experts have taken care of the corporate themes as well. So, give it a try and see the results. This slide presents how energy and utilities companies are utilizing big data analytics to transform their core. It includes descriptive, predictive and prescriptive.
Icons Slide For Predictive Analytics For Empowering Data Driven Decision Making Designs Pdf
Download our innovative and attention grabbing Icons Slide For Predictive Analytics For Empowering Data Driven Decision Making Designs Pdf template. The set of slides exhibit completely customizable icons. These icons can be incorporated into any business presentation. So download it immediately to clearly communicate with your clientele. Our Icons Slide For Predictive Analytics For Empowering Data Driven Decision Making Designs Pdf are topically designed to provide an attractive backdrop to any subject. Use them to look like a presentation pro.

Integration Of Big Data Text And Predictive Analytics PPT Example SS
This slide outlines the integrated architecture of big data, text analytics, and predictive analytics, including elements deployment, modeling, statistics, etc. Welcome to our selection of the Integration Of Big Data Text And Predictive Analytics PPT Example SS. These are designed to help you showcase your creativity and bring your sphere to life. Planning and Innovation are essential for any business that is just starting out. This collection contains the designs that you need for your everyday presentations. All of our PowerPoints are 100Percent editable, so you can customize them to suit your needs. This multi-purpose template can be used in various situations. Grab these presentation templates today. This slide outlines the integrated architecture of big data, text analytics, and predictive analytics, including elements deployment, modeling, statistics, etc.
Business Analytics Application Employee Engagement Key Performance Metrics Icons PDF
This slide represents key metrics dashboard to analyze the engagement of employees in the organization. It includes details related to KPIs such as engagement score, response rate, net promoter score etc. Formulating a presentation can take up a lot of effort and time, so the content and message should always be the primary focus. The visuals of the PowerPoint can enhance the presenters message, so our Business Analytics Application Employee Engagement Key Performance Metrics Icons PDF was created to help save time. Instead of worrying about the design, the presenter can concentrate on the message while our designers work on creating the ideal templates for whatever situation is needed. Slidegeeks has experts for everything from amazing designs to valuable content, we have put everything into Business Analytics Application Employee Engagement Key Performance Metrics Icons PDF.
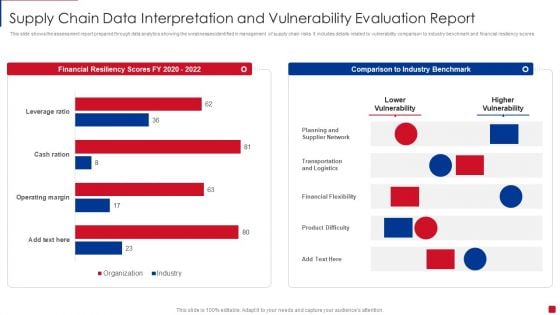
Supply Chain Data Interpretation And Vulnerability Evaluation Report Pictures PDF
This slide shows the assessment report prepared through data analytics showing the weaknesses identified in management of supply chain risks. It includes details related to vulnerability comparison to industry benchmark and financial resiliency scores Showcasing this set of slides titled Supply Chain Data Interpretation And Vulnerability Evaluation Report Pictures PDF. The topics addressed in these templates are Planning And Supplier Network, Transportation And Logistics, Financial Flexibility. All the content presented in this PPT design is completely editable. Download it and make adjustments in color, background, font etc. as per your unique business setting.
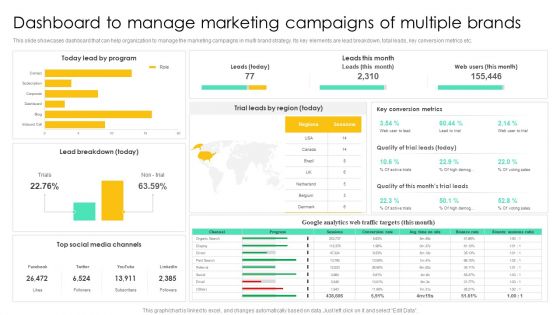
Dashboard To Manage Marketing Campaigns Of Multiple Brands Summary PDF
This slide showcases dashboard that can help organization to manage the marketing campaigns in multi brand strategy. Its key elements are lead breakdown, total leads, key conversion metrics etc. Presenting this PowerPoint presentation, titled Dashboard To Manage Marketing Campaigns Of Multiple Brands Summary PDF, with topics curated by our researchers after extensive research. This editable presentation is available for immediate download and provides attractive features when used. Download now and captivate your audience. Presenting this Dashboard To Manage Marketing Campaigns Of Multiple Brands Summary PDF. Our researchers have carefully researched and created these slides with all aspects taken into consideration. This is a completely customizable Dashboard To Manage Marketing Campaigns Of Multiple Brands Summary PDF that is available for immediate downloading. Download now and make an impact on your audience. Highlight the attractive features available with our PPTs.
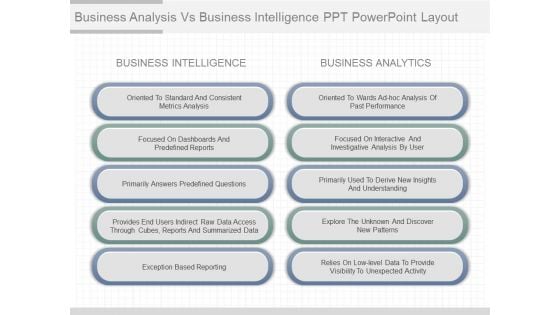
Business Analysis Vs Business Intelligence Ppt Powerpoint Layout
This is a business analysis vs business intelligence ppt powerpoint layout. This is a five stage process. The stages in this process are business intelligence, oriented to standard and consistent metrics analysis, focused on dashboards and predefined reports, primarily answers predefined questions, provides end users indirect raw data access through cubes, reports and summarized data, exception based reporting, oriented to wards ad hoc analysis of past performance, focused on interactive and investigative analysis by user, business analytics, primarily used to derive new insights and understanding, explore the unknown and discover new patterns, relies on low level data to provide visibility to unexpected activity.
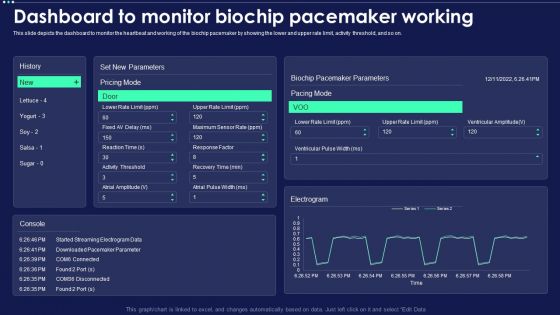
Micro Chip Dashboard To Monitor Biochip Pacemaker Working Themes PDF
This slide depicts the dashboard to monitor the heartbeat and working of the biochip pacemaker by showing the lower and upper rate limit, activity threshold, and so on. Deliver and pitch your topic in the best possible manner with this Micro Chip Dashboard To Monitor Biochip Pacemaker Working Themes PDF. Use them to share invaluable insights on Set New Parameters, Biochip Pacemaker Parameters, Pacing Mode and impress your audience. This template can be altered and modified as per your expectations. So, grab it now.
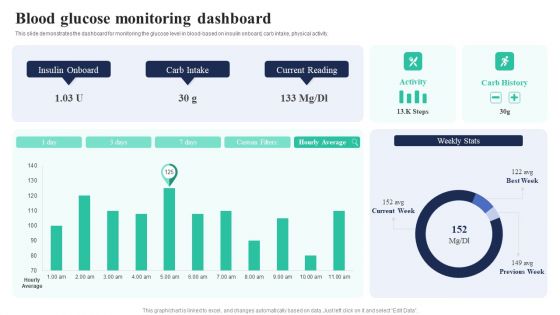
Biochips Use Cases Blood Glucose Monitoring Dashboard Introduction PDF
This slide demonstrates the dashboard for monitoring the glucose level in blood-based on insulin onboard, carb intake, physical activity. Slidegeeks has constructed Biochips Use Cases Blood Glucose Monitoring Dashboard Introduction PDF after conducting extensive research and examination. These presentation templates are constantly being generated and modified based on user preferences and critiques from editors. Here, you will find the most attractive templates for a range of purposes while taking into account ratings and remarks from users regarding the content. This is an excellent jumping-off point to explore our content and will give new users an insight into our top-notch PowerPoint Templates.
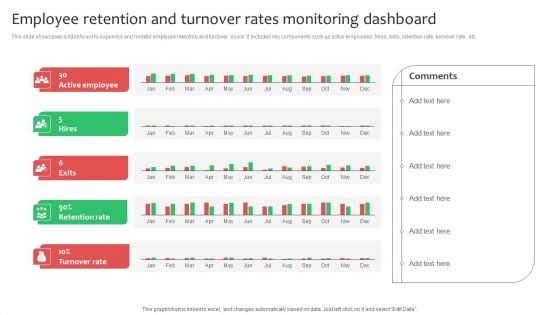
Employee Retention And Turnover Rates Monitoring Dashboard Mockup PDF
This slide showcases a dashboard to supervise and monitor employee retention and turnover score. It includes key components such as active employees, hires, exits, retention rate, turnover rate, etc. If your project calls for a presentation, then Slidegeeks is your go to partner because we have professionally designed, easy to edit templates that are perfect for any presentation. After downloading, you can easily edit Employee Retention And Turnover Rates Monitoring Dashboard Mockup PDF and make the changes accordingly. You can rearrange slides or fill them with different images. Check out all the handy templates
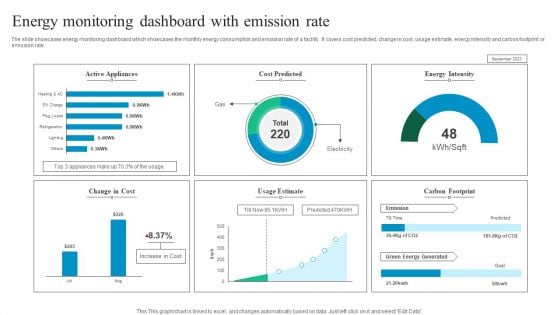
Energy Monitoring Dashboard With Emission Rate Mockup PDF
The slide showcases energy monitoring dashboard which showcases the monthly energy consumption and emission rate of a facility. It covers cost predicted, change in cost, usage estimate, energy intensity and carbon footprint or emission rate. Pitch your topic with ease and precision using this Energy Monitoring Dashboard With Emission Rate Mockup PDF. This layout presents information on Active Appliances, Cost Predicted, Energy Intensity. It is also available for immediate download and adjustment. So, changes can be made in the color, design, graphics or any other component to create a unique layout.
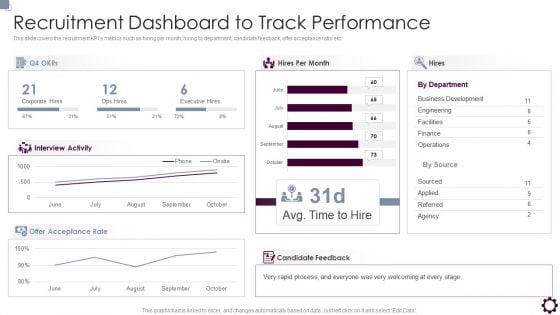
Employee Value Proposition Recruitment Dashboard To Track Performance Brochure PDF
This slide covers the recruitment KPIs metrics such as hiring per month, hiring by department, candidate feedback, offer acceptance ratio etc. Deliver and pitch your topic in the best possible manner with this Employee Value Proposition Recruitment Dashboard To Track Performance Brochure PDF. Use them to share invaluable insights on Business Development, Engineering, Facilities and impress your audience. This template can be altered and modified as per your expectations. So, grab it now.
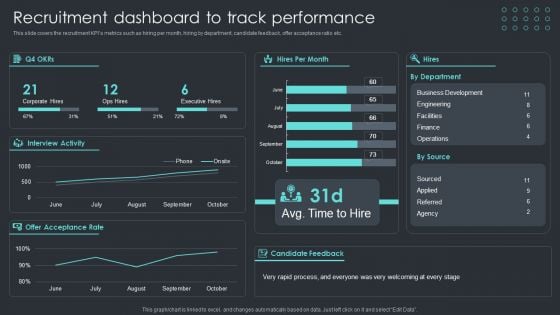
Inbound Recruiting Methodology Recruitment Dashboard To Track Performance Brochure PDF
This slide covers the recruitment KPIs metrics such as hiring per month, hiring by department, candidate feedback, offer acceptance ratio etc. Deliver and pitch your topic in the best possible manner with this Inbound Recruiting Methodology Recruitment Dashboard To Track Performance Brochure PDF. Use them to share invaluable insights on Business Development, Sourced, Offer Acceptance Rate and impress your audience. This template can be altered and modified as per your expectations. So, grab it now.
Monthly Sales KPI Dashboard For Tracking Brand Recommendation Progress Background PDF
Following slide demonstrates key performance indicator dashboard for tracking monthly sales to monitor business performance. It includes components such as monthly execution cost, sales, state wise events, Brand market, and programs. Showcasing this set of slides titled Monthly Sales KPI Dashboard For Tracking Brand Recommendation Progress Background PDF. The topics addressed in these templates are Products Sold, Engagements, Events, Active Markets, Sampled, Attendance. All the content presented in this PPT design is completely editable. Download it and make adjustments in color, background, font etc. as per your unique business setting.
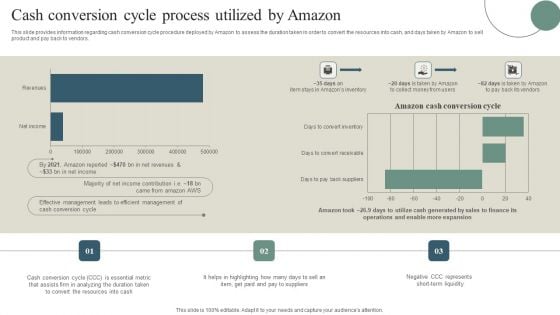
Cash Conversion Cycle Process Utilized By Amazon Pictures PDF
This slide provides information regarding cash conversion cycle procedure deployed by Amazon to assess the duration taken in order to convert the resources into cash, and days taken by Amazon to sell product and pay back to vendors. Want to ace your presentation in front of a live audience Our Cash Conversion Cycle Process Utilized By Amazon Pictures PDF can help you do that by engaging all the users towards you.. Slidegeeks experts have put their efforts and expertise into creating these impeccable powerpoint presentations so that you can communicate your ideas clearly. Moreover, all the templates are customizable, and easy-to-edit and downloadable. Use these for both personal and commercial use.
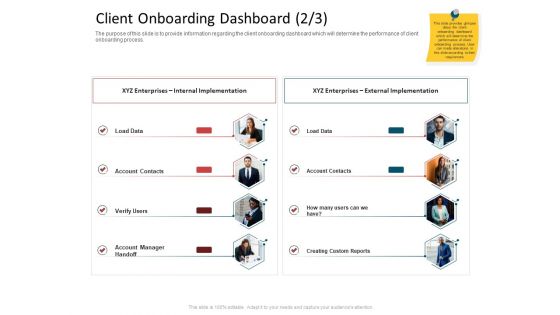
CDD Process Client Onboarding Dashboard Data Ppt Layouts Deck PDF
This is a cdd process client onboarding dashboard data ppt layouts deck pdf template with various stages. Focus and dispense information on two stages using this creative set, that comes with editable features. It contains large content boxes to add your information on topics like xyz enterprises internal implementation, xyz enterprises external implementation. You can also showcase facts, figures, and other relevant content using this PPT layout. Grab it now.
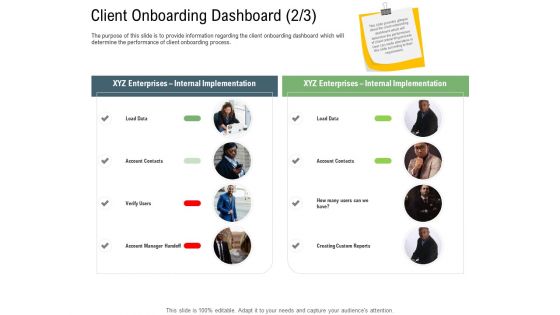
Client Onboarding Framework Client Onboarding Dashboard Data Background PDF
This is a client onboarding framework client onboarding dashboard data background pdf template with various stages. Focus and dispense information on two stages using this creative set, that comes with editable features. It contains large content boxes to add your information on topics like xyz enterprises internal implementation, xyz enterprises external implementation. You can also showcase facts, figures, and other relevant content using this PPT layout. Grab it now.
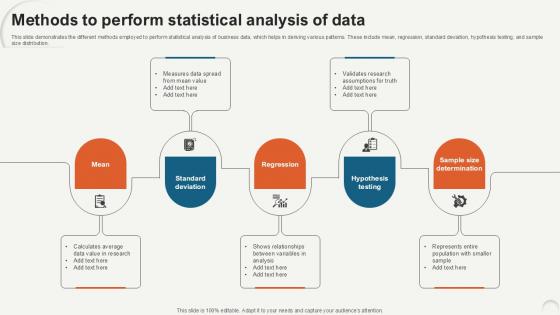
Methods To Perform Statistical Data Analytics For Informed Decision Ppt Presentation
This slide demonstrates the different methods employed to perform statistical analysis of business data, which helps in deriving various patterns. These include mean, regression, standard deviation, hypothesis testing, and sample size distribution. The best PPT templates are a great way to save time, energy, and resources. Slidegeeks have 100 percent editable powerpoint slides making them incredibly versatile. With these quality presentation templates, you can create a captivating and memorable presentation by combining visually appealing slides and effectively communicating your message. Download Methods To Perform Statistical Data Analytics For Informed Decision Ppt Presentation from Slidegeeks and deliver a wonderful presentation. This slide demonstrates the different methods employed to perform statistical analysis of business data, which helps in deriving various patterns. These include mean, regression, standard deviation, hypothesis testing, and sample size distribution.
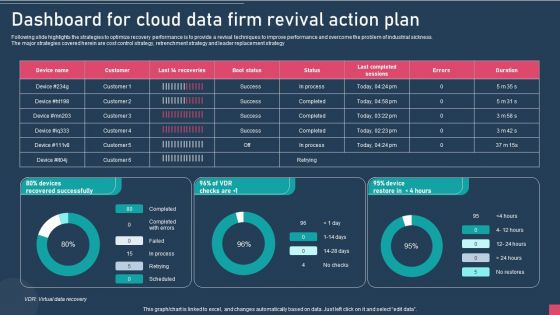
Dashboard For Cloud Data Firm Revival Action Plan Summary PDF
Following slide highlights the strategies to optimize recovery performance is to provide a revival techniques to improve performance and overcome the problem of industrial sickness. The major strategies covered herein are cost control strategy, retrenchment strategy and leader replacement strategy. Pitch your topic with ease and precision using this Dashboard For Cloud Data Firm Revival Action Plan Summary PDF. This layout presents information on Device, Success, Process. It is also available for immediate download and adjustment. So, changes can be made in the color, design, graphics or any other component to create a unique layout.
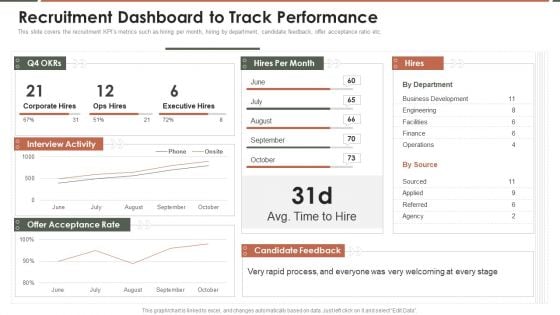
Talent Acquisition Marketing Recruitment Dashboard To Track Performance Demonstration PDF
This slide covers the recruitment KPIs metrics such as hiring per month, hiring by department, candidate feedback, offer acceptance ratio etc. Deliver and pitch your topic in the best possible manner with this Talent Acquisition Marketing Recruitment Dashboard To Track Performance Demonstration PDF. Use them to share invaluable insights on Interview Activity, Candidate Feedback, Everyone Welcoming and impress your audience. This template can be altered and modified as per your expectations. So, grab it now.
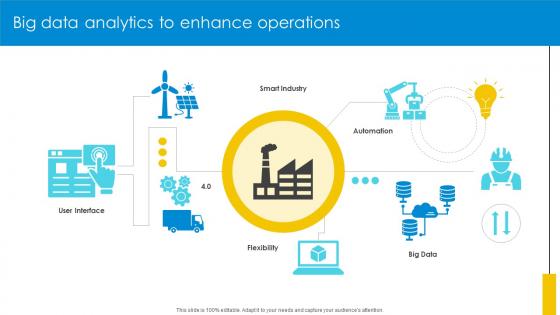
Big Data Analytics To Enhance Operations Optimizing Inventory Management IoT SS V
If your project calls for a presentation, then Slidegeeks is your go-to partner because we have professionally designed, easy-to-edit templates that are perfect for any presentation. After downloading, you can easily edit Big Data Analytics To Enhance Operations Optimizing Inventory Management IoT SS V and make the changes accordingly. You can rearrange slides or fill them with different images. Check out all the handy templates Our Big Data Analytics To Enhance Operations Optimizing Inventory Management IoT SS V are topically designed to provide an attractive backdrop to any subject. Use them to look like a presentation pro.
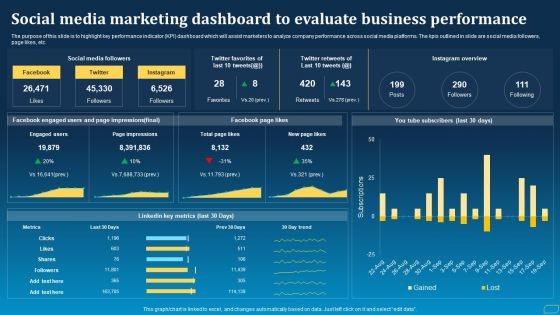
Direct Marketing Techniques To Enhance Business Presence Social Media Marketing Dashboard To Evaluate Rules PDF
The purpose of this slide is to highlight key performance indicator KPI dashboard which will assist marketers to analyze company performance across social media platforms. The kpis outlined in slide are social media followers, page likes, etc. Make sure to capture your audiences attention in your business displays with our gratis customizable Direct Marketing Techniques To Enhance Business Presence Social Media Marketing Dashboard To Evaluate Rules PDF. These are great for business strategies, office conferences, capital raising or task suggestions. If you desire to acquire more customers for your tech business and ensure they stay satisfied, create your own sales presentation with these plain slides.
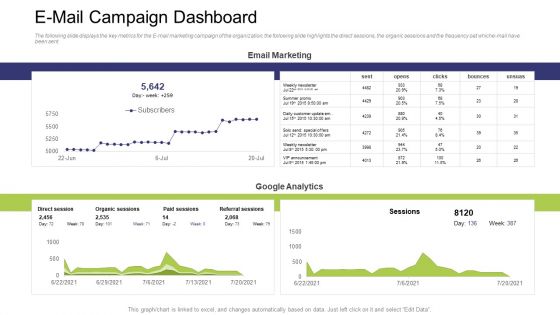
E Mail Campaign Dashboard Ppt Infographic Template Clipart Images PDF
The following slide displays the key metrics for the E-mail marketing campaign of the organization, the following slide highlights the direct sessions, the organic sessions and the frequency oat whiche-mail have been sent Deliver and pitch your topic in the best possible manner with this e mail campaign dashboard ppt infographic template clipart images pdf. Use them to share invaluable insights on direct session, paid sessions, organic sessions, referral sessions and impress your audience. This template can be altered and modified as per your expectations. So, grab it now.
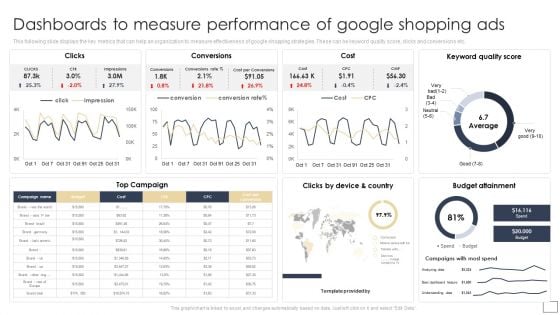
Dashboards To Measure Performance Of Google Shopping Ads Summary PDF
This following slide displays the key metrics that can help an organization to measure effectiveness of google shopping strategies. These can be keyword quality score, clicks and conversions etc.Want to ace your presentation in front of a live audience Our Dashboards To Measure Performance Of Google Shopping Ads Summary PDF can help you do that by engaging all the users towards you. Slidegeeks experts have put their efforts and expertise into creating these impeccable powerpoint presentations so that you can communicate your ideas clearly. Moreover, all the templates are customizable, and easy-to-edit and downloadable. Use these for both personal and commercial use.
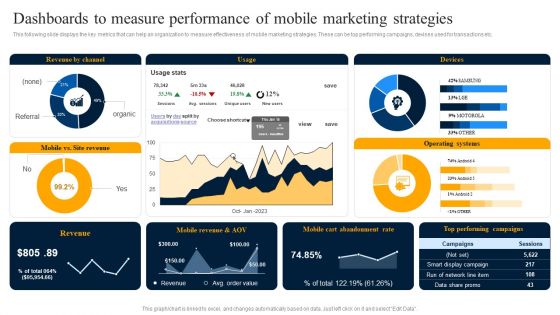
Dashboards To Measure Performance Of Mobile Marketing Strategies Rules PDF
This following slide displays the key metrics that can help an organization to measure effectiveness of mobile marketing strategies. These can be top performing campaigns, devises used for transactions etc. If your project calls for a presentation, then Slidegeeks is your go to partner because we have professionally designed, easy to edit templates that are perfect for any presentation. After downloading, you can easily edit Dashboards To Measure Performance Of Mobile Marketing Strategies Rules PDF and make the changes accordingly. You can rearrange slides or fill them with different images. Check out all the handy templates.
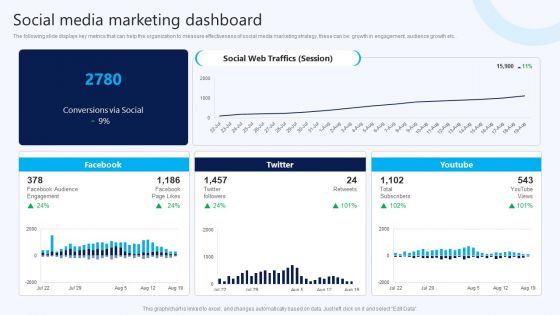
Social Media Marketing Dashboard B2B Electronic Commerce Startup Microsoft PDF
The following slide displays key metrics that can help the organization to measure effectiveness of social media marketing strategy, these can be growth in engagement, audience growth etc. Present like a pro with Social Media Marketing Dashboard B2B Electronic Commerce Startup Microsoft PDF Create beautiful presentations together with your team, using our easy-to-use presentation slides. Share your ideas in real-time and make changes on the fly by downloading our templates. So whether you are in the office, on the go, or in a remote location, you can stay in sync with your team and present your ideas with confidence. With Slidegeeks presentation got a whole lot easier. Grab these presentations today.
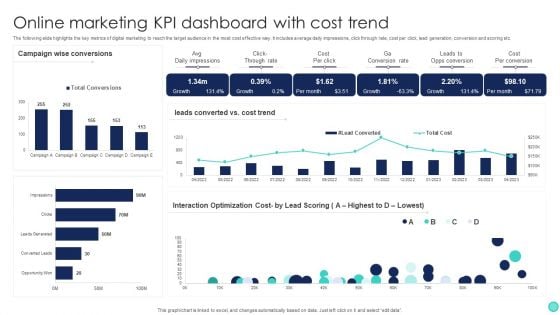
Online Marketing KPI Dashboard With Cost Trend Slides PDF
The following slide highlights the key metrics of digital marketing to reach the target audience in the most cost effective way. It includes average daily impressions, click through rate, cost per click, lead generation, conversion and scoring etc. Pitch your topic with ease and precision using this Online Marketing KPI Dashboard With Cost Trend Slides PDF. This layout presents information on Average Daily Impressions, Click Through Rate, Cost Per Click, Lead Generation, Conversion And Scoring. It is also available for immediate download and adjustment. So, changes can be made in the color, design, graphics or any other component to create a unique layout.
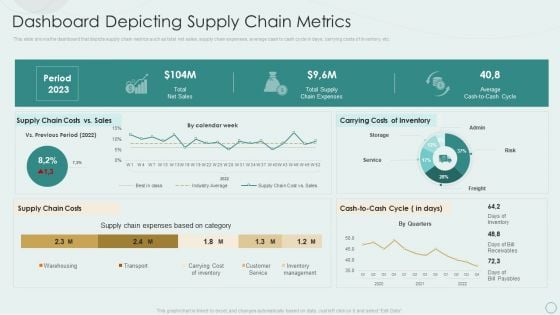
Learning Various Supply Chain Models Dashboard Depicting Supply Chain Metrics Pictures PDF
This slide shows the dashboard that depicts supply chain metrics such as total net sales, supply chain expenses, average cash to cash cycle in days, carrying costs of inventory, etc. Deliver an awe inspiring pitch with this creative Learning Various Supply Chain Models Dashboard Depicting Supply Chain Metrics Pictures PDF bundle. Topics like Period 2023, Total Net Sales, Carrying Costs Inventory, Supply Chain Costs can be discussed with this completely editable template. It is available for immediate download depending on the needs and requirements of the user.
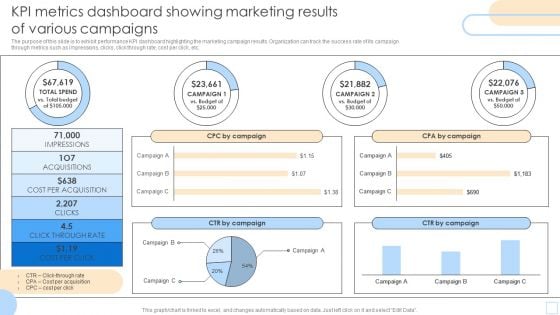
KPI Metrics Dashboard Showing Marketing Results Of Various Campaigns Pictures PDF
The purpose of this slide is to exhibit performance KPI dashboard highlighting the marketing campaign results. Organization can track the success rate of its campaign through metrics such as impressions, clicks, click through rate, cost per click, etc. Pitch your topic with ease and precision using this KPI Metrics Dashboard Showing Marketing Results Of Various Campaigns Pictures PDF. This layout presents information on Impressions, Acquisitions, CPA By Campaign. It is also available for immediate download and adjustment. So, changes can be made in the color, design, graphics or any other component to create a unique layout.
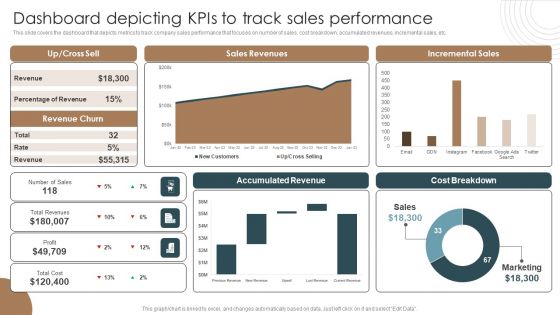
Dashboard Depicting Kpis To Track Sales Performance Integrating Technology To Transform Change Portrait PDF
This slide covers the dashboard that depicts metrics to track company sales performance that focuses on number of sales, cost breakdown, accumulated revenues, incremental sales, etc.If you are looking for a format to display your unique thoughts, then the professionally designed Dashboard Depicting Kpis To Track Sales Performance Integrating Technology To Transform Change Portrait PDF is the one for you. You can use it as a Google Slides template or a PowerPoint template. Incorporate impressive visuals, symbols, images, and other charts. Modify or reorganize the text boxes as you desire. Experiment with shade schemes and font pairings. Alter, share or cooperate with other people on your work. Download Dashboard Depicting Kpis To Track Sales Performance Integrating Technology To Transform Change Portrait PDF and find out how to give a successful presentation. Present a perfect display to your team and make your presentation unforgettable.
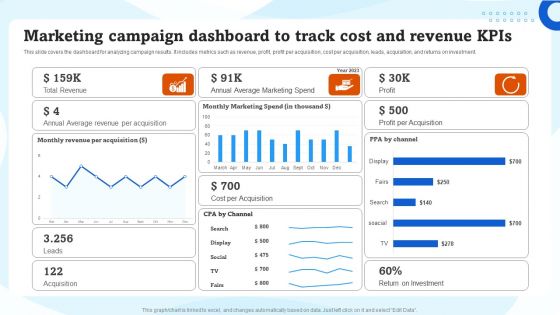
Marketing Campaign Dashboard To Track Cost And Revenue Kpis Ppt Infographics Good PDF
This slide covers the dashboard for analyzing campaign results. It includes metrics such as revenue, profit, profit per acquisition, cost per acquisition, leads, acquisition, and returns on investment. Formulating a presentation can take up a lot of effort and time, so the content and message should always be the primary focus. The visuals of the PowerPoint can enhance the presenters message, so our Marketing Campaign Dashboard To Track Cost And Revenue Kpis Ppt Infographics Good PDF was created to help save time. Instead of worrying about the design, the presenter can concentrate on the message while our designers work on creating the ideal templates for whatever situation is needed. Slidegeeks has experts for everything from amazing designs to valuable content, we have put everything into Marketing Campaign Dashboard To Track Cost And Revenue Kpis Ppt Infographics Good PDF.
Facts Assessment BI Applications Dashboards Ppt PowerPoint Presentation Icon Themes PDF
Presenting this set of slides with name facts assessment bi applications dashboards ppt powerpoint presentation icon themes pdf. This is a nine stage process. The stages in this process are data warehouse, data mining, data cleansing, business activity monitoring, digital dashboards, local information systems, online analytical processing, spreadsheets. This is a completely editable PowerPoint presentation and is available for immediate download. Download now and impress your audience.
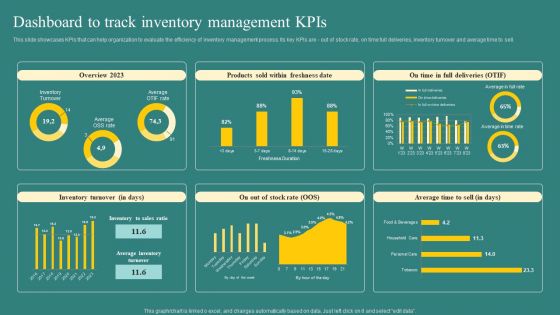
Dashboard To Track Inventory Management Kpis Professional PDF
This slide showcases KPIs that can help organization to evaluate the efficiency of inventory management process. Its key KPIs are out of stock rate, on time full deliveries, inventory turnover and average time to sell. This Dashboard To Track Inventory Management Kpis Professional PDF from Slidegeeks makes it easy to present information on your topic with precision. It provides customization options, so you can make changes to the colors, design, graphics, or any other component to create a unique layout. It is also available for immediate download, so you can begin using it right away. Slidegeeks has done good research to ensure that you have everything you need to make your presentation stand out. Make a name out there for a brilliant performance.
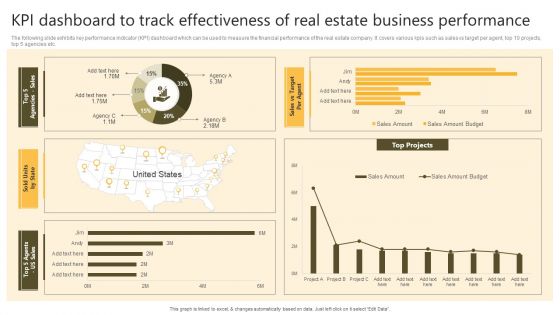
Successful Risk Administration KPI Dashboard To Track Effectiveness Of Real Estate Business Template PDF
The following slide exhibits key performance indicator KPI dashboard which can be used to measure the financial performance of the real estate company. It covers various kpis such as sales vs target per agent, top 10 projects, top 5 agencies etc. If your project calls for a presentation, then Slidegeeks is your go-to partner because we have professionally designed, easy-to-edit templates that are perfect for any presentation. After downloading, you can easily edit Successful Risk Administration KPI Dashboard To Track Effectiveness Of Real Estate Business Template PDF and make the changes accordingly. You can rearrange slides or fill them with different images. Check out all the handy templates.
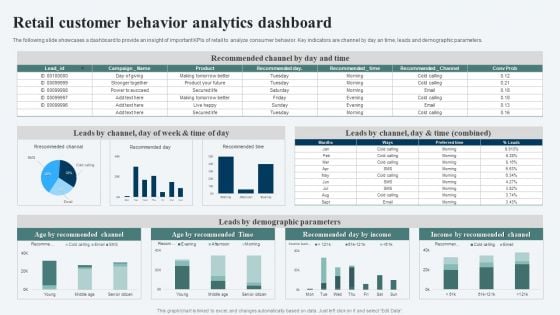
Retail Customer Behavior Analytics Dashboard Ppt Ideas Templates PDF
The following slide showcases a dashboard to provide an insight of important KPIs of retail to analyze consumer behavior. Key indicators are channel by day an time, leads and demographic parameters. Showcasing this set of slides titled Retail Customer Behavior Analytics Dashboard Ppt Ideas Templates PDF. The topics addressed in these templates are Recommended Channel, Leads Demographic Parameters, Income Recommended Channel. All the content presented in this PPT design is completely editable. Download it and make adjustments in color, background, font etc. as per your unique business setting.
Building Quality Inspection Dashboard With Customer Satisfaction Ratio Icons PDF
The following slide showcases dashboard of construction company exhibiting quality KPIs regarding safety, workmanship and customer satisfaction. Key indicators covered are site inspection success level, CSR, defect count, net promoter score, promotors, passives, defectors, total rework cost, safety meetings and average time taken to fix defects. Showcasing this set of slides titled Building Quality Inspection Dashboard With Customer Satisfaction Ratio Icons PDF. The topics addressed in these templates are Construction Project, Customer Satisfaction Ratio, Promoters. All the content presented in this PPT design is completely editable. Download it and make adjustments in color, background, font etc. as per your unique business setting.
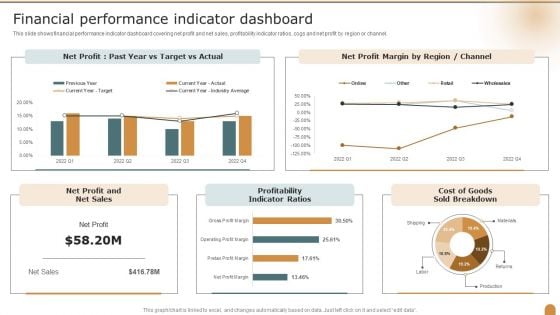
Financial Performance Indicator Dashboard Company Performance Evaluation Using KPI Structure PDF
This slide shows financial performance indicator dashboard covering net profit and net sales, profitability indicator ratios, cogs and net profit by region or channel. Deliver and pitch your topic in the best possible manner with this Financial Performance Indicator Dashboard Company Performance Evaluation Using KPI Structure PDF. Use them to share invaluable insights on Financial Performance, Indicator Dashboard, Profitability Indicator and impress your audience. This template can be altered and modified as per your expectations. So, grab it now.
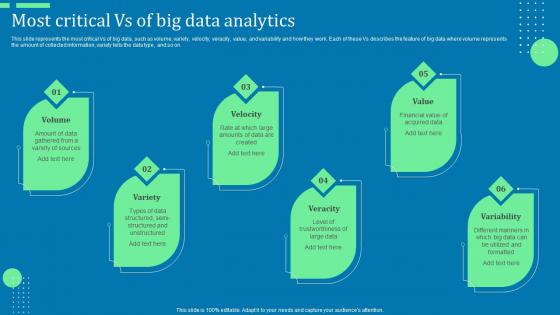
Most Critical Vs Of Big Data Analytics Advanced Tools For Hyperautomation Ppt Summary Rules Pdf
This slide represents the most critical Vs of big data, such as volume, variety, velocity, veracity, value, and variability and how they work. Each of these Vs describes the feature of big data where volume represents the amount of collected information, variety tells the data type, and so on. Slidegeeks is one of the best resources for PowerPoint templates. You can download easily and regulate Most Critical Vs Of Big Data Analytics Advanced Tools For Hyperautomation Ppt Summary Rules Pdf for your personal presentations from our wonderful collection. A few clicks is all it takes to discover and get the most relevant and appropriate templates. Use our Templates to add a unique zing and appeal to your presentation and meetings. All the slides are easy to edit and you can use them even for advertisement purposes. This slide represents the most critical Vs of big data, such as volume, variety, velocity, veracity, value, and variability and how they work. Each of these Vs describes the feature of big data where volume represents the amount of collected information, variety tells the data type, and so on.

Workflow For Augmented Technologies Data Mesh Management Pictures Pdf
The following slide highlights augmented data mesh management workflow. It includes components such as system of record comprised of core processing systems, external data, unstructured data, data platforms comprised of data warehouse, raw data lake, operational data store, etc. Showcasing this set of slides titled Workflow For Augmented Technologies Data Mesh Management Pictures Pdf. The topics addressed in these templates are Central Processing Systems, External Data, Unorganized Data. All the content presented in this PPT design is completely editable. Download it and make adjustments in color, background, font etc. as per your unique business setting. The following slide highlights augmented data mesh management workflow. It includes components such as system of record comprised of core processing systems, external data, unstructured data, data platforms comprised of data warehouse, raw data lake, operational data store, etc.
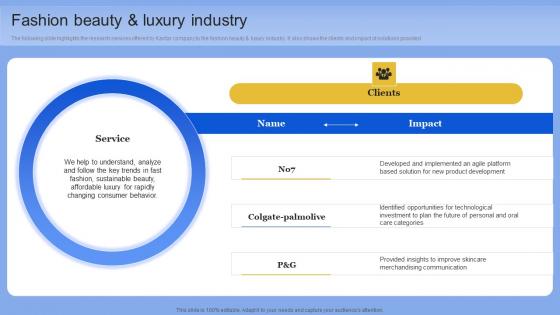
Fashion Beauty And Luxury Industry Data Analytics Company Outline Graphics PDF
The following slide highlights the research services offered by Kantar company to the fashion beauty and luxury industry. It also shows the clients and impact of solutions provided. Find highly impressive Fashion Beauty And Luxury Industry Data Analytics Company Outline Graphics PDF on Slidegeeks to deliver a meaningful presentation. You can save an ample amount of time using these presentation templates. No need to worry to prepare everything from scratch because Slidegeeks experts have already done a huge research and work for you. You need to download Fashion Beauty And Luxury Industry Data Analytics Company Outline Graphics PDF for your upcoming presentation. All the presentation templates are 100 percent editable and you can change the color and personalize the content accordingly. Download now The following slide highlights the research services offered by Kantar company to the fashion beauty and luxury industry. It also shows the clients and impact of solutions provided
Dashboard For Tracking Business And IT Alignment Ppt PowerPoint Presentation File Background Images PDF
This slide depicts the dashboard for business and IT alignment by covering details of total sales, customer support service, percentage of business operations aligned IT, usage of communication channels, and top performer associates. The Dashboard For Tracking Business And IT Alignment Ppt PowerPoint Presentation File Background Images PDF is a compilation of the most recent design trends as a series of slides. It is suitable for any subject or industry presentation, containing attractive visuals and photo spots for businesses to clearly express their messages. This template contains a variety of slides for the user to input data, such as structures to contrast two elements, bullet points, and slides for written information. Slidegeeks is prepared to create an impression.
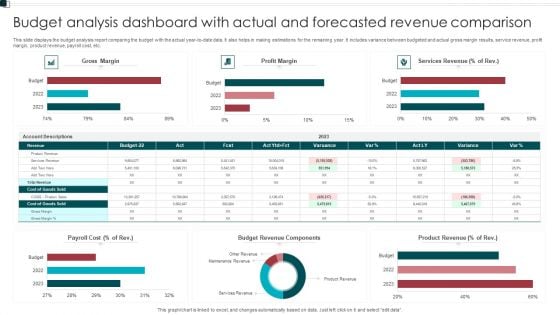
Budget Analysis Dashboard With Actual And Forecasted Revenue Comparison Structure PDF
This slide displays the budget analysis report comparing the budget with the actual year to date data. It also helps in making estimations for the remaining year. It includes variance between budgeted and actual gross margin results, service revenue, profit margin, product revenue, payroll cost, etc. Pitch your topic with ease and precision using this Budget Analysis Dashboard With Actual And Forecasted Revenue Comparison Structure PDF. This layout presents information on Payroll Cost, Budget Revenue Components, Product Revenue. It is also available for immediate download and adjustment. So, changes can be made in the color, design, graphics or any other component to create a unique layout.
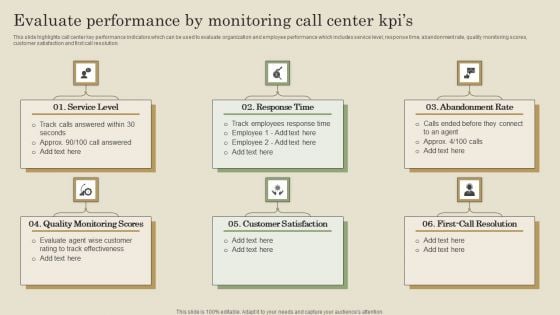
Evaluate Performance By Monitoring Call Center Kpis Ppt PowerPoint Presentation File Diagrams PDF
This slide highlights call center key performance indicators which can be used to evaluate organization and employee performance which includes service level, response time, abandonment rate, quality monitoring scores, customer satisfaction and first call resolution. Present like a pro with Evaluate Performance By Monitoring Call Center Kpis Ppt PowerPoint Presentation File Diagrams PDF Create beautiful presentations together with your team, using our easy to use presentation slides. Share your ideas in real time and make changes on the fly by downloading our templates. So whether you are in the office, on the go, or in a remote location, you can stay in sync with your team and present your ideas with confidence. With Slidegeeks presentation got a whole lot easier. Grab these presentations today.
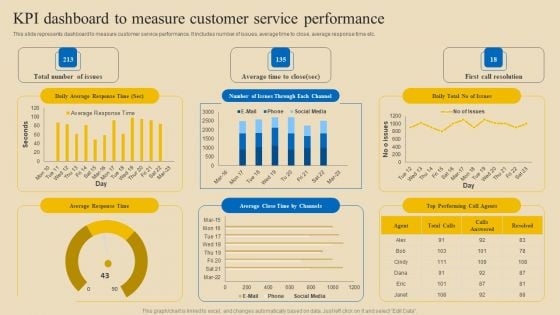
Implementing Digital Customer Service Kpi Dashboard To Measure Customer Service Structure PDF
This slide represents dashboard to measure customer service performance. It includes number of issues, average time to close, average response time etc. Explore a selection of the finest Implementing Digital Customer Service Kpi Dashboard To Measure Customer Service Structure PDF here. With a plethora of professionally designed and pre-made slide templates, you can quickly and easily find the right one for your upcoming presentation. You can use our Implementing Digital Customer Service Kpi Dashboard To Measure Customer Service Structure PDF to effectively convey your message to a wider audience. Slidegeeks has done a lot of research before preparing these presentation templates. The content can be personalized and the slides are highly editable. Grab templates today from Slidegeeks.

Quarterly Recruiting Report Status For Various Departments Quarterly Report Ppt Slide
Following slide demonstrates quarterly hiring status which assist organizations to assess overall success of recruitment campaign and identify areas for improvement. This slide provides data regarding various organizational departments, job position and four quarters. Get a simple yet stunning designed Quarterly Recruiting Report Status For Various Departments Quarterly Report Ppt Slide It is the best one to establish the tone in your meetings. It is an excellent way to make your presentations highly effective. So, download this PPT today from Slidegeeks and see the positive impacts. Our easy-to-edit Quarterly Recruiting Report Status For Various Departments Quarterly Report Ppt Slide can be your go-to option for all upcoming conferences and meetings. So, what are you waiting for Grab this template today. Following slide demonstrates quarterly hiring status which assist organizations to assess overall success of recruitment campaign and identify areas for improvement. This slide provides data regarding various organizational departments, job position and four quarters.
Demographic Data Dashboard Ppt PowerPoint Presentation Complete Deck With Slides
If designing a presentation takes a lot of your time and resources and you are looking for a better alternative, then this Demographic Data Dashboard Ppt PowerPoint Presentation Complete Deck With Slides is the right fit for you. This is a prefabricated set that can help you deliver a great presentation on the topic. All the twelve slides included in this sample template can be used to present a birds eye view of the topic. These slides are also fully editable, giving you enough freedom to add specific details to make this layout more suited to your business setting. Apart from the content, all other elements like color, design, theme are also replaceable and editable. This helps in designing a variety of presentations with a single layout. Not only this, you can use this PPT design in formats like PDF, PNG, and JPG once downloaded. Therefore, without any further ado, download and utilize this sample presentation as per your liking.
Internet Security And Data Audit Icon Pictures Pdf
Pitch your topic with ease and precision using this Internet Security And Data Audit Icon Pictures Pdf This layout presents information on Internet Security, Data Audit Icon It is also available for immediate download and adjustment. So, changes can be made in the color, design, graphics or any other component to create a unique layout. Our Internet Security And Data Audit Icon Pictures Pdf are topically designed to provide an attractive backdrop to any subject. Use them to look like a presentation pro.


 Continue with Email

 Home
Home


