Snapshot
Sustainable Primary Components Of Green Data Center
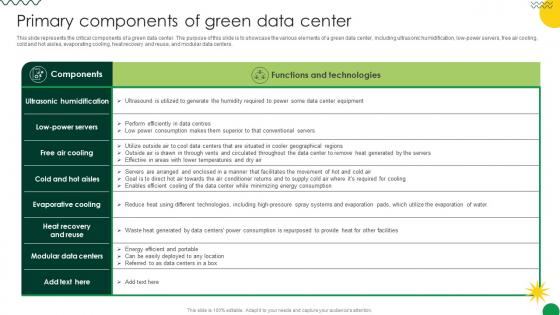
This slide represents the critical components of a green data center. The purpose of this slide is to showcase the various elements of a green data center, including ultrasonic humidification, low-power servers, free air cooling, cold and hot aisles, evaporating cooling, heat recovery and reuse, and modular data centers. If your project calls for a presentation, then Slidegeeks is your go-to partner because we have professionally designed, easy-to-edit templates that are perfect for any presentation. After downloading, you can easily edit Sustainable Primary Components Of Green Data Center and make the changes accordingly. You can rearrange slides or fill them with different images. Check out all the handy templates This slide represents the critical components of a green data center. The purpose of this slide is to showcase the various elements of a green data center, including ultrasonic humidification, low-power servers, free air cooling, cold and hot aisles, evaporating cooling, heat recovery and reuse, and modular data centers.
Construction Site Safety Measure KPI Dashboard To Track Safety Program Performance Slides PDF
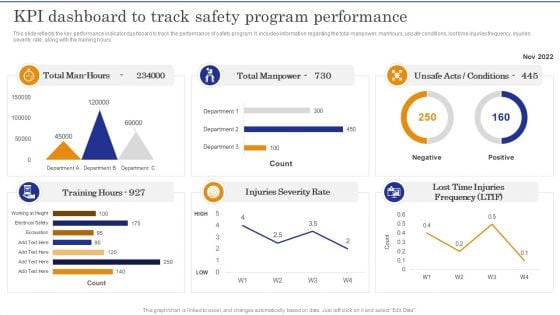
This slide reflects the key performance indicator dashboard to track the performance of safety program. It includes information regarding the total manpower, manhours, unsafe conditions, lost time injuries frequency, injuries severity rate, along with the training hours.Slidegeeks has constructed Construction Site Safety Measure KPI Dashboard To Track Safety Program Performance Slides PDF after conducting extensive research and examination. These presentation templates are constantly being generated and modified based on user preferences and critiques from editors. Here, you will find the most attractive templates for a range of purposes while taking into account ratings and remarks from users regarding the content. This is an excellent jumping-off point to explore our content and will give new users an insight into our top-notch PowerPoint Templates.
Adopting Flexible Work Policy Work From Home Performance Management Dashboard Demonstration PDF
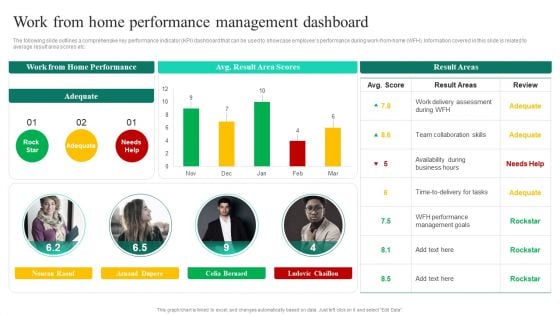
The following slide outlines a comprehensive key performance indicator KPI dashboard that can be used to showcase employees performance during work-from-home WFH. Information covered in this slide is related to average result area scores etc. Slidegeeks is one of the best resources for PowerPoint templates. You can download easily and regulate Adopting Flexible Work Policy Work From Home Performance Management Dashboard Demonstration PDF for your personal presentations from our wonderful collection. A few clicks is all it takes to discover and get the most relevant and appropriate templates. Use our Templates to add a unique zing and appeal to your presentation and meetings. All the slides are easy to edit and you can use them even for advertisement purposes.
Search Engine Marketing Keyword Performance Analysis With Kpi Dashboard Brochure PDF
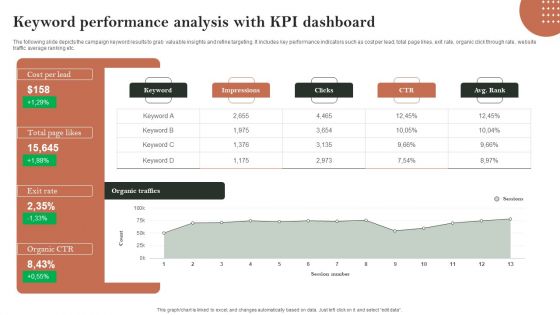
The following slide depicts the campaign keyword results to grab valuable insights and refine targeting. It includes key performance indicators such as cost per lead, total page likes, exit rate, organic click through rate, website traffic average ranking etc. Get a simple yet stunning designed Search Engine Marketing Keyword Performance Analysis With Kpi Dashboard Brochure PDF. It is the best one to establish the tone in your meetings. It is an excellent way to make your presentations highly effective. So, download this PPT today from Slidegeeks and see the positive impacts. Our easy-to-edit Search Engine Marketing Keyword Performance Analysis With Kpi Dashboard Brochure PDF can be your go-to option for all upcoming conferences and meetings. So, what are you waiting for Grab this template today.
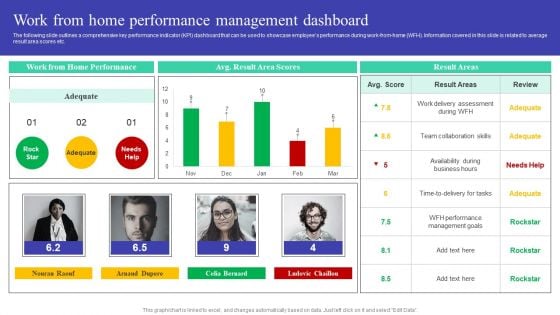
Implementing Adaptive Work Arrangements Work From Home Performance Management Dashboard Elements PDF
The following slide outlines a comprehensive key performance indicator KPI dashboard that can be used to showcase employees performance during work-from-home WFH. Information covered in this slide is related to average result area scores etc. Slidegeeks has constructed Implementing Adaptive Work Arrangements Work From Home Performance Management Dashboard Elements PDF after conducting extensive research and examination. These presentation templates are constantly being generated and modified based on user preferences and critiques from editors. Here, you will find the most attractive templates for a range of purposes while taking into account ratings and remarks from users regarding the content. This is an excellent jumping off point to explore our content and will give new users an insight into our top notch PowerPoint Templates.
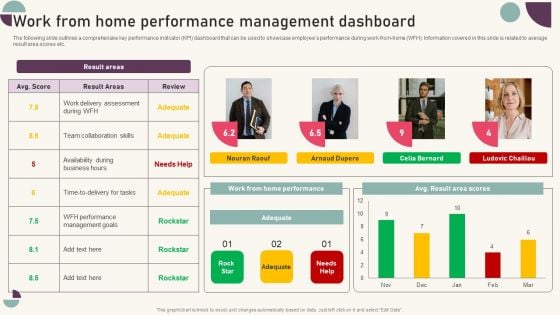
Tactics For Establishing Sustainable Hybrid Work Environment Work From Home Performance Management Dashboard Information PDF
The following slide outlines a comprehensive key performance indicator KPI dashboard that can be used to showcase employees performance during work-from-home WFH. Information covered in this slide is related to average result area scores etc. Want to ace your presentation in front of a live audience Our Tactics For Establishing Sustainable Hybrid Work Environment Work From Home Performance Management Dashboard Information PDF can help you do that by engaging all the users towards you. Slidegeeks experts have put their efforts and expertise into creating these impeccable powerpoint presentations so that you can communicate your ideas clearly. Moreover, all the templates are customizable, and easy to edit and downloadable. Use these for both personal and commercial use.
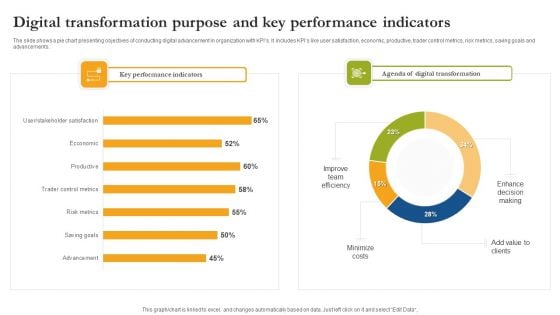
Digital Transformation Purpose And Key Performance Indicators Formats PDF
The slide shows a pie chart presenting objectives of conducting digital advancement in organization with KPIs. It includes KPIs like user satisfaction, economic, productive, trader control metrics, risk metrics, saving goals and advancements. Pitch your topic with ease and precision using this Digital Transformation Purpose And Key Performance Indicators Formats PDF. This layout presents information on Key Performance Indicators, Digital Transformation, Minimize Costs. It is also available for immediate download and adjustment. So, changes can be made in the color, design, graphics or any other component to create a unique layout.
Brand Recognition Overview Different Brands Performance Tracking Dashboard Brochure PDF
This slide provides information regarding different brands performance tracking dashboard in terms of brand metric, brand commitment, advertising metrics, and purchase metrics. Do you have to make sure that everyone on your team knows about any specific topic I yes, then you should give Brand Recognition Overview Different Brands Performance Tracking Dashboard Brochure PDF a try. Our experts have put a lot of knowledge and effort into creating this impeccable Brand Recognition Overview Different Brands Performance Tracking Dashboard Brochure PDF. You can use this template for your upcoming presentations, as the slides are perfect to represent even the tiniest detail. You can download these templates from the Slidegeeks website and these are easy to edit. So grab these today
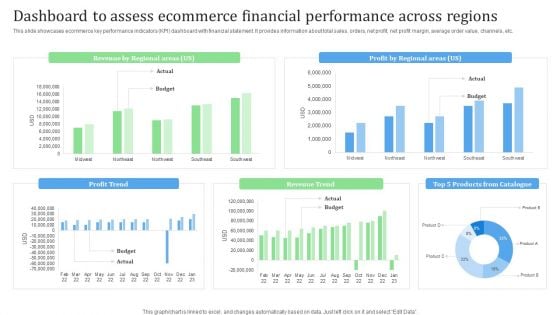
Dashboard To Assess Ecommerce Financial Performance Across Regions Financial Management Strategies Clipart PDF
This slide showcases ecommerce key performance indicators KPI dashboard with financial statement. It provides information about total sales, orders, net profit, net profit margin, average order value, channels, etc.Present like a pro with Dashboard To Assess Ecommerce Financial Performance Across Regions Financial Management Strategies Clipart PDF Create beautiful presentations together with your team, using our easy-to-use presentation slides. Share your ideas in real-time and make changes on the fly by downloading our templates. So whether you are in the office, on the go, or in a remote location, you can stay in sync with your team and present your ideas with confidence. With Slidegeeks presentation got a whole lot easier. Grab these presentations today.
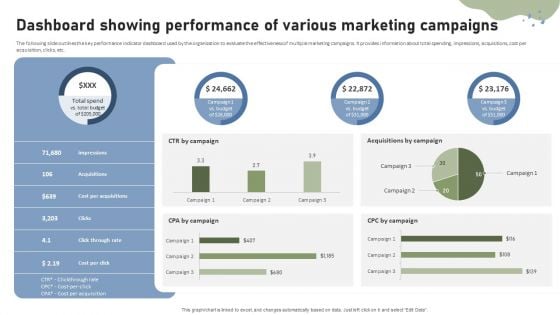
Brand Building Techniques Enhance Customer Engagement Loyalty Dashboard Showing Performance Rules PDF
The following slide outlines the key performance indicator dashboard used by the organization to evaluate the effectiveness of multiple marketing campaigns. It provides information about total spending, impressions, acquisitions, cost per acquisition, clicks, etc. Slidegeeks is one of the best resources for PowerPoint templates. You can download easily and regulate Brand Building Techniques Enhance Customer Engagement Loyalty Dashboard Showing Performance Rules PDF for your personal presentations from our wonderful collection. A few clicks is all it takes to discover and get the most relevant and appropriate templates. Use our Templates to add a unique zing and appeal to your presentation and meetings. All the slides are easy to edit and you can use them even for advertisement purposes.
You Tube Advertising Campaign Performance Analytics Dashboard Ppt Icon Diagrams PDF
This slide represents dashboard showing analytics of performance of you tube marketing campaign. It includes data related to no. of visitors, qualified leads, customers and annual recurring revenue, lifetime value, gross volume etc generated through the campaign. Showcasing this set of slides titled You Tube Advertising Campaign Performance Analytics Dashboard Ppt Icon Diagrams PDF. The topics addressed in these templates are Monthly Recurring Revenue, Bounce Rate, Customer Churn Rate. All the content presented in this PPT design is completely editable. Download it and make adjustments in color, background, font etc. as per your unique business setting.
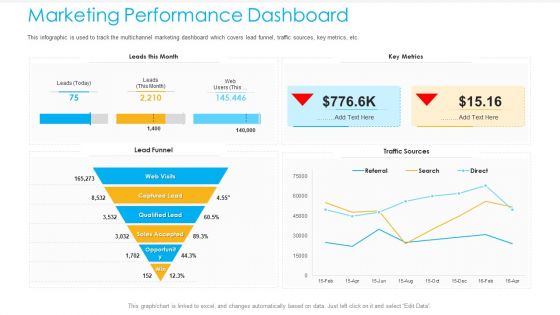
Unified Business To Consumer Marketing Strategy Marketing Performance Dashboard Introduction PDF
This infographic is used to track the multichannel marketing dashboard which covers lead funnel, traffic sources, key metrics, etc.Deliver an awe-inspiring pitch with this creative unified business to consumer marketing strategy marketing performance dashboard introduction pdf bundle. Topics like captured lead, qualified lead, sales accepted can be discussed with this completely editable template. It is available for immediate download depending on the needs and requirements of the user.

Data Analysis Types Provides By BI Mockup Pdf
This slide represents the type of analytics provided by the business intelligence for business performance enhancement. This includes descriptive analysis, diagnostic analysis, predictive analytics, etc. Pitch your topic with ease and precision using this Data Analysis Types Provides By BI Mockup Pdf. This layout presents information on Descriptive Analytics, Diagnostic Analytics, Predictive Analytics. It is also available for immediate download and adjustment. So, changes can be made in the color, design, graphics or any other component to create a unique layout. This slide represents the type of analytics provided by the business intelligence for business performance enhancement. This includes descriptive analysis, diagnostic analysis, predictive analytics, etc.
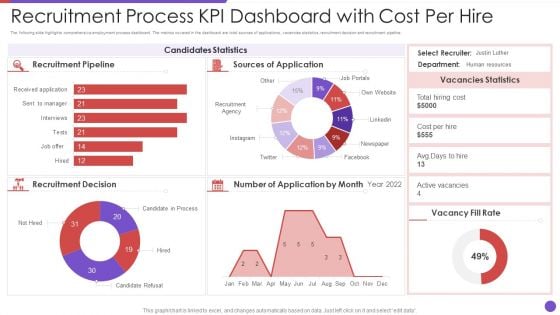
Recruitment Process KPI Dashboard With Cost Per Hire Demonstration PDF
The following slide highlights comprehensive employment process dashboard. The metrics covered in the dashboard are total sources of applications, vacancies statistics, recruitment decision and recruitment pipeline. Showcasing this set of slides titled recruitment process kpi dashboard with cost per hire demonstration pdf. The topics addressed in these templates are recruitment pipeline, resources, cost. All the content presented in this PPT design is completely editable. Download it and make adjustments in color, background, font etc. as per your unique business setting.
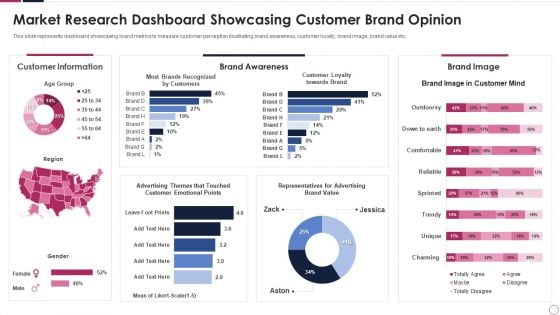
market research dashboard showcasing customer brand opinion background pdf
This slide represents dashboard showcasing brand metrics to measure customer perception illustrating brand awareness, customer loyalty, brand image, brand value etc. Showcasing this set of slides titled market research dashboard showcasing customer brand opinion background pdf. The topics addressed in these templates are market research dashboard showcasing customer brand opinion. All the content presented in this PPT design is completely editable. Download it and make adjustments in color, background, font etc. as per your unique business setting.
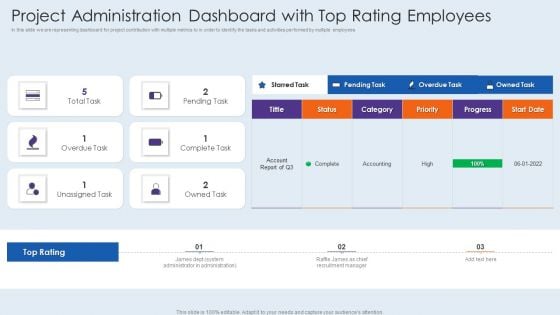
Project Administration Dashboard With Top Rating Employees Information PDF
In this slide we are representing dashboard for project contribution with multiple metrics to in order to identify the tasks and activities performed by multiple employees. Showcasing this set of slides titled project administration dashboard with top rating employees information pdf. The topics addressed in these templates are project administration dashboard with top rating employees. All the content presented in this PPT design is completely editable. Download it and make adjustments in color, background, font etc. as per your unique business setting.
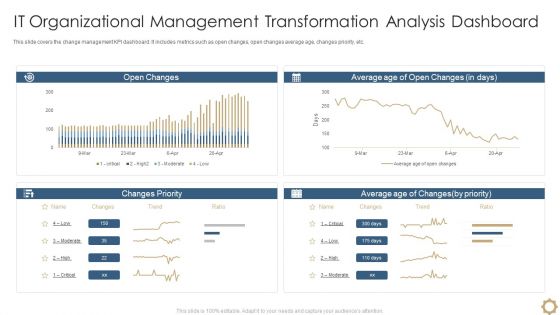
It Organizational Management Transformation Analysis Dashboard Download PDF
This slide covers the change management KPI dashboard. It includes metrics such as open changes, open changes average age, changes priority, etc. Showcasing this set of slides titled It Organizational Management Transformation Analysis Dashboard Download PDF. The topics addressed in these templates are It Organizational Management, Transformation Analysis Dashboard. All the content presented in this PPT design is completely editable. Download it and make adjustments in color, background, font etc. as per your unique business setting.
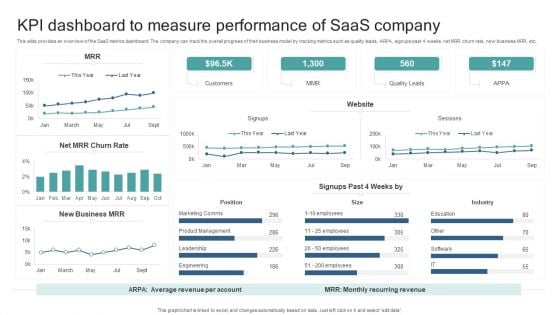
KPI Dashboard To Measure Performance Of Saas Company Introduction PDF
This slide provides an overview of the SaaS metrics dashboard. The company can track the overall progress of their business model by tracking metrics such as quality leads, ARPA, signups past 4 weeks, net MRR churn rate, new business MRR, etc. Pitch your topic with ease and precision using this KPI Dashboard To Measure Performance Of Saas Company Introduction PDF. This layout presents information on Industry, Position, Customers, Quality Leads. It is also available for immediate download and adjustment. So, changes can be made in the color, design, graphics or any other component to create a unique layout.
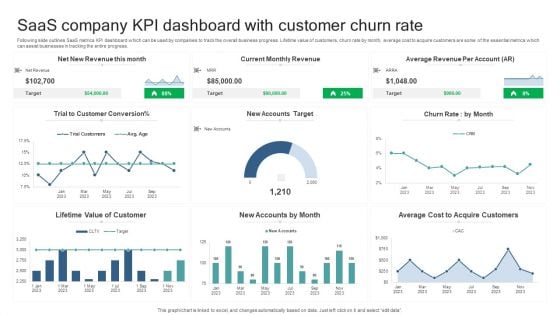
Saas Company KPI Dashboard With Customer Churn Rate Microsoft PDF
Following slide outlines SaaS metrics KPI dashboard which can be used by companies to track the overall business progress. Lifetime value of customers, churn rate by month, average cost to acquire customers are some of the essential metrics which can assist businesses in tracking the entire progress. Pitch your topic with ease and precision using this Saas Company KPI Dashboard With Customer Churn Rate Microsoft PDF. This layout presents information on Lifetime Value Of Customer, New Accounts By Month, Average Cost Acquire Customers. It is also available for immediate download and adjustment. So, changes can be made in the color, design, graphics or any other component to create a unique layout.
Online Risk Management Dashboard For Tracking Threats And Attacks Icons PDF
The purpose of this slide is to represent dashboard to monitor risks and cyber threats for efficient risk management. It includes various types of key performance indicators such as types of risks, severities, sources and risk meter. Showcasing this set of slides titled Online Risk Management Dashboard For Tracking Threats And Attacks Icons PDF. The topics addressed in these templates are Attack, Indication Severities, Sources. All the content presented in this PPT design is completely editable. Download it and make adjustments in color, background, font etc. as per your unique business setting.
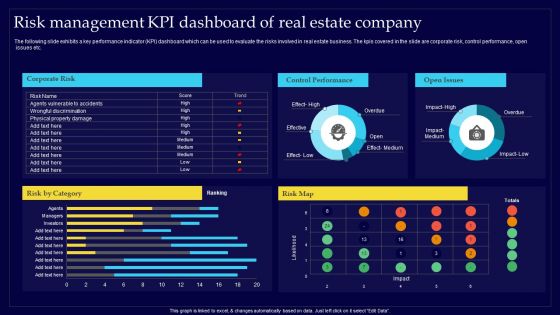
Executing Risk Mitigation Risk Management KPI Dashboard Of Real Estate Company Portrait PDF
The following slide exhibits a key performance indicator KPI dashboard which can be used to evaluate the risks involved in real estate business. The kpis covered in the slide are corporate risk, control performance, open issues etc. This modern and well-arranged Executing Risk Mitigation Risk Management KPI Dashboard Of Real Estate Company Portrait PDF provides lots of creative possibilities. It is very simple to customize and edit with the Powerpoint Software. Just drag and drop your pictures into the shapes. All facets of this template can be edited with Powerpoint, no extra software is necessary. Add your own material, put your images in the places assigned for them, adjust the colors, and then you can show your slides to the world, with an animated slide included.

Ultimate Guide To Developing Kpis To Measure Effectiveness Of Content On Auto Dealer Strategy SS V
This slide covers metrics to evaluate effectiveness of content posted on dealers website. The purpose of this template is to provide an overview on top key performance indicators determining success of content such as user behavior, engagement, SEO outcomes, company revenue generation, etc. The Ultimate Guide To Developing Kpis To Measure Effectiveness Of Content On Auto Dealer Strategy SS V is a compilation of the most recent design trends as a series of slides. It is suitable for any subject or industry presentation, containing attractive visuals and photo spots for businesses to clearly express their messages. This template contains a variety of slides for the user to input data, such as structures to contrast two elements, bullet points, and slides for written information. Slidegeeks is prepared to create an impression. This slide covers metrics to evaluate effectiveness of content posted on dealers website. The purpose of this template is to provide an overview on top key performance indicators determining success of content such as user behavior, engagement, SEO outcomes, company revenue generation, etc.
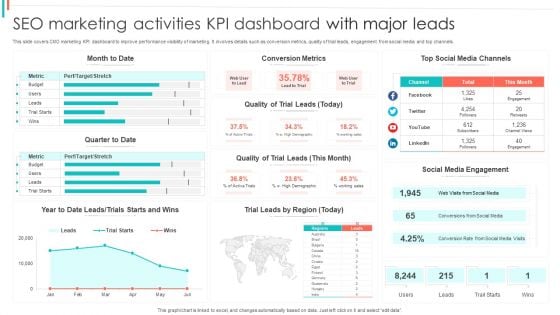
SEO Marketing Activities KPI Dashboard With Major Leads Formats PDF
This slide covers CMO marketing KPI dashboard to improve performance visibility of marketing. It involves details such as conversion metrics, quality of trial leads, engagement from social media and top channels.Showcasing this set of slides titled SEO Marketing Activities KPI Dashboard With Major Leads Formats PDF. The topics addressed in these templates are Conversion Metrics, Media Engagement, Conversion Rate. All the content presented in this PPT design is completely editable. Download it and make adjustments in color, background, font etc. as per your unique business setting.
Construction Project Tracking And Control KPI Dashboard Summary PDF
Mentioned slide displays construction project monitoring and control KPI dashboard which can be used by construction manager to track various metrics. Construction manager can track metrics like project work status, projects by stages, project completion percentage, utilized duration, budget variance , workload etc. Showcasing this set of slides titled Construction Project Tracking And Control KPI Dashboard Summary PDF. The topics addressed in these templates are Budget Variance, Resources By Project, Utilized Duration. All the content presented in this PPT design is completely editable. Download it and make adjustments in color, background, font etc. as per your unique business setting.
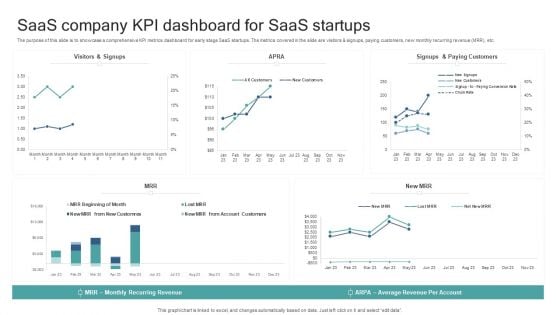
Saas Company KPI Dashboard For Saas Startups Background PDF
The purpose of this slide is to showcase a comprehensive KPI metrics dashboard for early stage SaaS startups. The metrics covered in the slide are visitors and signups, paying customers, new monthly recurring revenue MRR, etc. Showcasing this set of slides titled Saas Company KPI Dashboard For Saas Startups Background PDF. The topics addressed in these templates are Average Revenue Per Account, Monthly Recurring Revenue. All the content presented in this PPT design is completely editable. Download it and make adjustments in color, background, font etc. as per your unique business setting.
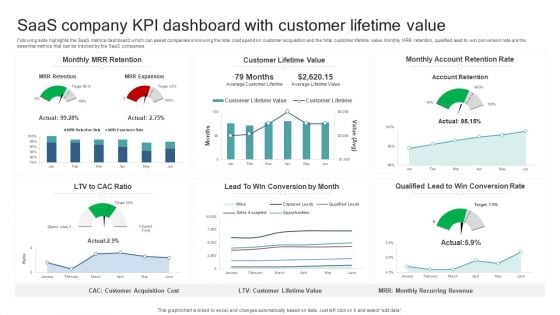
Saas Company KPI Dashboard With Customer Lifetime Value Professional PDF
Following slide highlights the SaaS metrics dashboard which can assist companies in knowing the total cost spend on customer acquisition and the total customer lifetime value. Monthly MRR retention, qualified lead to win conversion rate are the essential metrics that can be tracked by the SaaS companies. Showcasing this set of slides titled Saas Company KPI Dashboard With Customer Lifetime Value Professional PDF. The topics addressed in these templates are Monthly Mrr Retention, Customer Lifetime Value, Monthly Account Retention Rate. All the content presented in this PPT design is completely editable. Download it and make adjustments in color, background, font etc. as per your unique business setting.
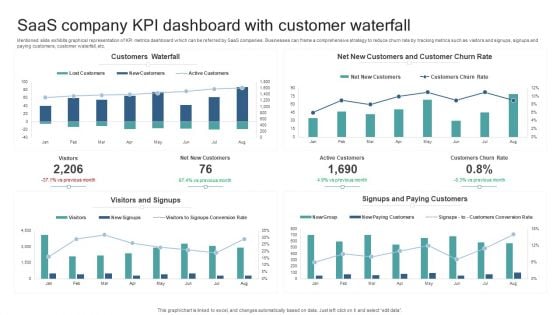
Saas Company KPI Dashboard With Customer Waterfall Slides PDF
Mentioned slide exhibits graphical representation of KPI metrics dashboard which can be referred by SaaS companies. Businesses can frame a comprehensive strategy to reduce churn rate by tracking metrics such as visitors and signups, signups and paying customers, customer waterfall, etc. Pitch your topic with ease and precision using this Saas Company KPI Dashboard With Customer Waterfall Slides PDF. This layout presents information on Customers Waterfall, Visitors And Signups, Signups And Paying Customers. It is also available for immediate download and adjustment. So, changes can be made in the color, design, graphics or any other component to create a unique layout.
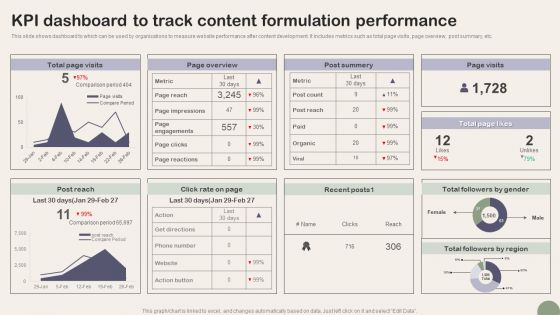
KPI Dashboard To Track Content Formulation Performance Microsoft PDF
This slide shows dashboard to which can be used by organizations to measure website performance after content development. It includes metrics such as total page visits, page overview, post summary, etc. Showcasing this set of slides titled KPI Dashboard To Track Content Formulation Performance Microsoft PDF. The topics addressed in these templates are Metric, Post Reach, Page Impressions. All the content presented in this PPT design is completely editable. Download it and make adjustments in color, background, font etc. as per your unique business setting.
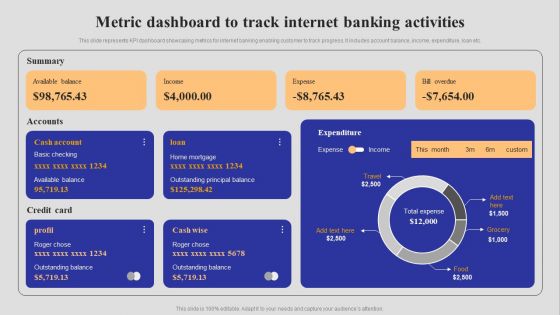
Introduction To Digital Banking Services Metric Dashboard To Track Internet Banking Activities Download PDF
This slide represents KPI dashboard showcasing metrics for internet banking enabling customer to track progress. It includes account balance, income, expenditure, loan etc. Slidegeeks is here to make your presentations a breeze with Introduction To Digital Banking Services Metric Dashboard To Track Internet Banking Activities Download PDF With our easy to use and customizable templates, you can focus on delivering your ideas rather than worrying about formatting. With a variety of designs to choose from, you are sure to find one that suits your needs. And with animations and unique photos, illustrations, and fonts, you can make your presentation pop. So whether you are giving a sales pitch or presenting to the board, make sure to check out Slidegeeks first.
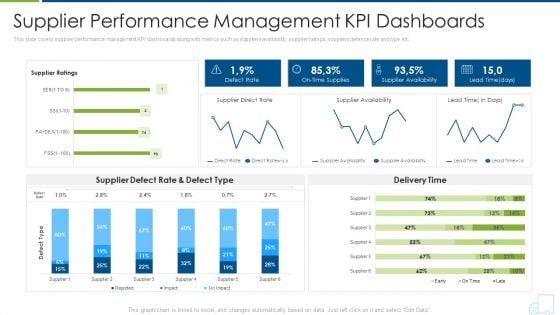
Distributor Strategy Supplier Performance Management Kpi Dashboards Summary PDF
This slide covers supplier performance management KPI dashboards along with metrics such as suppliers availability, supplier ratings, suppliers defence rate and type etc. Deliver and pitch your topic in the best possible manner with this distributor strategy supplier performance management kpi dashboards summary pdf. Use them to share invaluable insights on supplier performance management kpi dashboards and impress your audience. This template can be altered and modified as per your expectations. So, grab it now.
Supplier Compliance Kpi Dashboards Procurement Performance Tracker Slides PDF
This slide covers Procurement suppliers Performance Tracker dashboard including metrics like procurement cycle etc. Deliver and pitch your topic in the best possible manner with this supplier compliance kpi dashboards procurement performance tracker slides pdf. Use them to share invaluable insights on supplier compliance kpi dashboards procurement performance tracker and impress your audience. This template can be altered and modified as per your expectations. So, grab it now.
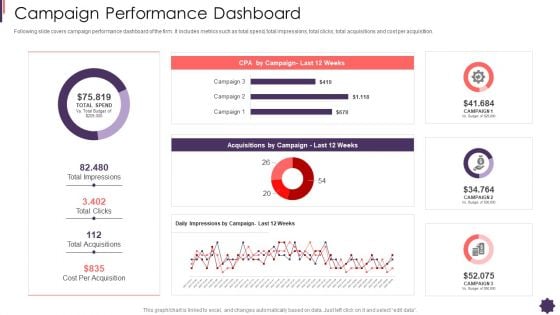
Campaign Performance Dashboard Brand Techniques Structure Ideas PDF
Following slide covers campaign performance dashboard of the firm. It includes metrics such as total spend, total impressions, total clicks, total acquisitions and cost per acquisition. Deliver and pitch your topic in the best possible manner with this campaign performance dashboard brand techniques structure ideas pdf. Use them to share invaluable insights on campaign performance dashboard and impress your audience. This template can be altered and modified as per your expectations. So, grab it now.
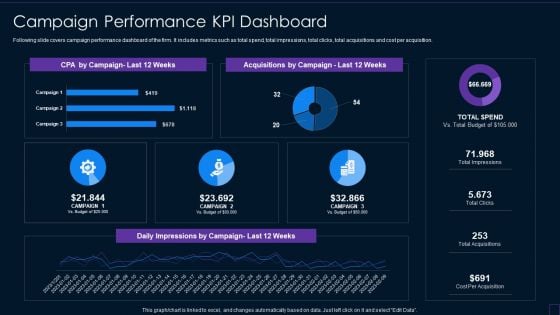
Brand Development Manual Campaign Performance KPI Dashboard Designs PDF
Following slide covers campaign performance dashboard of the firm. It includes metrics such as total spend, total impressions, total clicks, total acquisitions and cost per acquisition.Deliver and pitch your topic in the best possible manner with this Brand Development Manual Campaign Performance KPI Dashboard Designs PDF Use them to share invaluable insights on Campaign Performance KPI Dashboard and impress your audience. This template can be altered and modified as per your expectations. So, grab it now.
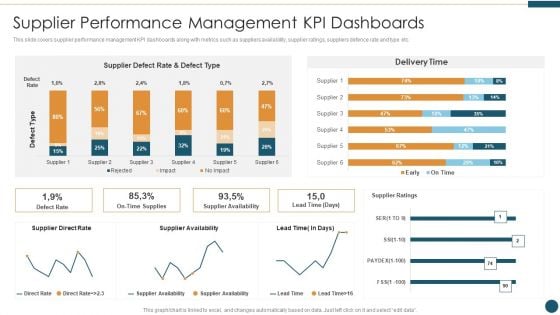
Supplier Relationship Management Supplier Performance Management KPI Dashboards Information PDF
This slide covers supplier performance management KPI dashboards along with metrics such as suppliers availability, supplier ratings, suppliers defence rate and type etc. Deliver an awe inspiring pitch with this creative Supplier Relationship Management Supplier Performance Management KPI Dashboards Information PDF bundle. Topics like Supplier Performance Management Kpi Dashboards can be discussed with this completely editable template. It is available for immediate download depending on the needs and requirements of the user.
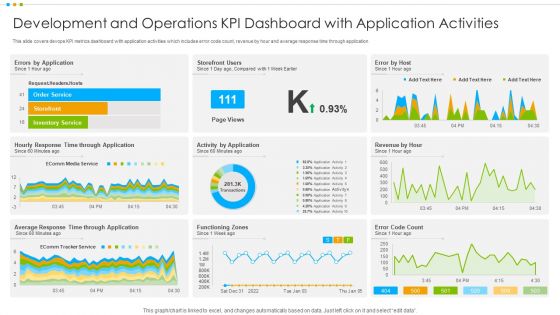
Development And Operations KPI Dashboard With Application Activities Information PDF
This slide covers devops KPI metrics dashboard with application activities which includes error code count, revenue by hour and average response time through application.Pitch your topic with ease and precision using this Development And Operations KPI Dashboard With Application Activities Information PDF This layout presents information on Development Operations Kpi Dashboard, Application Activities It is also available for immediate download and adjustment. So, changes can be made in the color, design, graphics or any other component to create a unique layout.
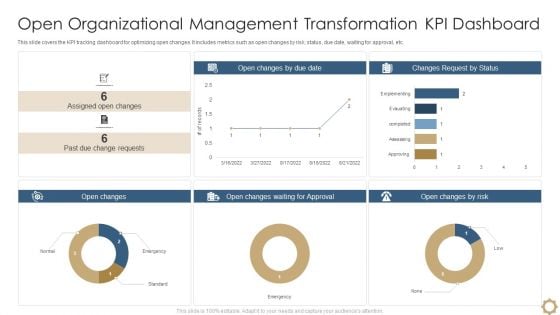
Open Organizational Management Transformation Kpi Dashboard Information PDF
This slide covers the KPI tracking dashboard for optimizing open changes. It includes metrics such as open changes by risk, status, due date, waiting for approval, etc. Pitch your topic with ease and precision using this Open Organizational Management Transformation Kpi Dashboard Information PDF. This layout presents information on Open Organizational Management, Transformation Kpi Dashboard. It is also available for immediate download and adjustment. So, changes can be made in the color, design, graphics or any other component to create a unique layout.
Dashboard For Tracking Digital Content Performance Professional PDF
This slide covers the KPI dashboard for analyzing online content. It includes metrics such as blog visitors, pageviews, newsletter conversion rate, new signups, new customers, etc. Deliver and pitch your topic in the best possible manner with this Dashboard For Tracking Digital Content Performance Professional PDF. Use them to share invaluable insights on Dashboard For Tracking, Digital Content Performance and impress your audience. This template can be altered and modified as per your expectations. So, grab it now.
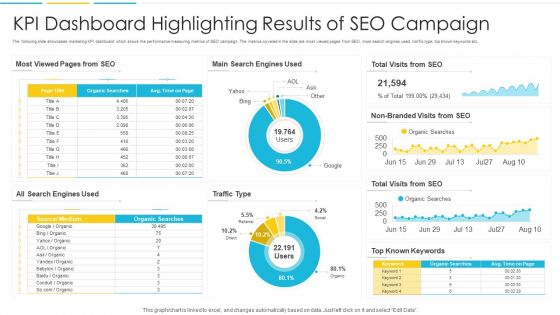
KPI Dashboard Highlighting Results Of SEO Campaign Topics PDF
The following slide showcases marketing KPI dashboard which shows the performance measuring metrics of SEO campaign. The metrics covered in the slide are most viewed pages from SEO, most search engines used, traffic type, top known keywords etc. Pitch your topic with ease and precision using this KPI Dashboard Highlighting Results Of SEO Campaign Topics PDF. This layout presents information on Search Engines, Traffic, Organic. It is also available for immediate download and adjustment. So, changes can be made in the color, design, graphics or any other component to create a unique layout.
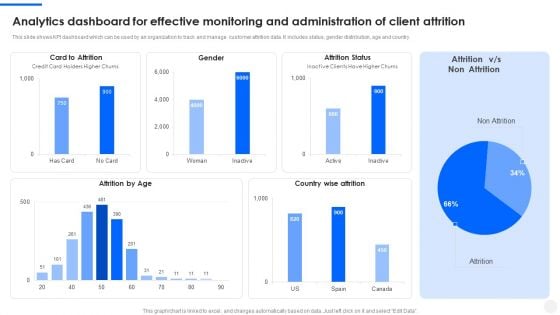
Analytics Dashboard For Effective Monitoring And Administration Of Client Attrition Portrait PDF
This slide shows KPI dashboard which can be used by an organization to track and manage customer attrition data. It includes status, gender distribution, age and country. Showcasing this set of slides titled Analytics Dashboard For Effective Monitoring And Administration Of Client Attrition Portrait PDF. The topics addressed in these templates are Attrition Status, Card To Attrition, Country Wise Attrition. All the content presented in this PPT design is completely editable. Download it and make adjustments in color, background, font etc. as per your unique business setting.
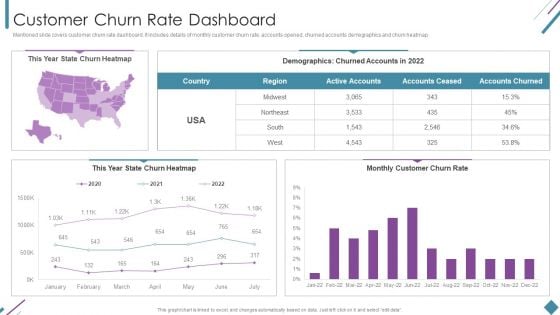
Metrics To Measure Business Performance Customer Churn Rate Dashboard Background PDF
Mentioned slide covers customer churn rate dashboard. It includes details of monthly customer churn rate, accounts opened, churned accounts demographics and churn heatmap. Deliver an awe inspiring pitch with this creative Metrics To Measure Business Performance Customer Churn Rate Dashboard Background PDF bundle. Topics likeCustomer Churn Rate, Churn Heatmap, Churned Accounts can be discussed with this completely editable template. It is available for immediate download depending on the needs and requirements of the user.
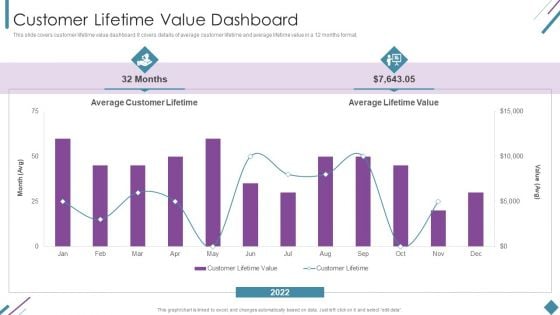
Metrics To Measure Business Performance Customer Lifetime Value Dashboard Slides PDF
This slide covers customer lifetime value dashboard. It covers details of average customer lifetime and average lifetime value in a 12 months format. Deliver and pitch your topic in the best possible manner with this Metrics To Measure Business Performance Customer Lifetime Value Dashboard Slides PDF. Use them to share invaluable insights on Average Customer Lifetime, Average Lifetime Value, 2022 and impress your audience. This template can be altered and modified as per your expectations. So, grab it now.
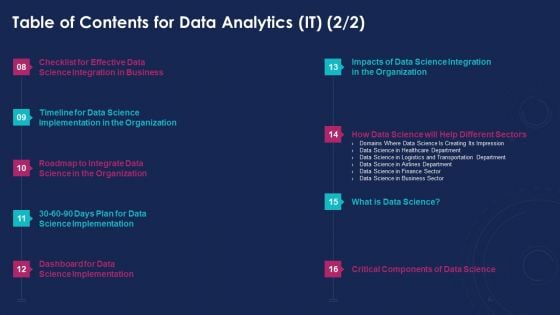
Table Of Contents For Data Analytics IT Sector Ppt File Slides PDF
Deliver and pitch your topic in the best possible manner with this table of contents for data analytics it sector ppt file slides pdf. Use them to share invaluable insights on business, implementation, dashboard, organization, integration and impress your audience. This template can be altered and modified as per your expectations. So, grab it now.
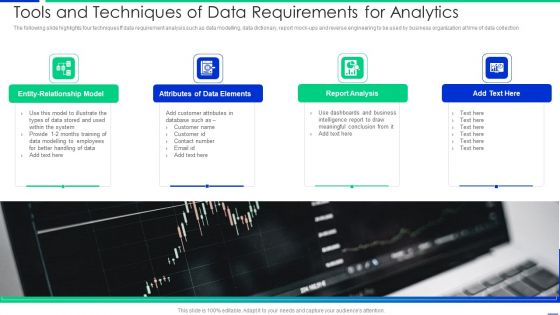
Tools And Techniques Of Data Requirements For Analytics Mockup PDF
The following slide highlights four techniques ff data requirement analysis such as data modelling, data dictionary, report mock-ups and reverse engineering to be used by business organization at time of data collection Presenting tools and techniques of data requirements for analytics mockup pdf to dispense important information. This template comprises four stages. It also presents valuable insights into the topics including system, customer, database. This is a completely customizable PowerPoint theme that can be put to use immediately. So, download it and address the topic impactfully.
B2b Sales Performance Tracking Dashboard Comprehensive Guide For Developing Topics PDF
This slide represents metric dashboard to track sales performance on e-commerce website. It cover performance indicators such as sales breakdown, order breakdown, recurring sales etc.Do you have to make sure that everyone on your team knows about any specific topic I yes, then you should give B2b Sales Performance Tracking Dashboard Comprehensive Guide For Developing Topics PDF a try. Our experts have put a lot of knowledge and effort into creating this impeccable B2b Sales Performance Tracking Dashboard Comprehensive Guide For Developing Topics PDF. You can use this template for your upcoming presentations, as the slides are perfect to represent even the tiniest detail. You can download these templates from the Slidegeeks website and these are easy to edit. So grab these today.
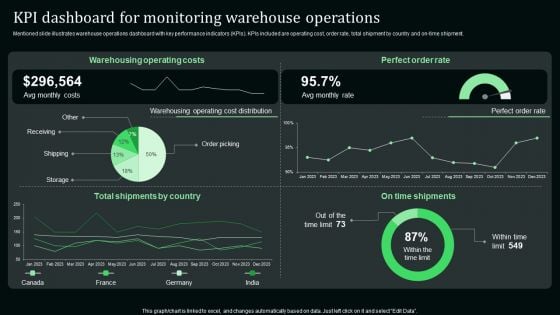
Kpi Dashboard For Monitoring Warehouse Operations Stand Out Digital Supply Chain Tactics Enhancing Information PDF
Mentioned slide illustrates warehouse operations dashboard with key performance indicators KPIs. KPIs included are operating cost, order rate, total shipment by country and on-time shipment.Presenting this PowerPoint presentation, titled Kpi Dashboard For Monitoring Warehouse Operations Stand Out Digital Supply Chain Tactics Enhancing Information PDF, with topics curated by our researchers after extensive research. This editable presentation is available for immediate download and provides attractive features when used. Download now and captivate your audience. Presenting this Kpi Dashboard For Monitoring Warehouse Operations Stand Out Digital Supply Chain Tactics Enhancing Information PDF. Our researchers have carefully researched and created these slides with all aspects taken into consideration. This is a completely customizable Kpi Dashboard For Monitoring Warehouse Operations Stand Out Digital Supply Chain Tactics Enhancing Information PDF that is available for immediate downloading. Download now and make an impact on your audience. Highlight the attractive features available with our PPTs.
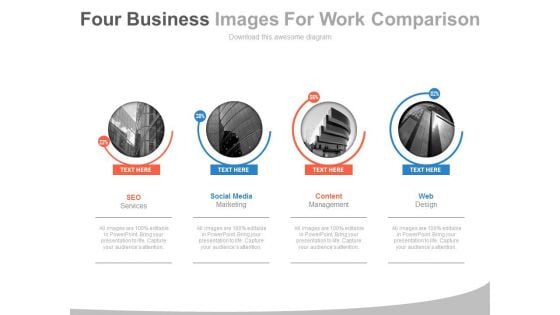
Four Companies With Web Services Powerpoint Slides
This PowerPoint template display graphics of four corporate buildings. You may use this PPT slide for financial and strategic analysis for web services companies. This dashboard slide may useful for multilevel status report creation and approval process.
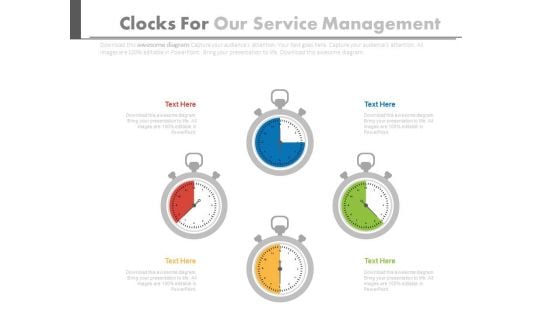
Four Stopwatches In Pie Chart Style Powerpoint Slides
This PPT slide has been designed with graphics of four stop watches in pie chart style. You may sue this PowerPoint template for time management. This dashboard slide may useful for multilevel status report creation and approval process.
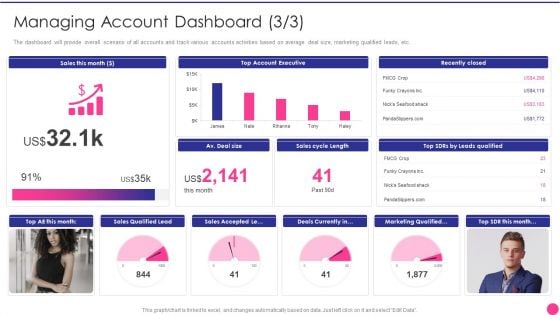
Operating B2B Sales Managing Account Dashboard Professional PDF
The dashboard will provide overall scenario of all accounts and track various accounts activities based on average contract value, average cycle length, etc. Deliver an awe inspiring pitch with this creative operating b2b sales managing account dashboard professional pdf bundle. Topics like managing account dashboard can be discussed with this completely editable template. It is available for immediate download depending on the needs and requirements of the user.
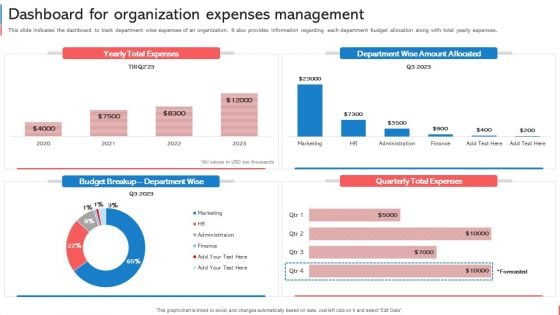
Company Budget Analysis Dashboard For Organization Expenses Management Graphics PDF
This slide indicates the dashboard to track department wise expenses of an organization. It also provides information regarding each department budget allocation along with total yearly expenses. Create an editable Company Budget Analysis Dashboard For Organization Expenses Management Graphics PDF that communicates your idea and engages your audience. Whether youre presenting a business or an educational presentation, pre-designed presentation templates help save time. Company Budget Analysis Dashboard For Organization Expenses Management Graphics PDF is highly customizable and very easy to edit, covering many different styles from creative to business presentations. Slidegeeks has creative team members who have crafted amazing templates. So, go and get them without any delay.
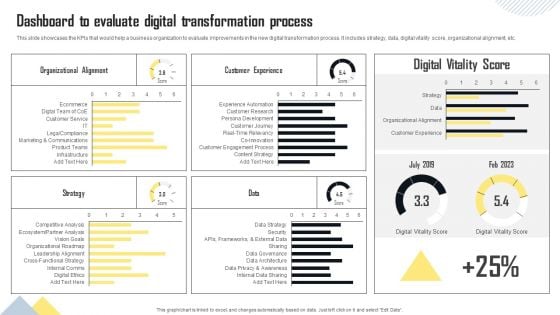
Dashboard To Evaluate Digital Transformation Process Graphics PDF
This slide showcases the KPIs that would help a business organization to evaluate improvements in the new digital transformation process. It includes strategy, data, digital vitality score, organizational alignment, etc. Here you can discover an assortment of the finest PowerPoint and Google Slides templates. With these templates, you can create presentations for a variety of purposes while simultaneously providing your audience with an eye catching visual experience. Download Dashboard To Evaluate Digital Transformation Process Graphics PDF to deliver an impeccable presentation. These templates will make your job of preparing presentations much quicker, yet still, maintain a high level of quality. Slidegeeks has experienced researchers who prepare these templates and write high quality content for you. Later on, you can personalize the content by editing the Dashboard To Evaluate Digital Transformation Process Graphics PDF.

KPI Dashboard Showcasing Product Management Guidelines PDF
This slide showcases dashboard providing product development team performance status with determined KPIs. It provides details such as product development team score, average result scores and result KPIs. Pitch your topic with ease and precision using this KPI Dashboard Showcasing Product Management Guidelines PDF. This layout presents information on Average Rating, Innovation, Design. It is also available for immediate download and adjustment. So, changes can be made in the color, design, graphics or any other component to create a unique layout.
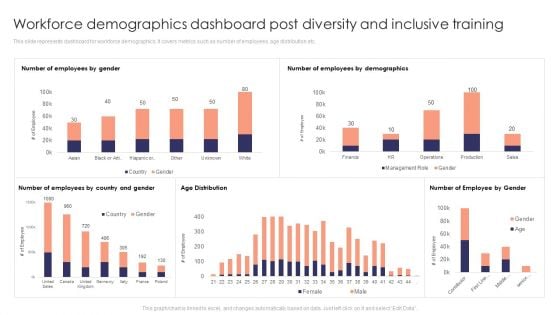
Workforce Demographics Dashboard Post Diversity And Inclusive Training Background PDF
This slide represents dashboard for workforce demographics. It covers metrics such as number of employees, age distribution etc. Make sure to capture your audiences attention in your business displays with our gratis customizable Workforce Demographics Dashboard Post Diversity And Inclusive Training Background PDF. These are great for business strategies, office conferences, capital raising or task suggestions. If you desire to acquire more customers for your tech business and ensure they stay satisfied, create your own sales presentation with these plain slides.

Effective Real Time Marketing Principles Set Kpis To Evaluate Current And Previous Performance Structure Pdf
The following slide covers various key performance indicators to measure and compare results of marketing efforts. It includes elements such as brand loyalty, engagement, net promotor score, return on investment, equity etc. Boost your pitch with our creative Effective Real Time Marketing Principles Set Kpis To Evaluate Current And Previous Performance Structure Pdf. Deliver an awe-inspiring pitch that will mesmerize everyone. Using these presentation templates you will surely catch everyones attention. You can browse the ppts collection on our website. We have researchers who are experts at creating the right content for the templates. So you do not have to invest time in any additional work. Just grab the template now and use them. The following slide covers various key performance indicators to measure and compare results of marketing efforts. It includes elements such as brand loyalty, engagement, net promotor score, return on investment, equity etc.
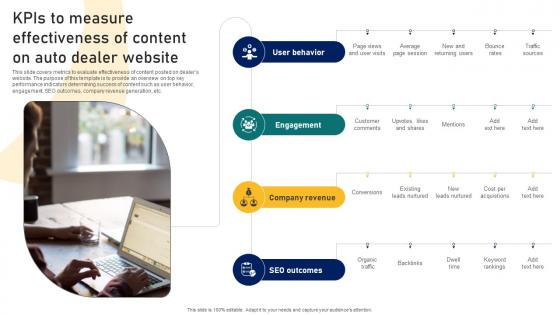
Guide To Building A Successful Kpis To Measure Effectiveness Of Content On Auto Dealer Strategy SS V
This slide covers metrics to evaluate effectiveness of content posted on dealers website. The purpose of this template is to provide an overview on top key performance indicators determining success of content such as user behavior, engagement, SEO outcomes, company revenue generation, etc. The Guide To Building A Successful Kpis To Measure Effectiveness Of Content On Auto Dealer Strategy SS V is a compilation of the most recent design trends as a series of slides. It is suitable for any subject or industry presentation, containing attractive visuals and photo spots for businesses to clearly express their messages. This template contains a variety of slides for the user to input data, such as structures to contrast two elements, bullet points, and slides for written information. Slidegeeks is prepared to create an impression. This slide covers metrics to evaluate effectiveness of content posted on dealers website. The purpose of this template is to provide an overview on top key performance indicators determining success of content such as user behavior, engagement, SEO outcomes, company revenue generation, etc.
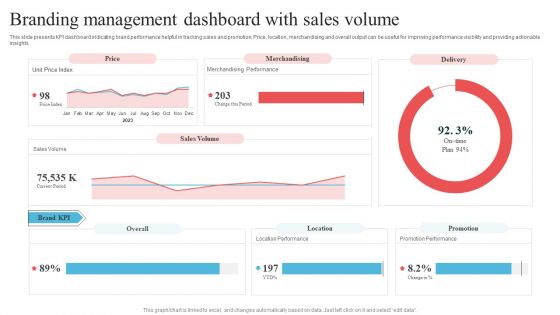
Branding Management Dashboard With Sales Volume Mockup PDF
This slide presents KPI dashboard indicating brand performance helpful in tracking sales and promotion. Price, location, merchandising and overall output can be useful for improving performance visibility and providing actionable insights. Showcasing this set of slides titled Branding Management Dashboard With Sales Volume Mockup PDF. The topics addressed in these templates are Branding Management Dashboard, Sales Volume. All the content presented in this PPT design is completely editable. Download it and make adjustments in color, background, font etc. as per your unique business setting.
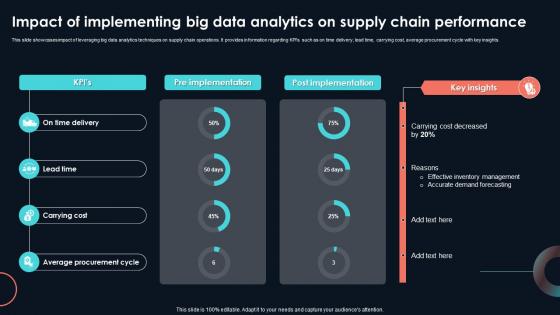
Impact Of Implementing Big Data Analytics On Developing Strategic Insights Using Big Data Analytics SS V
This slide showcases impact of leveraging big data analytics techniques on supply chain operations. It provides information regarding KPIs such as on time delivery, lead time, carrying cost, average procurement cycle with key insights. Boost your pitch with our creative Impact Of Implementing Big Data Analytics On Developing Strategic Insights Using Big Data Analytics SS V. Deliver an awe-inspiring pitch that will mesmerize everyone. Using these presentation templates you will surely catch everyones attention. You can browse the ppts collection on our website. We have researchers who are experts at creating the right content for the templates. So you do not have to invest time in any additional work. Just grab the template now and use them. This slide showcases impact of leveraging big data analytics techniques on supply chain operations. It provides information regarding KPIs such as on time delivery, lead time, carrying cost, average procurement cycle with key insights.
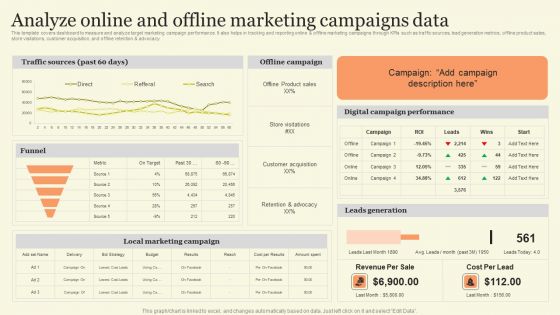
Analyze Online And Offline Marketing Campaigns Data Ideas PDF
This template covers dashboard to measure and analyze target marketing campaign performance. It also helps in tracking and reporting online and offline marketing campaigns through KPIs such as traffic sources, lead generation metrics, offline product sales, store visitations, customer acquisition, and offline retention and advocacy. Find a pre designed and impeccable Analyze Online And Offline Marketing Campaigns Data Ideas PDF. The templates can ace your presentation without additional effort. You can download these easy to edit presentation templates to make your presentation stand out from others. So, what are you waiting for Download the template from Slidegeeks today and give a unique touch to your presentation.
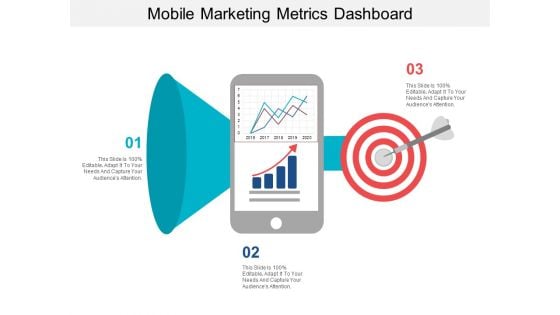
Mobile Marketing Metrics Dashboard Ppt PowerPoint Presentation Show Gridlines
This is a mobile marketing metrics dashboard ppt powerpoint presentation show gridlines. This is a three stage process. The stages in this process are mobile analytics, mobile tracking, mobile web analytics.

Actual Time Transaction Monitoring Software And Strategies Dashboard To Monitor Bank Transactions Guidelines PDF
This slide showcases dashboard to review bank transactions and activities. It provides information about credit, check, ATM, debit card, transaction volume, decline rate, visa, maestro, network end points, etc. Slidegeeks is here to make your presentations a breeze with Actual Time Transaction Monitoring Software And Strategies Dashboard To Monitor Bank Transactions Guidelines PDF With our easy to use and customizable templates, you can focus on delivering your ideas rather than worrying about formatting. With a variety of designs to choose from, you are sure to find one that suits your needs. And with animations and unique photos, illustrations, and fonts, you can make your presentation pop. So whether you are giving a sales pitch or presenting to the board, make sure to check out Slidegeeks first.
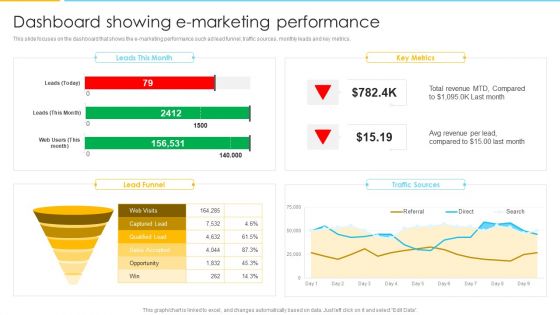
Optimizing Ecommerce Marketing Plan To Improve Sales Dashboard Showing E Marketing Performance Formats PDF
This slide focuses on the dashboard that shows the e marketing performance such ad lead funnel, traffic sources, monthly leads and key metrics. Deliver an awe inspiring pitch with this creative Optimizing Ecommerce Marketing Plan To Improve Sales Dashboard Showing E Marketing Performance Formats PDF bundle. Topics like Revenue, Key Metrics, Traffic Sources can be discussed with this completely editable template. It is available for immediate download depending on the needs and requirements of the user.


 Continue with Email

 Home
Home


