Snapshot
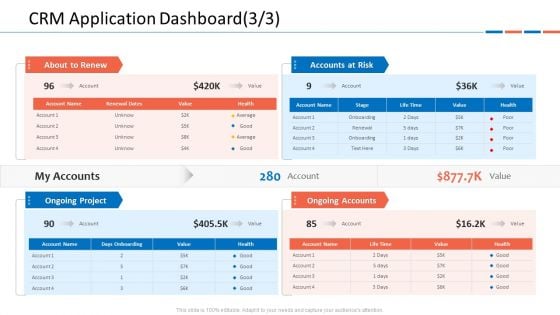
Customer Relationship Management Dashboard CRM Application Dashboard Risk Guidelines PDF
Deliver an awe inspiring pitch with this creative customer relationship management dashboard crm application dashboard risk guidelines pdf bundle. Topics like about to renew, accounts at risk, ongoing project, ongoing accounts can be discussed with this completely editable template. It is available for immediate download depending on the needs and requirements of the user.
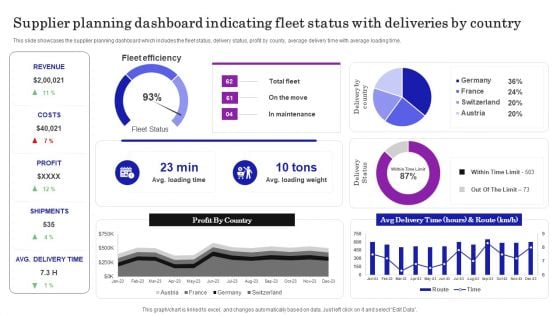
Supplier Planning Dashboard Indicating Fleet Status With Deliveries By Country Ideas PDF
This slide showcases the supplier planning dashboard which includes the fleet status, delivery status, profit by county, average delivery time with average loading time. Here you can discover an assortment of the finest PowerPoint and Google Slides templates. With these templates, you can create presentations for a variety of purposes while simultaneously providing your audience with an eye catching visual experience. Download Supplier Planning Dashboard Indicating Fleet Status With Deliveries By Country Ideas PDF to deliver an impeccable presentation. These templates will make your job of preparing presentations much quicker, yet still, maintain a high level of quality. Slidegeeks has experienced researchers who prepare these templates and write high quality content for you. Later on, you can personalize the content by editing the Supplier Planning Dashboard Indicating Fleet Status With Deliveries By Country Ideas PDF.
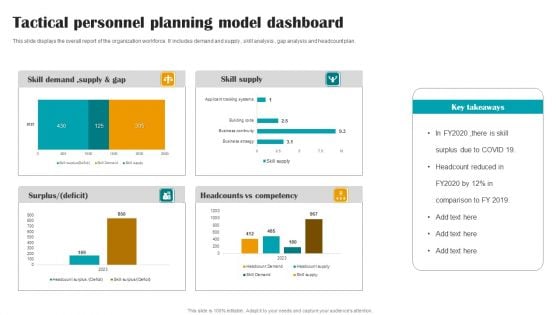
Tactical Personnel Planning Model Dashboard Pictures PDF
This slide displays the overall report of the organization workforce. It includes demand and supply , skill analysis , gap analysis and headcount plan. Showcasing this set of slides titled Tactical Personnel Planning Model Dashboard Pictures PDF. The topics addressed in these templates are Tactical Personnel Planning, Model Dashboard. All the content presented in this PPT design is completely editable. Download it and make adjustments in color, background, font etc. as per your unique business setting.
Staff Training Effectiveness Tracking Dashboard Pictures PDF
This slide provides information regarding workforce training effectiveness monitoring dashboard. The dashboard includes details such as training cost, cost per participant, number of participants, hours of training, etc. Whether you have daily or monthly meetings, a brilliant presentation is necessary. Staff Training Effectiveness Tracking Dashboard Pictures PDF can be your best option for delivering a presentation. Represent everything in detail using Staff Training Effectiveness Tracking Dashboard Pictures PDF and make yourself stand out in meetings. The template is versatile and follows a structure that will cater to your requirements. All the templates prepared by Slidegeeks are easy to download and edit. Our research experts have taken care of the corporate themes as well. So, give it a try and see the results.
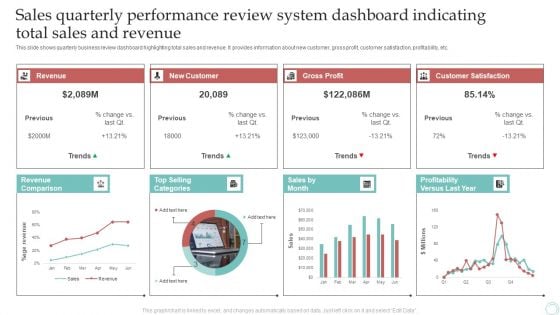
Sales Quarterly Performance Review System Dashboard Indicating Total Sales And Revenue Download PDF
This slide shows quarterly business review dashboard highlighting total sales and revenue. It provides information about new customer, gross profit, customer satisfaction, profitability, etc. Pitch your topic with ease and precision using this Sales Quarterly Performance Review System Dashboard Indicating Total Sales And Revenue Download PDF. This layout presents information on Revenue, New Customer, Gross Profit. It is also available for immediate download and adjustment. So, changes can be made in the color, design, graphics or any other component to create a unique layout.

Port Terminal Industry Report Ppt Sample
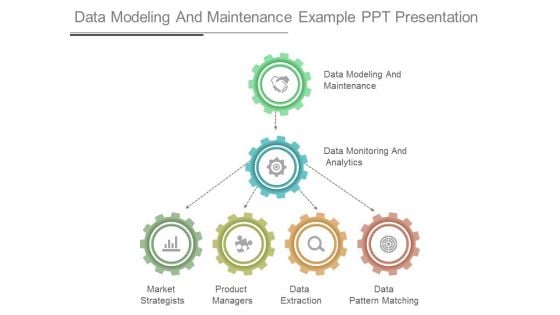
Data Modeling And Maintenance Example Ppt Presentation
This is a data modeling and maintenance example ppt presentation. This is a six stage process. The stages in this process are data modeling and maintenance, data monitoring and analytics, market strategists, product managers, data extraction, data pattern matching.
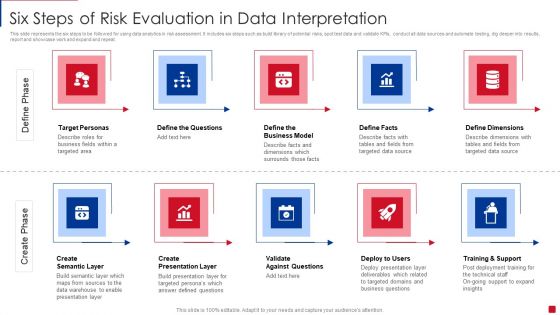
Six Steps Of Risk Evaluation In Data Interpretation Introduction PDF
This slide represents the six steps to be followed for using data analytics in risk assessment. It includes six steps such as build library of potential risks, spot test data and validate KPIs, conduct all data sources and automate testing, dig deeper into results, report and showcase work and expand and repeat. Persuade your audience using this Six Steps Of Risk Evaluation In Data Interpretation Introduction PDF. This PPT design covers six stages, thus making it a great tool to use. It also caters to a variety of topics including Expand And Repeat, Report Showcase Work, Potential Risks. Download this PPT design now to present a convincing pitch that not only emphasizes the topic but also showcases your presentation skills.
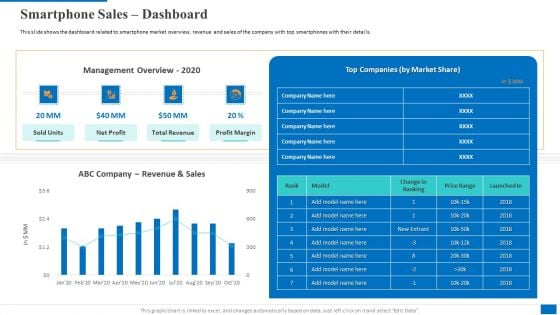
Smartphone Sales Dashboard Graphics PDF
This slide shows the dashboard related to smartphone market overview, revenue and sales of the company with top smartphones with their details.Deliver an awe inspiring pitch with this creative smartphone sales dashboard graphics pdf bundle. Topics like smartphone sales dashboard can be discussed with this completely editable template. It is available for immediate download depending on the needs and requirements of the user.
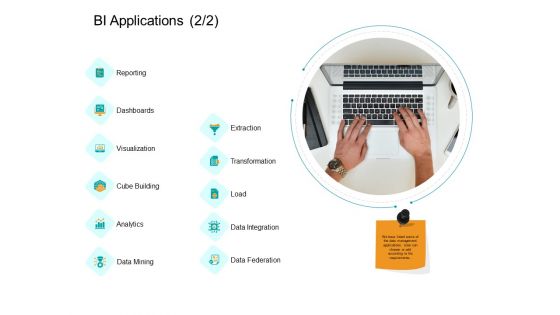
Facts Assessment BI Applications Reporting Ppt PowerPoint Presentation Model Example PDF
Presenting this set of slides with name facts assessment bi applications reporting ppt powerpoint presentation model example pdf. This is a eleven stage process. The stages in this process are reporting, dashboards, visualization, cube building, analytics, data mining, extraction, transformation load, data integration, data federation. This is a completely editable PowerPoint presentation and is available for immediate download. Download now and impress your audience.
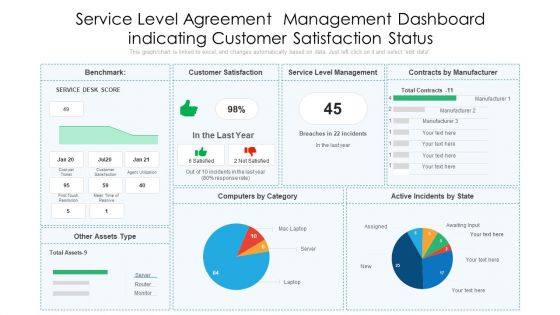
Service Level Agreement Management Dashboard Indicating Customer Satisfaction Status Designs PDF
Pitch your topic with ease and precision using this service level agreement management dashboard indicating customer satisfaction status designs pdf. This layout presents information on customer satisfaction, service level management, contracts by manufacturer. It is also available for immediate download and adjustment. So, changes can be made in the color, design, graphics or any other component to create a unique layout.
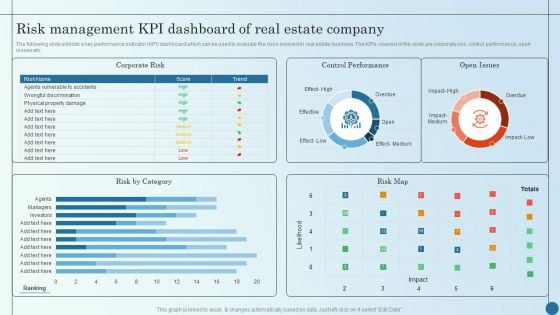
Risk Management KPI Dashboard Of Real Estate Company Managing Commercial Property Risks Elements PDF
The following slide exhibits a key performance indicator KPI dashboard which can be used to evaluate the risks involved in real estate business. The KPIs covered in the slide are corporate risk, control performance, open issues etc.Deliver an awe inspiring pitch with this creative Risk Management KPI Dashboard Of Real Estate Company Managing Commercial Property Risks Elements PDF bundle. Topics like Control Performance, Corporate Risk, Effect Medium can be discussed with this completely editable template. It is available for immediate download depending on the needs and requirements of the user.
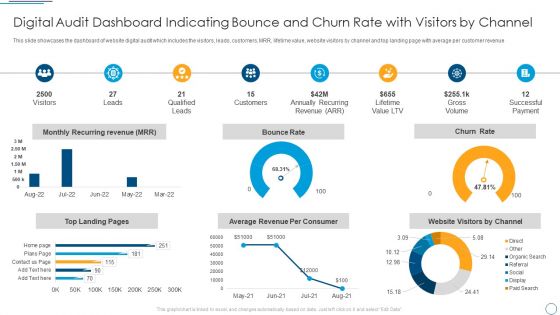
Digital Audit Dashboard Indicating Bounce And Churn Rate With Visitors By Channel Demonstration PDF
This slide showcases the dashboard of website digital audit which includes the visitors, leads, customers, MRR, lifetime value, website visitors by channel and top landing page with average per customer revenue.Deliver and pitch your topic in the best possible manner with this Digital Audit Dashboard Indicating Bounce And Churn Rate With Visitors By Channel Demonstration PDF. Use them to share invaluable insights on Qualified Leads, Annually Recurring, Successful Payment and impress your audience. This template can be altered and modified as per your expectations. So, grab it now.
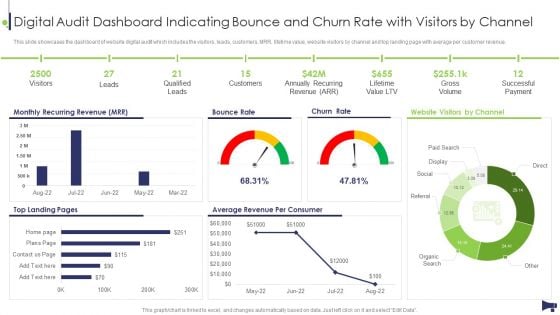
Website And Social Media Digital Audit Dashboard Indicating Bounce And Churn Rate Template PDF
This slide showcases the dashboard of website digital audit which includes the visitors, leads, customers, MRR, lifetime value, website visitors by channel and top landing page with average per customer revenue. Deliver and pitch your topic in the best possible manner with this Website And Social Media Digital Audit Dashboard Indicating Bounce And Churn Rate Template PDF. Use them to share invaluable insights on Monthly Recurring Revenue, Bounce Rate, Churn Rate and impress your audience. This template can be altered and modified as per your expectations. So, grab it now.
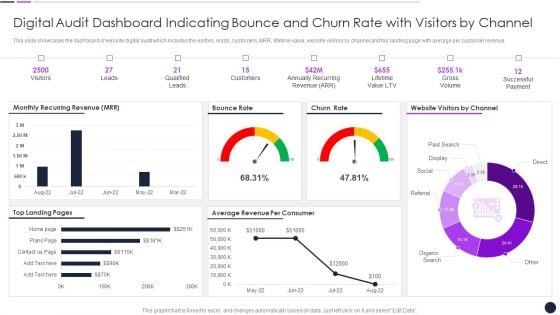
Digital Audit Dashboard Indicating Bounce And Churn Rate With Visitors By Channel Inspiration PDF
This slide showcases the dashboard of website digital audit which includes the visitors, leads, customers, MRR, lifetime value, website visitors by channel and top landing page with average per customer revenue.Deliver and pitch your topic in the best possible manner with this Digital Audit Dashboard Indicating Bounce And Churn Rate With Visitors By Channel Inspiration PDF. Use them to share invaluable insights on Qualified Leads, Annually Recurring, Lifetime Value and impress your audience. This template can be altered and modified as per your expectations. So, grab it now.

Digital Audit Dashboard Indicating Bounce And Churn Rate With Visitors By Channel Information PDF
This slide showcases the dashboard of website digital audit which includes the visitors, leads, customers, MRR, lifetime value, website visitors by channel and top landing page with average per customer revenue. Deliver an awe inspiring pitch with this creative Digital Audit Dashboard Indicating Bounce And Churn Rate With Visitors By Channel Information PDF bundle. Topics like Monthly Recurring Revenue, Bounce Rate, Churn Rate can be discussed with this completely editable template. It is available for immediate download depending on the needs and requirements of the user.
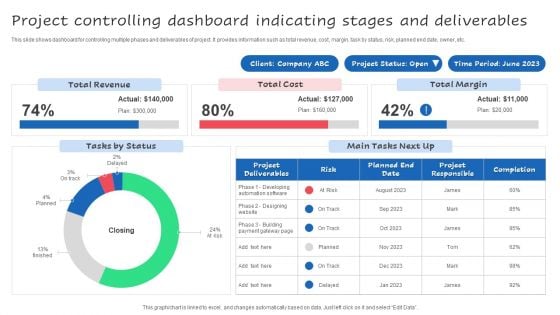
Project Controlling Dashboard Indicating Stages And Deliverables Ppt Styles Guide PDF
This slide shows dashboard for controlling multiple phases and deliverables of project. It provides information such as total revenue, cost, margin, task by status, risk, planned end date, owner, etc. Pitch your topic with ease and precision using this Project Controlling Dashboard Indicating Stages And Deliverables Ppt Styles Guide PDF. This layout presents information on Total Revenue, Total Margin, Total Cost. It is also available for immediate download and adjustment. So, changes can be made in the color, design, graphics or any other component to create a unique layout.
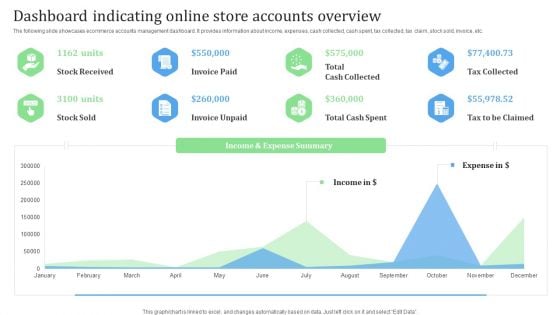
Dashboard Indicating Online Store Accounts Overview Financial Management Strategies Clipart PDF
The following slide showcases ecommerce accounts management dashboard. It provides information about income, expenses, cash collected, cash spent, tax collected, tax claim, stock sold, invoice, etc.From laying roadmaps to briefing everything in detail, our templates are perfect for you. You can set the stage with your presentation slides. All you have to do is download these easy-to-edit and customizable templates. Dashboard Indicating Online Store Accounts Overview Financial Management Strategies Clipart PDF will help you deliver an outstanding performance that everyone would remember and praise you for. Do download this presentation today.
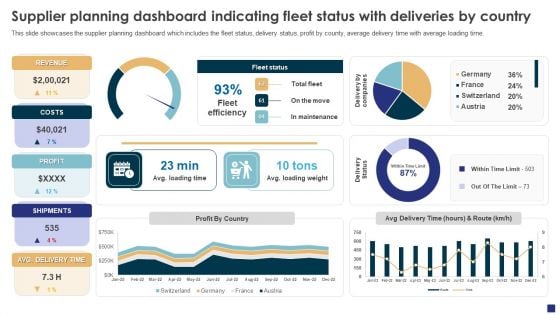
Comprehensive Guide To Ecommerce Supplier Planning Dashboard Indicating Fleet Status Mockup PDF
This slide showcases the supplier planning dashboard which includes the fleet status, delivery status, profit by county, average delivery time with average loading time. Want to ace your presentation in front of a live audience Our Comprehensive Guide To Ecommerce Supplier Planning Dashboard Indicating Fleet Status Mockup PDF can help you do that by engaging all the users towards you.. Slidegeeks experts have put their efforts and expertise into creating these impeccable powerpoint presentations so that you can communicate your ideas clearly. Moreover, all the templates are customizable, and easy-to-edit and downloadable. Use these for both personal and commercial use.
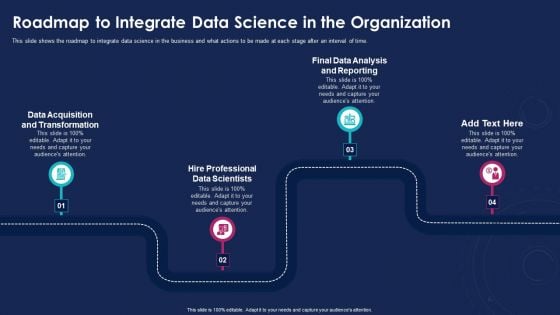
Data Analytics IT Roadmap To Integrate Data Science In The Organization Microsoft PDF
This slide shows the roadmap to integrate data science in the business and what actions to be made at each stage after an interval of time. This is a data analytics it roadmap to integrate data science in the organization microsoft pdf template with various stages. Focus and dispense information on five stages using this creative set, that comes with editable features. It contains large content boxes to add your information on topics like data acquisition and transformation, hire professional data scientists, final data analysis and reporting. You can also showcase facts, figures, and other relevant content using this PPT layout. Grab it now.
Call Center PowerPoint Icon F
Microsoft PowerPoint Template and Background with 3d man, call-center Develop their craving for your creativity. Become a brand name with our Call Center PowerPoint Icon F.
Call Center PowerPoint Icon R
Microsoft PowerPoint Template and Background with 3d man, call-center Achieve strong & sustainable financial gains with our Call Center PowerPoint Icon R. They will make you look good.
Call Center PowerPoint Icon C
Microsoft PowerPoint Template and Background with 3d man, call-center Satisfy enquiring minds with our Call Center PowerPoint Icon C. They help you clarify every lingering doubt.
Call Center PowerPoint Icon S
Microsoft PowerPoint Template and Background with 3d man, call-center Our Call Center PowerPoint Icon S offer many amenities. They facilitate any excercise you undertake.
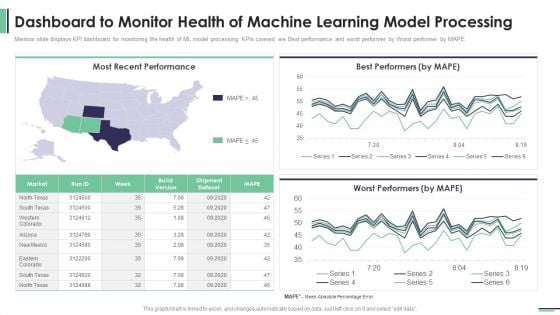
Machine Learning Development And Operations Cycle IT Dashboard To Monitor Health Of Machine Demonstration PDF
Mention slide displays KPI dashboard for monitoring the health of ML model processing. KPIs covered are Best performance and worst performer by Worst performer by MAPE.Deliver an awe inspiring pitch with this creative machine learning development and operations cycle it dashboard to monitor health of machine demonstration pdf bundle. Topics like most recent performance, best performers, worst performers can be discussed with this completely editable template. It is available for immediate download depending on the needs and requirements of the user.
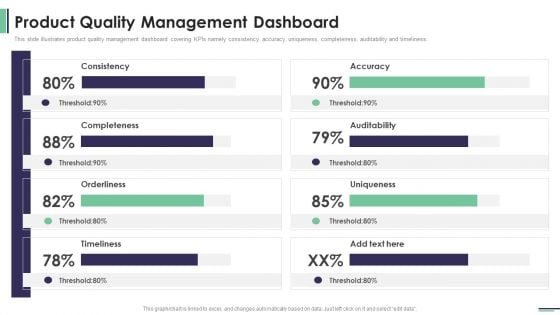
Machine Learning Development And Operations Cycle IT Product Quality Management Dashboard Information PDF
This slide illustrates product quality management dashboard covering KPIs namely consistency, accuracy, uniqueness, completeness, auditability and timeliness.Deliver an awe inspiring pitch with this creative machine learning development and operations cycle it product quality management dashboard information pdf bundle. Topics like orderliness, completeness, auditability can be discussed with this completely editable template. It is available for immediate download depending on the needs and requirements of the user.
Kpi And Dashboard Ppt PowerPoint Presentation Icon Template
This is a kpi and dashboard ppt powerpoint presentation icon template. This is a two stage process. The stages in this process are kpi dashboard, kpi metrics, management, marketing, strategy.
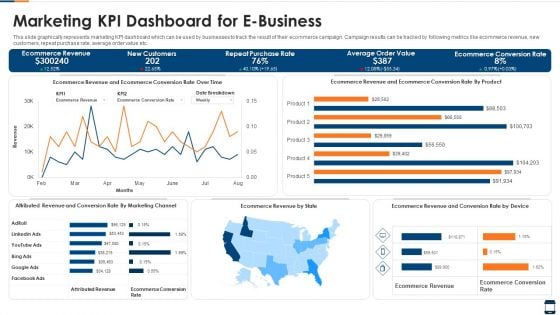
Marketing KPI Dashboard For E Business Brochure PDF
This slide graphically represents marketing KPI dashboard which can be used by businesses to track the result of their ecommerce campaign. Campaign results can be tracked by following metrics like ecommerce revenue, new customers, repeat purchase rate, average order value etc. Showcasing this set of slides titled marketing kpi dashboard for e business brochure pdf. The topics addressed in these templates are marketing kpi dashboard for e business. All the content presented in this PPT design is completely editable. Download it and make adjustments in color, background, font etc. as per your unique business setting.
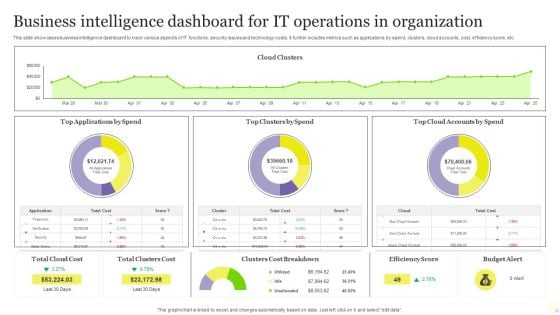
Business Intelligence Dashboard For It Operations In Organization Themes PDF
This slide showcases business intelligence dashboard to track various aspects of IT functions, security issues and technology costs. It further includes metrics such as applications by spend, clusters, cloud accounts, cost, efficiency score, etc. Showcasing this set of slides titled Business Intelligence Dashboard For It Operations In Organization Themes PDF. The topics addressed in these templates are Business Intelligence Dashboard, IT Operations, Organization. All the content presented in this PPT design is completely editable. Download it and make adjustments in color, background, font etc. as per your unique business setting.
DSS Software Program Augmented Intelligence Information Tracking Dashboard Background PDF
This slide depicts the information tracking dashboard by augmented intelligence model covering the data analysis. Data analysis includes image analysis, storage size, new users on the cloud platform, etc. Do you have to make sure that everyone on your team knows about any specific topic I yes, then you should give DSS Software Program Augmented Intelligence Information Tracking Dashboard Background PDF a try. Our experts have put a lot of knowledge and effort into creating this impeccable DSS Software Program Augmented Intelligence Information Tracking Dashboard Background PDF. You can use this template for your upcoming presentations, as the slides are perfect to represent even the tiniest detail. You can download these templates from the Slidegeeks website and these are easy to edit. So grab these today.
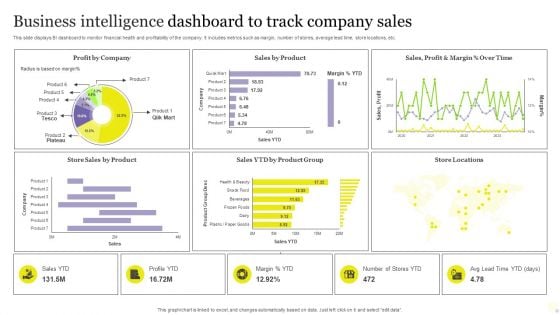
Business Intelligence Dashboard To Track Company Sales Rules PDF
This slide displays BI dashboard to monitor financial health and profitability of the company. It includes metrics such as margin, number of stores, average lead time, store locations, etc. Showcasing this set of slides titled Business Intelligence Dashboard To Track Company Sales Rules PDF. The topics addressed in these templates are Business Intelligence Dashboard, Track Company Sales. All the content presented in this PPT design is completely editable. Download it and make adjustments in color, background, font etc. as per your unique business setting.
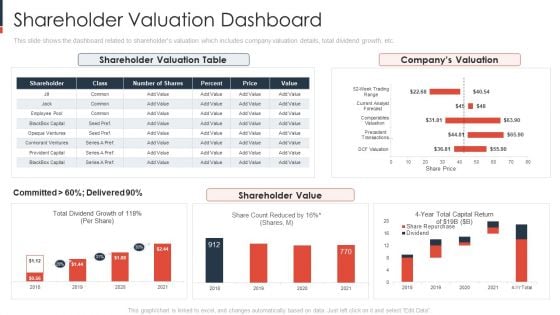
Shareholder Valuation Dashboard Guidelines PDF
This slide shows the dashboard related to shareholders valuation which includes company valuation details, total dividend growth, etc.Deliver and pitch your topic in the best possible manner with this shareholder valuation dashboard guidelines pdf. Use them to share invaluable insights on shareholder valuation dashboard and impress your audience. This template can be altered and modified as per your expectations. So, grab it now.
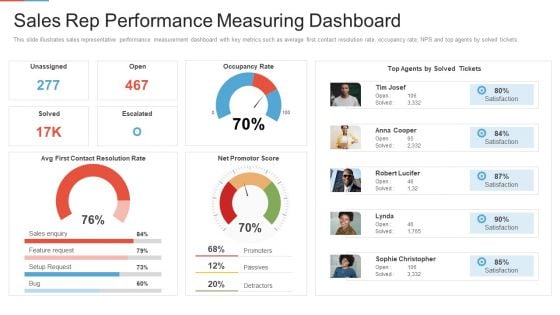
Marketing Outlining Segmentation Initiatives Sales Rep Performance Measuring Dashboard Pictures PDF
This slide illustrates sales representative performance measurement dashboard with key metrics such as average first contact resolution rate, occupancy rate, NPS and top agents by solved tickets. Deliver an awe inspiring pitch with this creative marketing outlining segmentation initiatives sales rep performance measuring dashboard pictures pdf bundle. Topics like occupancy rate, promoters, passives, detractors can be discussed with this completely editable template. It is available for immediate download depending on the needs and requirements of the user.
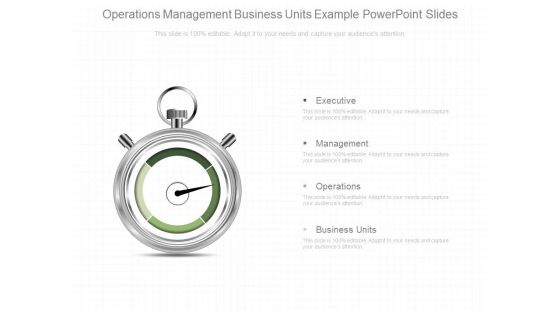
Operations Management Business Units Example Powerpoint Slides
This is a operations management business units example powerpoint slides. This is a four stage process. The stages in this process are executive, management, operations, business units.
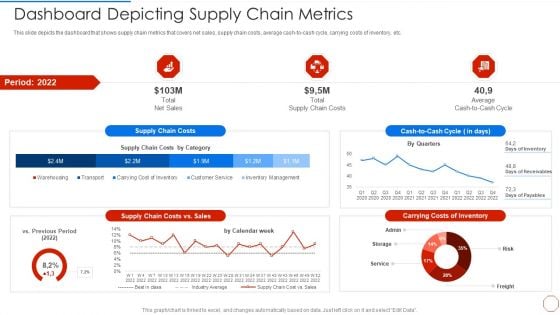
Minimizing Operational Cost Through Iot Virtual Twins Implementation Dashboard Depicting Supply Download PDF
This slide depicts the dashboard that shows supply chain metrics that covers net sales, supply chain costs, average cash to cash cycle, carrying costs of inventory, etc. Deliver an awe inspiring pitch with this creative minimizing operational cost through iot virtual twins implementation dashboard depicting supply download pdf bundle. Topics like sales, costs, supply, average can be discussed with this completely editable template. It is available for immediate download depending on the needs and requirements of the user.
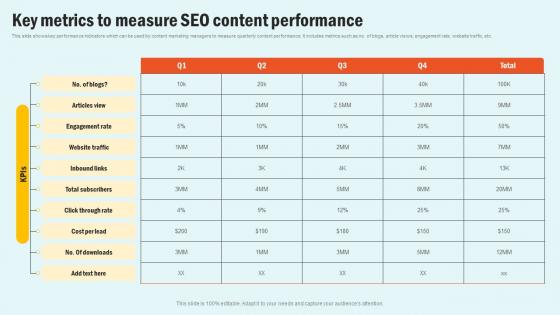
Key Metrics To Measure SEO Enhancing Website Performance With Search Engine Content Background Pdf
This slide shows key performance indicators which can be used by content marketing managers to measure quarterly content performance. It includes metrics such as no. of blogs, article views, engagement rate, website traffic, etc. Formulating a presentation can take up a lot of effort and time, so the content and message should always be the primary focus. The visuals of the PowerPoint can enhance the presenters message, so our Key Metrics To Measure SEO Enhancing Website Performance With Search Engine Content Background Pdf was created to help save time. Instead of worrying about the design, the presenter can concentrate on the message while our designers work on creating the ideal templates for whatever situation is needed. Slidegeeks has experts for everything from amazing designs to valuable content, we have put everything into Key Metrics To Measure SEO Enhancing Website Performance With Search Engine Content Background Pdf This slide shows key performance indicators which can be used by content marketing managers to measure quarterly content performance. It includes metrics such as no. of blogs, article views, engagement rate, website traffic, etc.
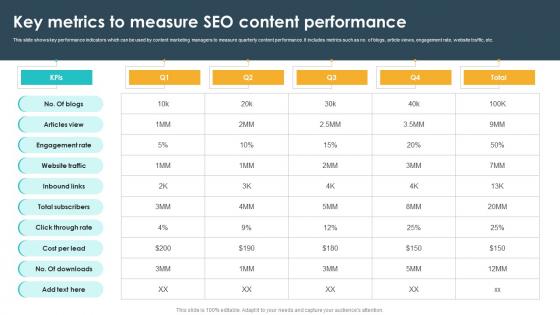
Key Metrics To Measure Seo Content Performance Seo Content Plan To Drive Strategy SS V
This slide shows key performance indicators which can be used by content marketing managers to measure quarterly content performance. It includes metrics such as no. of blogs, article views, engagement rate, website traffic, etc. Formulating a presentation can take up a lot of effort and time, so the content and message should always be the primary focus. The visuals of the PowerPoint can enhance the presenters message, so our Key Metrics To Measure Seo Content Performance Seo Content Plan To Drive Strategy SS V was created to help save time. Instead of worrying about the design, the presenter can concentrate on the message while our designers work on creating the ideal templates for whatever situation is needed. Slidegeeks has experts for everything from amazing designs to valuable content, we have put everything into Key Metrics To Measure Seo Content Performance Seo Content Plan To Drive Strategy SS V This slide shows key performance indicators which can be used by content marketing managers to measure quarterly content performance. It includes metrics such as no. of blogs, article views, engagement rate, website traffic, etc.
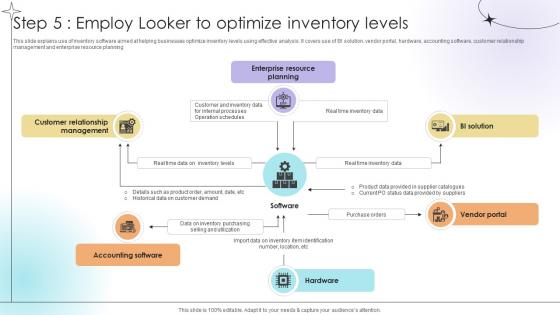
Step 5 Employ Looker To Optimize Inventory Levels Data Analytics SS V
This slide explains use of inventory software aimed at helping businesses optimize inventory levels using effective analysis. It covers use of BI solution, vendor portal, hardware, accounting software, customer relationship management and enterprise resource planning.This modern and well-arranged Step 5 Employ Looker To Optimize Inventory Levels Data Analytics SS V provides lots of creative possibilities. It is very simple to customize and edit with the Powerpoint Software. Just drag and drop your pictures into the shapes. All facets of this template can be edited with Powerpoint, no extra software is necessary. Add your own material, put your images in the places assigned for them, adjust the colors, and then you can show your slides to the world, with an animated slide included. This slide explains use of inventory software aimed at helping businesses optimize inventory levels using effective analysis. It covers use of BI solution, vendor portal, hardware, accounting software, customer relationship management and enterprise resource planning.
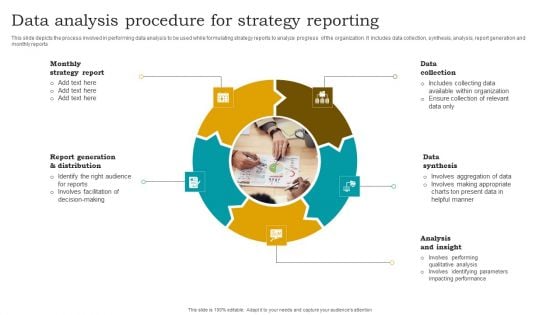
Data Analysis Procedure For Strategy Reporting Designs PDF
This slide depicts the process involved in performing data analysis to be used while formulating strategy reports to analyze progress of the organization. It includes data collection, synthesis, analysis, report generation and monthly reports. Presenting Data Analysis Procedure For Strategy Reporting Designs PDF to dispense important information. This template comprises five stages. It also presents valuable insights into the topics including Data Collection, Data Synthesis, Analysis And Insight. This is a completely customizable PowerPoint theme that can be put to use immediately. So, download it and address the topic impactfully.
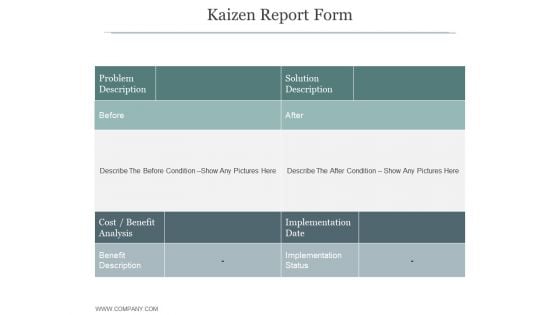
Kaizen Report Form Ppt PowerPoint Presentation Design Ideas
This is a kaizen report form ppt powerpoint presentation design ideas. This is a two stage process. The stages in this process are problem description, solution description, implementation date, benefit description, implementation status.
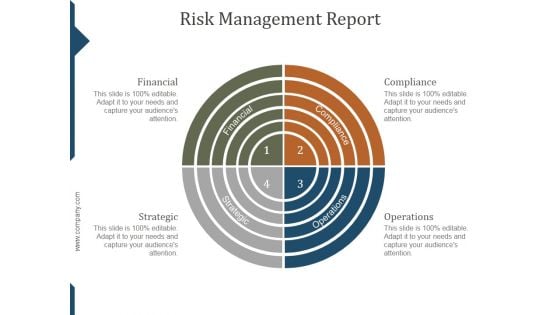
Risk Management Report Template Ppt PowerPoint Presentation Slide Download
This is a risk management report template ppt powerpoint presentation slide download. This is a four stage process. The stages in this process are almost certain, likely, possible, unlikely, rare.
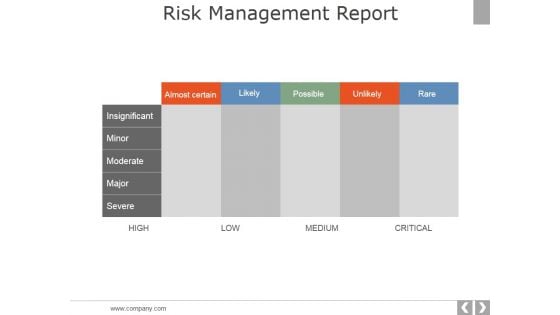
Risk Management Report Template 2 Ppt PowerPoint Presentation Infographics Brochure
This is a risk management report template 2 ppt powerpoint presentation infographics brochure. This is a five stage process. The stages in this process are insignificant, minor, moderate, major, severe.
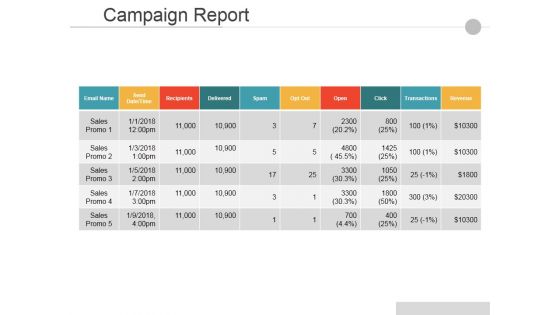
Campaign Report Ppt PowerPoint Presentation Show Graphic Tips
This is a campaign report ppt powerpoint presentation show graphic tips. This is a ten stage process. The stages in this process are email name, send date time, recipients, delivered, spam.
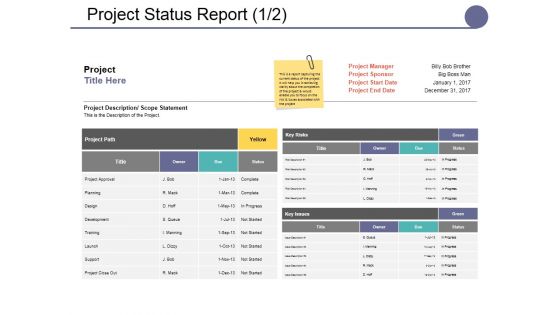
Project Status Report Ppt PowerPoint Presentation Slides Format Ideas
This is a project status report ppt powerpoint presentation slides format ideas. This is a six stage process. The stages in this process are deadlines, budget, requirements, overall status, next steps.
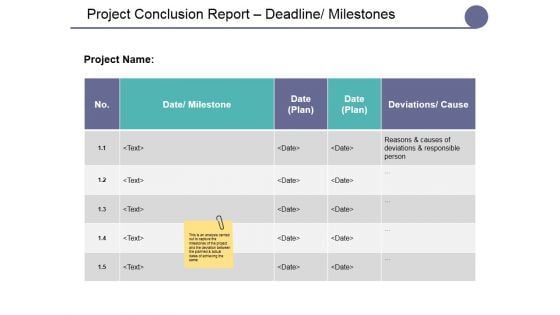
Project Conclusion Report Deadline Milestones Ppt PowerPoint Presentation Outline Guidelines
This is a project conclusion report deadline milestones ppt powerpoint presentation outline guidelines. This is a four stage process. The stages in this process are staff costs, material, travel expenses, advertising expenses, hardware.
Project Conclusion Report Budget Costs Ppt PowerPoint Presentation Icon Graphics
This is a project conclusion report budget costs ppt powerpoint presentation icon graphics. This is a four stage process. The stages in this process are type of cost, planned costs, actual costs, equipment.
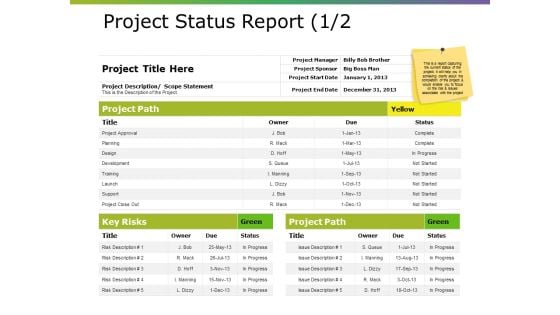
Project Status Report Ppt PowerPoint Presentation Portfolio Structure
This is a project status report ppt powerpoint presentation portfolio structure. This is a three stage process. The stages in this process are project path, key risks, project approval, planning, design.

Project Conclusion Report Deadline Milestones Ppt PowerPoint Presentation File Examples
This is a project conclusion report deadline milestones ppt powerpoint presentation file examples. This is a four stage process. The stages in this process are date, milestone, deviations, cause.
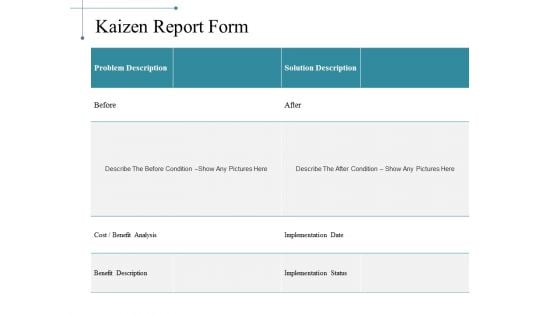
Kaizen Report Form Ppt PowerPoint Presentation Styles Samples
This is a kaizen report form ppt powerpoint presentation styles samples. This is a four stage process. The stages in this process are problem description, solution description, before, after, implementation date.
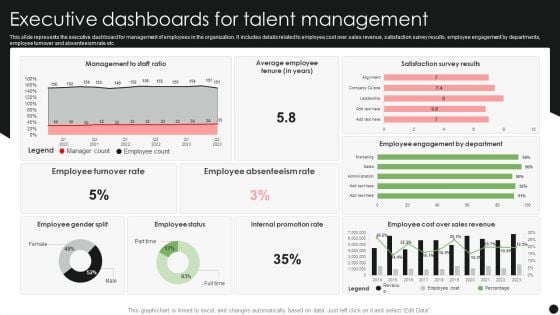
Executive Dashboards For Talent Management Pictures PDF
This slide represents the executive dashboard for management of employees in the organization. It includes details related to employee cost over sales revenue, satisfaction survey results, employee engagement by departments, employee turnover and absenteeism rate etc. Showcasing this set of slides titled Executive Dashboards For Talent Management Pictures PDF. The topics addressed in these templates are Employee Turnover Rate, Employee Absenteeism Rate, Internal Promotion Rate. All the content presented in this PPT design is completely editable. Download it and make adjustments in color, background, font etc. as per your unique business setting.
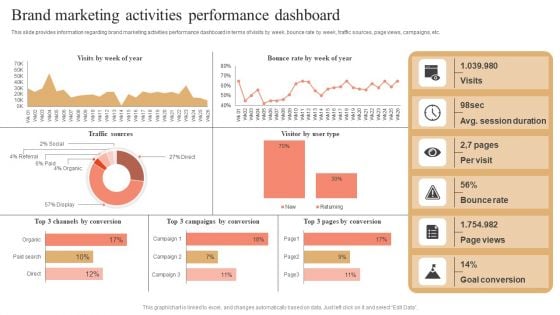
Brand Marketing Activities Performance Dashboard Pictures PDF
This slide provides information regarding brand marketing activities performance dashboard in terms of visits by week, bounce rate by week, traffic sources, page views, campaigns, etc. Welcome to our selection of the Brand Marketing Activities Performance Dashboard Pictures PDF. These are designed to help you showcase your creativity and bring your sphere to life. Planning and Innovation are essential for any business that is just starting out. This collection contains the designs that you need for your everyday presentations. All of our PowerPoints are 100 percent editable, so you can customize them to suit your needs. This multi-purpose template can be used in various situations. Grab these presentation templates today
Best Way Scan Old Photos In Powerpoint And Google Slides Cpb
Presenting our innovatively-designed set of slides titled Best Way Scan Old Photos In Powerpoint And Google Slides Cpb. This completely editable PowerPoint graphic exhibits Best Way Scan Old Photos that will help you convey the message impactfully. It can be accessed with Google Slides and is available in both standard screen and widescreen aspect ratios. Apart from this, you can download this well-structured PowerPoint template design in different formats like PDF, JPG, and PNG. So, click the download button now to gain full access to this PPT design. Our Best Way Scan Old Photos In Powerpoint And Google Slides Cpb are topically designed to provide an attractive backdrop to any subject. Use them to look like a presentation pro.
Marketplace Report Ensure Product Analyzing Customer Buying Behavior Enhance Conversion Rules Pdf
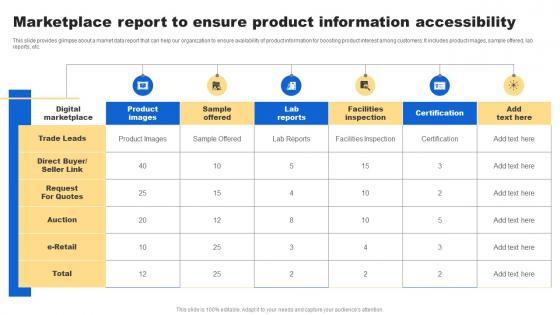
This slide provides glimpse about a market data report that can help our organization to ensure availability of product information for boosting product interest among customers. It includes product images, sample offered, lab reports, etc. Formulating a presentation can take up a lot of effort and time, so the content and message should always be the primary focus. The visuals of the PowerPoint can enhance the presenters message, so our Marketplace Report Ensure Product Analyzing Customer Buying Behavior Enhance Conversion Rules Pdf was created to help save time. Instead of worrying about the design, the presenter can concentrate on the message while our designers work on creating the ideal templates for whatever situation is needed. Slidegeeks has experts for everything from amazing designs to valuable content, we have put everything into Marketplace Report Ensure Product Analyzing Customer Buying Behavior Enhance Conversion Rules Pdf This slide provides glimpse about a market data report that can help our organization to ensure availability of product information for boosting product interest among customers. It includes product images, sample offered, lab reports, etc.
Marketplace Report To Ensure Product Information Overview Of Customer Adoption Process Inspiration Pdf
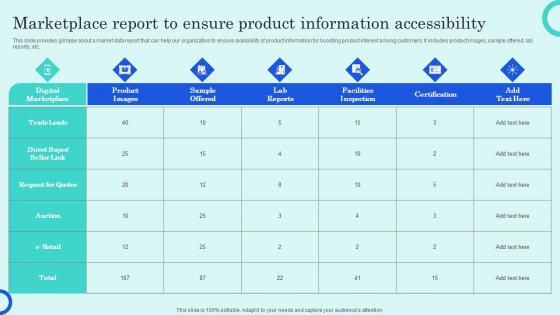
This slide provides glimpse about a market data report that can help our organization to ensure availability of product information for boosting product interest among customers. It includes product images, sample offered, lab reports, etc. Crafting an eye catching presentation has never been more straightforward. Let your presentation shine with this tasteful yet straightforward Marketplace Report To Ensure Product Information Overview Of Customer Adoption Process Inspiration Pdf template. It offers a minimalistic and classy look that is great for making a statement. The colors have been employed intelligently to add a bit of playfulness while still remaining professional. Construct the ideal Marketplace Report To Ensure Product Information Overview Of Customer Adoption Process Inspiration Pdf that effortlessly grabs the attention of your audience Begin now and be certain to wow your customers. This slide provides glimpse about a market data report that can help our organization to ensure availability of product information for boosting product interest among customers. It includes product images, sample offered, lab reports, etc.

Dashboard Ppt PowerPoint Presentation Ideas Graphics Pictures
Presenting this set of slides with name dashboard ppt powerpoint presentation ideas graphics pictures. The topics discussed in these slides are ytd sales vs yr sm, net sales vs last yr sm, net sales vs last yr sm. This is a completely editable PowerPoint presentation and is available for immediate download. Download now and impress your audience.

Customer 360 Overview Training Required For Marketing Strategies Ppt Pictures Background Images PDF
Presenting this set of slides with name customer 360 overview training required for marketing strategies ppt pictures background images pdf. This is a six stage process. The stages in this process are product knowledge, ms excel training, reporting format, xyz software usage. This is a completely editable PowerPoint presentation and is available for immediate download. Download now and impress your audience.
Stock Performance Dashboard For Metrics Team Management Ppt Outline Icons PDF
This slide represents the dashboard for tracking the management team member, manager, and teams ability to ensure inventory accuracy over time. It includes KPIs such as inventory, average result area scores and result areas. Pitch your topic with ease and precision using this Stock Performance Dashboard For Metrics Team Management Ppt Outline Icons PDF. This layout presents information on Result areas, Metrics Team, Needs Help. It is also available for immediate download and adjustment. So, changes can be made in the color, design, graphics or any other component to create a unique layout.
Marketing Success Metrics Website Landing Page Kpi Tracking Dashboard Elements PDF
This slide covers a dashboard for analysing the metrics of the website landing page. It includes kpis such as conversions, conversion rate, sessions, bounce rate, engagement sickness, etc. From laying roadmaps to briefing everything in detail, our templates are perfect for you. You can set the stage with your presentation slides. All you have to do is download these easy-to-edit and customizable templates. Marketing Success Metrics Website Landing Page Kpi Tracking Dashboard Elements PDF will help you deliver an outstanding performance that everyone would remember and praise you for. Do download this presentation today.
Management Dashboard Templates Presentation Diagram
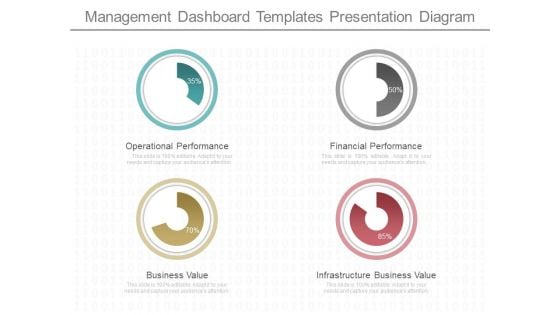
This is a management dashboard templates presentation diagram. This is a four stage process. The stages in this process are operational performance, business value, financial performance, infrastructure business value.
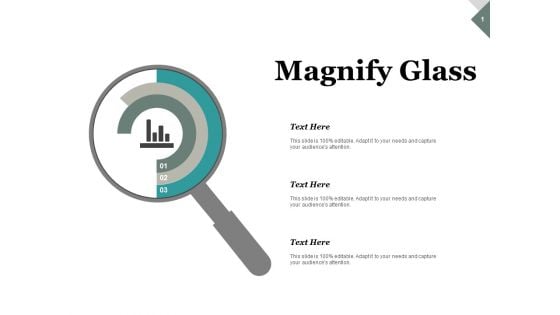
Magnify Glass Research Ppt PowerPoint Presentation Styles Gallery
This is a magnify glass research ppt powerpoint presentation styles gallery. This is a three stage process. The stages in this process are magnifying glass, research, marketing, strategy, business.


 Continue with Email

 Home
Home


