Two Graphs
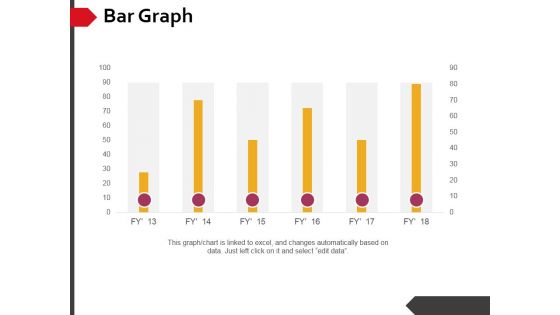
Bar Graph Ppt PowerPoint Presentation Professional Clipart
This is a bar graph ppt powerpoint presentation professional clipart. This is a six stage process. The stages in this process are bar graph, finance, marketing, strategy, business.
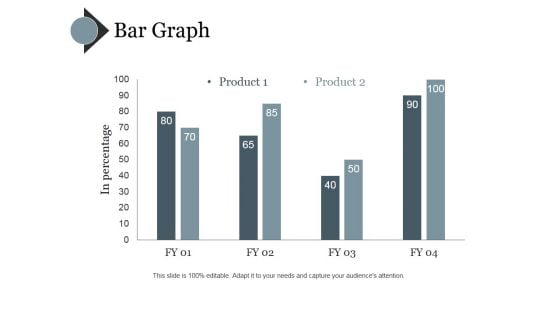
Bar Graph Ppt PowerPoint Presentation Styles Influencers
This is a bar graph ppt powerpoint presentation styles influencers. This is a four stage process. The stages in this process are bar, graph, business, marketing, finance.
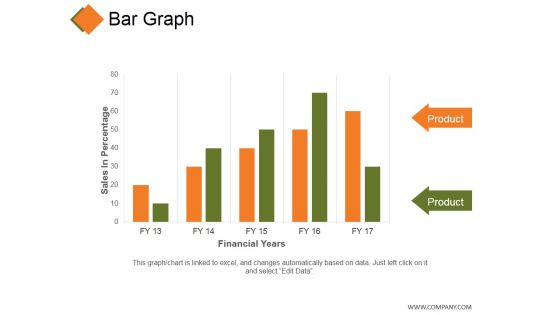
Bar Graph Ppt PowerPoint Presentation Layouts Layouts
This is a bar graph ppt powerpoint presentation layouts layouts. This is a five stage process. The stages in this process are product, financial years, business, graph, marketing.
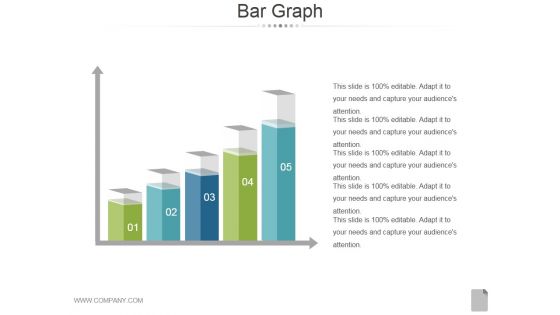
Bar Graph Ppt PowerPoint Presentation Guide
This is a bar graph ppt powerpoint presentation guide. This is a five stage process. The stages in this process are bar graph, finance, marketing, analysis, strategy, business.
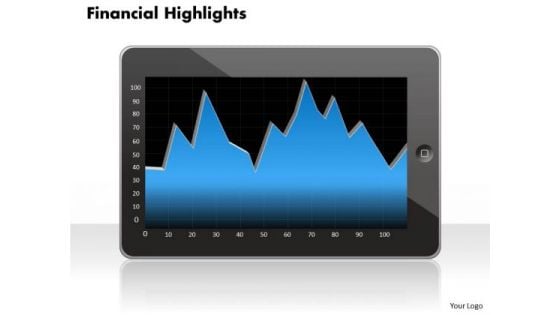
Business Framework Model Financial Graph Consulting Diagram
Document Your Views On Our Business Framework Model Financial Graph Consulting Diagram Powerpoint Templates. They Will Create A Strong Impression.
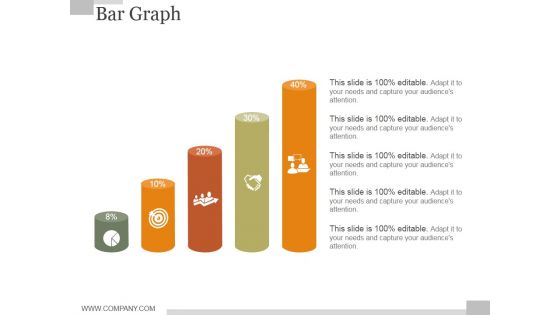
Bar Graph Ppt PowerPoint Presentation Inspiration
This is a bar graph ppt powerpoint presentation inspiration. This is a five stage process. The stages in this process are bar graph, finance, marketing, strategy, investment, analysis, business, success.
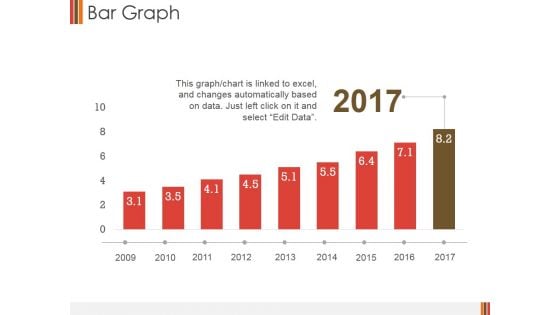
Bar Graph Ppt PowerPoint Presentation Show Topics
This is a bar graph ppt powerpoint presentation show topics. This is a nine stage process. The stages in this process are business, finance, marketing, strategy, bar graph, growth.
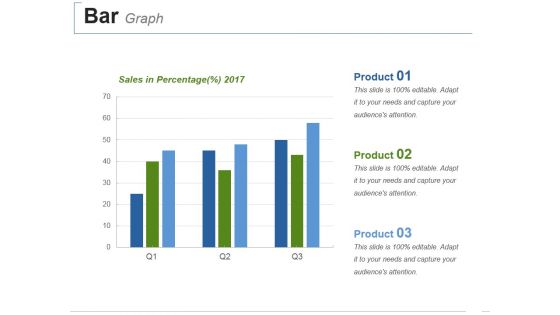
Bar Graph Ppt PowerPoint Presentation Portfolio Outline
This is a bar graph ppt powerpoint presentation portfolio outline. This is a three stage process. The stages in this process are bar graph, finance, marketing, strategy, investment, business.
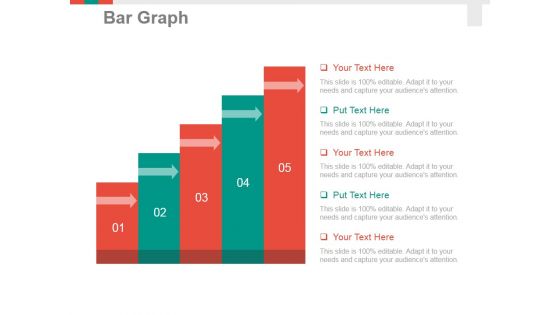
Bar Graph Ppt PowerPoint Presentation Pictures Tips
This is a bar graph ppt powerpoint presentation pictures tips. This is a five stage process. The stages in this process are bar graph, finance, marketing, strategy, analysis, business.
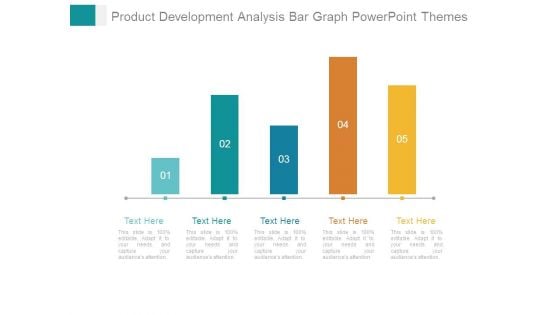
Product Development Analysis Bar Graph Powerpoint Themes
This is a product development analysis bar graph powerpoint themes. This is a five stage process. The stages in this process are business, growth, strategy, management, pretention.
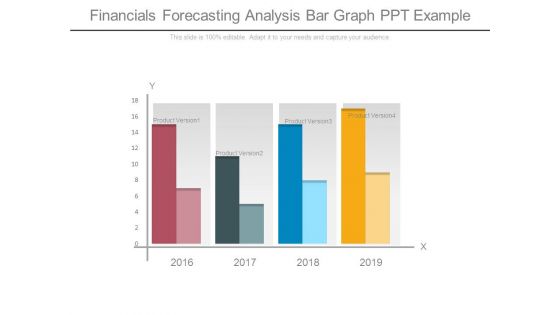
Financials Forecasting Analysis Bar Graph Ppt Example
This is a financials forecasting analysis bar graph ppt example. This is a four stage process. The stages in this process are product version.
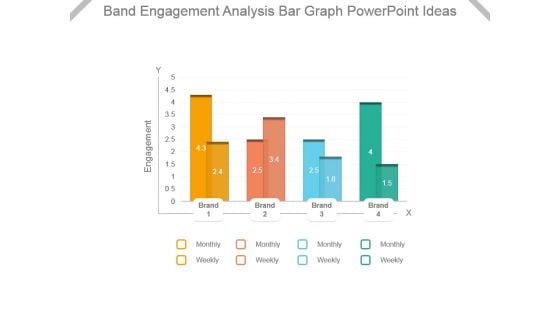
Band Engagement Analysis Bar Graph Powerpoint Ideas
This is a band engagement analysis bar graph powerpoint ideas. This is a four stage process. The stages in this process are engagement, brand, monthly, weekly.
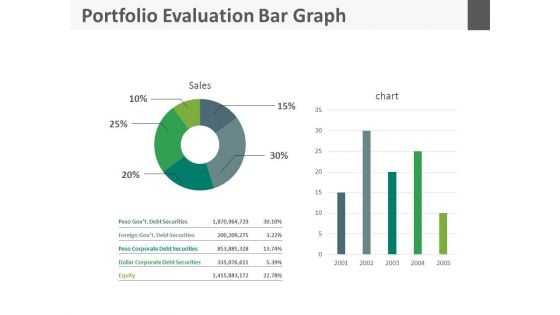
Portfolio Evaluation Bar Graph Ppt Slides
This is a portfolio evaluation bar graph ppt slides. This is a five stage process. The stages in this process are business, finance, marketing.
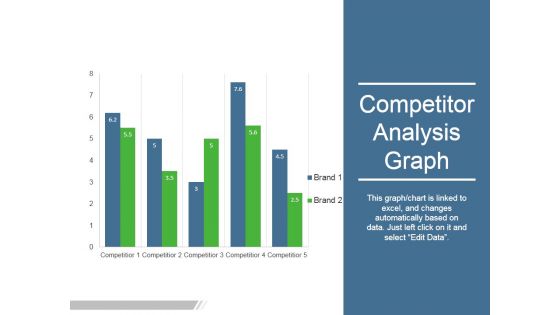
Competitor Analysis Graph Ppt PowerPoint Presentation Graphics
This is a competitor analysis graph ppt powerpoint presentation graphics. This is a five stage process. The stages in this process are competitor, business, marketing.
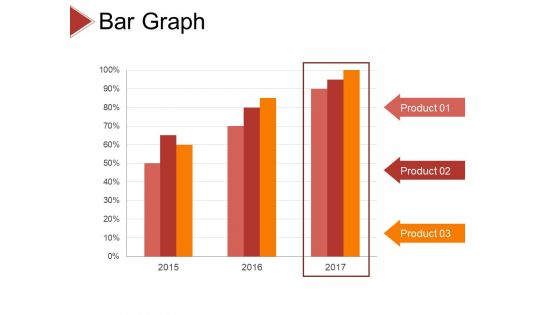
Bar Graph Ppt PowerPoint Presentation Layouts Gridlines
This is a bar graph ppt powerpoint presentation layouts gridlines. this is a three stage process. The stages in this process are product, percentage, business, marketing, management.

Bar Graph Ppt PowerPoint Presentation Gallery Inspiration
This is a bar graph ppt powerpoint presentation gallery inspiration. This is a three stage process. The stages in this process are product, sales in percentage, finance, success.
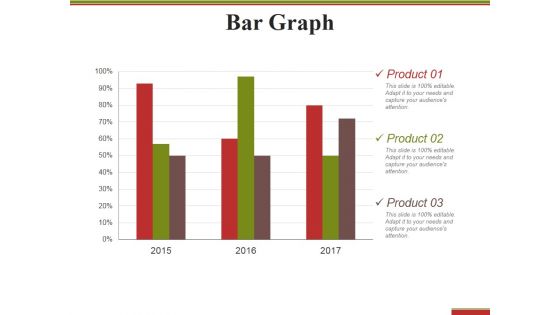
Bar Graph Ppt PowerPoint Presentation Outline Structure
This is a bar graph ppt powerpoint presentation outline structure. This is a three stage process. The stages in this process are product, percentage, finance, business.
Bar Graph Ppt PowerPoint Presentation Icon
This is a bar graph ppt powerpoint presentation icon. This is a three stage process. The stages in this process are business, finance, marketing, strategy, analysis.
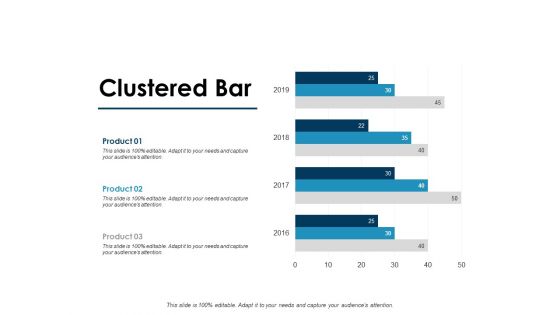
Clustered Bar Graph Ppt PowerPoint Presentation Templates
This is a clustered bar graph ppt powerpoint presentation templates. This is a three stage process. The stages in this process are finance, marketing, management, investment, analysis.

Financial Graph Ppt PowerPoint Presentation Visuals
This is a financial graph ppt powerpoint presentation visuals. This is a three stage process. The stages in this process are finance, marketing, analysis, investment, million.
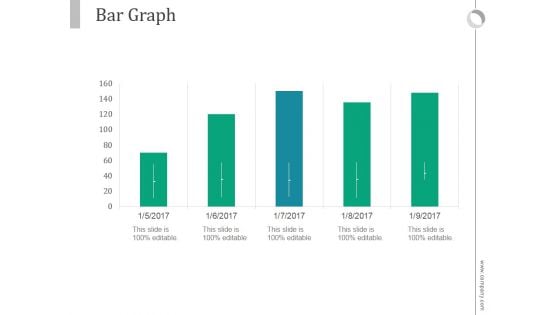
Bar Graph Ppt PowerPoint Presentation Model
This is a bar graph ppt powerpoint presentation model. This is a five stage process. The stages in this process are business, marketing, bar slides, management, finance.
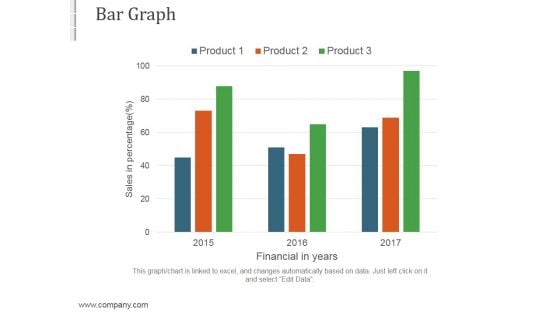
Bar Graph Ppt PowerPoint Presentation Themes
This is a bar graph ppt powerpoint presentation themes. This is a three stage process. The stages in this process are business, marketing, strategy, success, management.
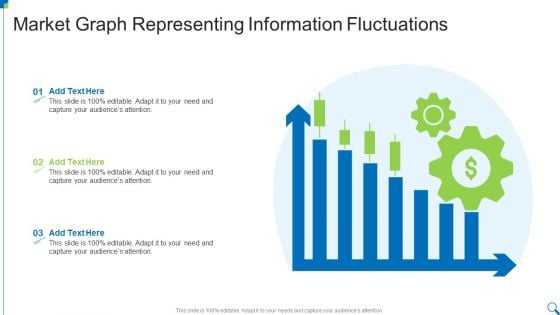
Market Graph Representing Information Fluctuations Diagrams PDF
Presenting Market Graph Representing Information Fluctuations Diagrams PDF to dispense important information. This template comprises three stages. It also presents valuable insights into the topics including Market Graph, Representing, Information Fluctuations This is a completely customizable PowerPoint theme that can be put to use immediately. So, download it and address the topic impactfully.
Investment Portfolio Advantages Graph Icon Rules PDF
Presenting Investment Portfolio Advantages Graph Icon Rules PDF to dispense important information. This template comprises three stages. It also presents valuable insights into the topics including Investment Portfolio, Advantages Graph Icon. This is a completely customizable PowerPoint theme that can be put to use immediately. So, download it and address the topic impactfully.
Bar Graph With Five Icons Powerpoint Slides
This PowerPoint slide contains diagram bar graph with icons. This PPT slide helps to exhibit concepts of financial deal and planning. Use this business slide to make impressive presentations.
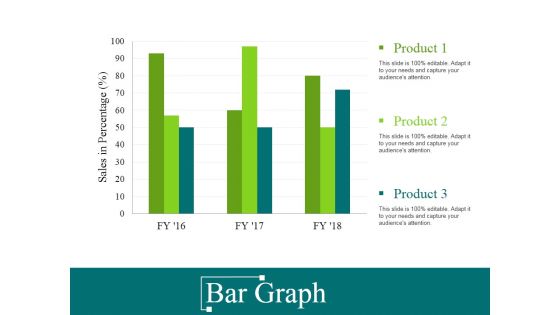
Bar Graph Ppt PowerPoint Presentation Gallery Grid
This is a bar graph ppt powerpoint presentation gallery grid. This is a three stage process. The stages in this process are sales in percentage, product, finance, business, marketing.
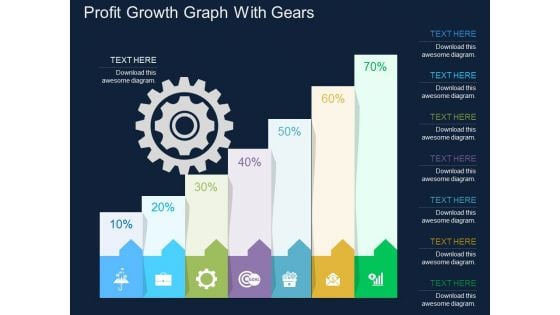
Profit Growth Graph With Gears Powerpoint Template
This business slide contains profit growth graph with gears. This PowerPoint template helps to display outline of business plan. Use this diagram to impart more clarity to data and to create more sound impact on viewers.
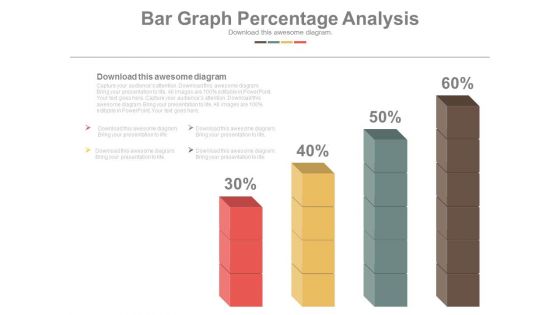
Bar Graph Displaying Profit Growth Powerpoint Slides
This PowerPoint template has been designed with six point?s bar graph with icons. This PPT slide can be used to prepare presentations for marketing reports and also for financial data analysis. You can download finance PowerPoint template to prepare awesome presentations.
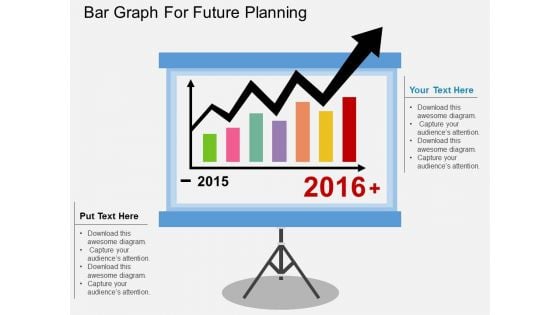
Bar Graph For Future Planning Powerpoint Template
This business diagram display bar graph for years 2015 and 2016. You may use this slide to display statistical analysis. This diagram provides an effective way of displaying information you can edit text, color, shade and style as per you need.
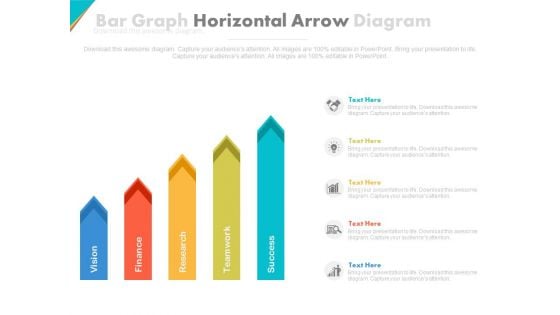
Five Horizontal Arrows Bar Graph Powerpoint Slides
This PowerPoint template contains five horizontal arrows bra graph. You may download this PPT slide design to display steps of strategic planning. You can easily customize this template to make it more unique as per your need.
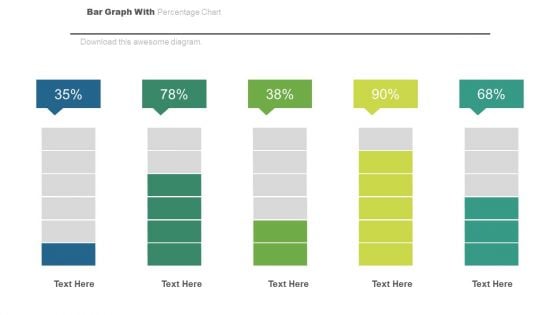
Bar Graph For Statistical Analysis Powerpoint Slides
This PowerPoint template has been designed with bar chart and percentage values. You may download this PPT slide to depict statistical analysis. Add this slide to your presentation and impress your superiors.

Algorithm Graph Pattern Matching Ppt PowerPoint Presentation Inspiration Background Images
This is a algorithm graph pattern matching ppt powerpoint presentation inspiration background images. This is a two stage process. The stages in this process are graph theory, chart theory, business.
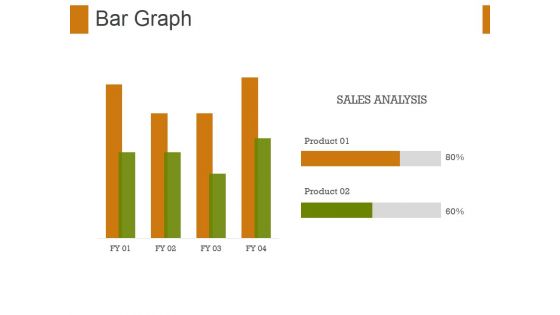
Bar Graph Ppt PowerPoint Presentation File Graphic Tips
This is a bar graph ppt powerpoint presentation file graphic tips. This is a two stage process. The stages in this process are bar graph, finance, marketing, strategy, sales, business.
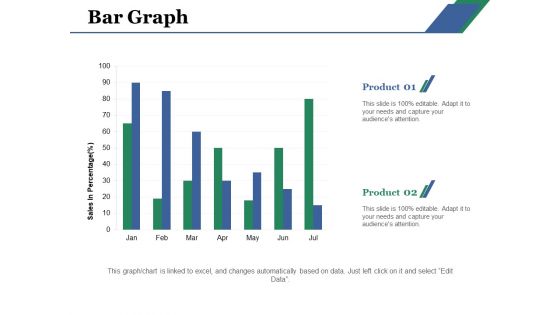
Bar Graph Ppt PowerPoint Presentation Infographic Template Demonstration
This is a bar graph ppt powerpoint presentation infographic template demonstration. This is a two stage process. The stages in this process are bar graph, product, sales, percentage, financial.
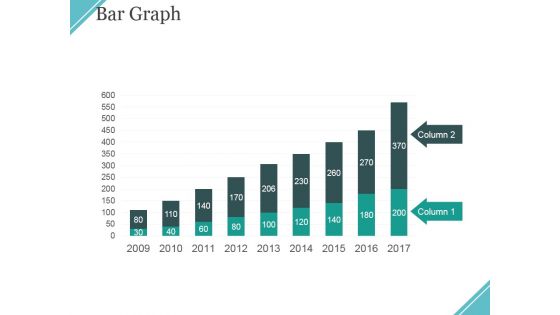
Bar Graph Ppt PowerPoint Presentation Gallery Example File
This is a bar graph ppt powerpoint presentation gallery example file. This is a two stage process. The stages in this process are column, bar graph, business, marketing, management.

Healthcare Images Ppt PowerPoint Presentation Diagram Graph Charts PDF
Persuade your audience using this Healthcare Images Ppt PowerPoint Presentation Diagram Graph Charts PDF. This PPT design covers Two stages, thus making it a great tool to use. It also caters to a variety of topics including Healthcare Images. Download this PPT design now to present a convincing pitch that not only emphasizes the topic but also showcases your presentation skills.

Auto Sales Profit Scorecard For Two And Four Wheeler Vehicles Inspiration PDF
This graph or chart is linked to excel, and changes automatically based on data. Just left click on it and select Edit Data. Deliver an awe inspiring pitch with this creative Auto Sales Profit Scorecard For Two And Four Wheeler Vehicles Inspiration PDF bundle. Topics like Two Wheeler Vehicles, Four Wheeler Vehicles, Six Wheeler Vehicles can be discussed with this completely editable template. It is available for immediate download depending on the needs and requirements of the user.
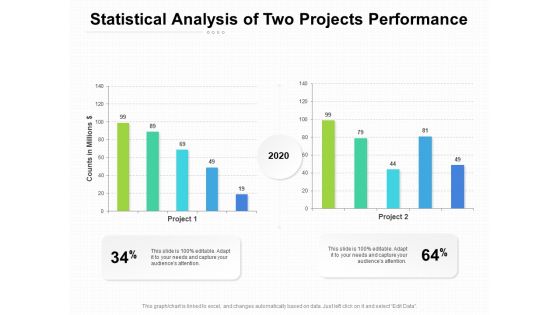
Statistical Analysis Of Two Projects Performance Ppt PowerPoint Presentation Show Picture PDF
Presenting this set of slides with name statistical analysis of two projects performance ppt powerpoint presentation show picture pdf. The topics discussed in these slides are statistical analysis of two projects performance, 2020. This is a completely editable PowerPoint presentation and is available for immediate download. Download now and impress your audience.
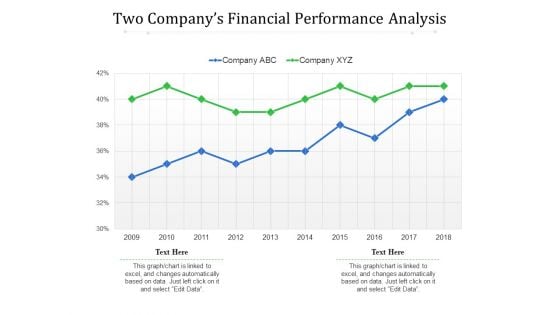
Two Companys Financial Performance Analysis Ppt PowerPoint Presentation File Format PDF
Presenting this set of slides with name two companys financial performance analysis ppt powerpoint presentation file format pdf. The topics discussed in these slide is two companys financial performance analysis. This is a completely editable PowerPoint presentation and is available for immediate download. Download now and impress your audience.
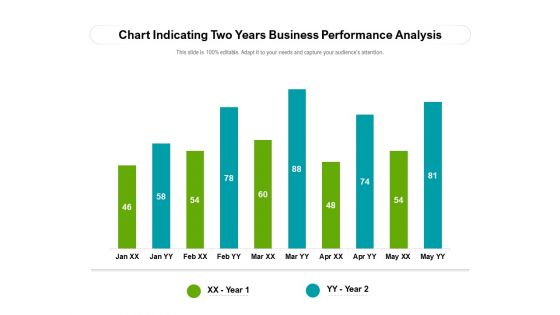
Chart Indicating Two Years Business Performance Analysis Ppt PowerPoint Presentation File Grid PDF
Showcasing this set of slides titled chart indicating two years business performance analysis ppt powerpoint presentation file grid pdf. The topics addressed in these templates are chart indicating two years business performance analysis. All the content presented in this PPT design is completely editable. Download it and make ajustments in color, background, font etc. as per your unique business setting.
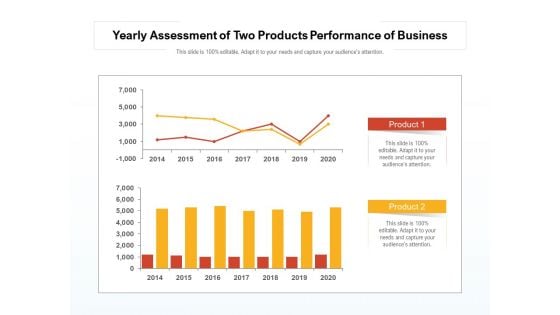
Yearly Assessment Of Two Products Performance Of Business Ppt PowerPoint Presentation Gallery Layout PDF
Showcasing this set of slides titled yearly assessment of two products performance of business ppt powerpoint presentation gallery layout pdf. The topics addressed in these templates are yearly assessment of two products performance of business. All the content presented in this PPT design is completely editable. Download it and make ajustments in color, background, font etc. as per your unique business setting.
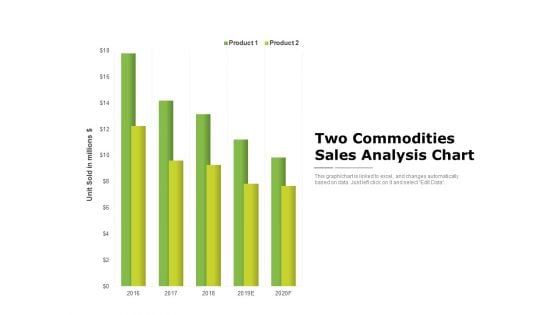
Two Commodities Sales Analysis Chart Ppt PowerPoint Presentation Ideas Inspiration PDF
Showcasing this set of slides titled two commodities sales analysis chart ppt powerpoint presentation ideas inspiration pdf. The topics addressed in these templates are two commodities sales analysis chart. All the content presented in this PPT design is completely editable. Download it and make adjustments in color, background, font etc. as per your unique business setting.

Two Products Comparison Stacked Chart Ppt PowerPoint Presentation Gallery Structure PDF
Pitch your topic with ease and precision using this two products comparison stacked chart ppt powerpoint presentation gallery structure pdf. This layout presents information on two products comparison stacked chart. It is also available for immediate download and adjustment. So, changes can be made in the color, design, graphics or any other component to create a unique layout.
Annual Two Product Performance Analysis Chart Ppt PowerPoint Presentation Icon Design Templates PDF
Pitch your topic with ease and precision using this annual two product performance analysis chart ppt powerpoint presentation icon design templates pdf. This layout presents information on annual, two product performance, analysis chart. It is also available for immediate download and adjustment. So, changes can be made in the color, design, graphics or any other component to create a unique layout.
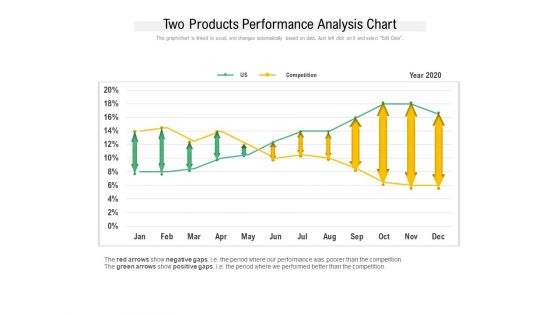
Two Products Performance Analysis Chart Ppt PowerPoint Presentation Layouts Aids PDF
Showcasing this set of slides titled two products performance analysis chart ppt powerpoint presentation layouts aids pdf. The topics addressed in these templates are competition, year 2020, two products performance, analysis chart. All the content presented in this PPT design is completely editable. Download it and make adjustments in color, background, font etc. as per your unique business setting.
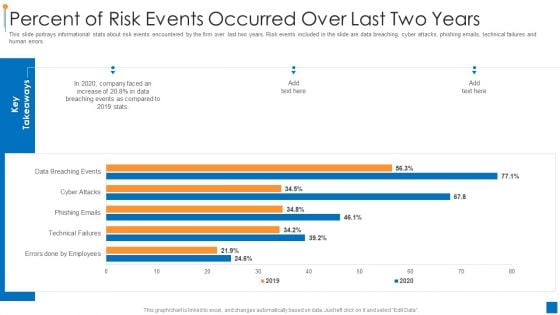
International Organization Standardization 270001 Percent Of Risk Events Occurred Over Last Two Years Demonstration PDF
This slide portrays informational stats about risk events encountered by the firm over last two years. Risk events included in the slide are data breaching, cyber attacks, phishing emails, technical failures and human errors. Deliver an awe inspiring pitch with this creative international organization standardization 270001 percent of risk events occurred over last two years demonstration pdf bundle. Topics like percent of risk events occurred over last two years can be discussed with this completely editable template. It is available for immediate download depending on the needs and requirements of the user.
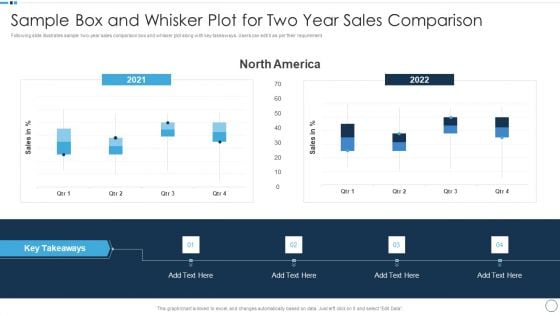
QA Plan Set 1 Sample Box And Whisker Plot For Two Year Sales Comparison Themes PDF
Following slide illustrates sample two year sales comparison box and whisker plot along with key takeaways. Users can edit it as per their requirement. Deliver and pitch your topic in the best possible manner with this QA Plan Set 1 Sample Box And Whisker Plot For Two Year Sales Comparison Themes PDF. Use them to share invaluable insights on Sales Comparison and impress your audience. This template can be altered and modified as per your expectations. So, grab it now.
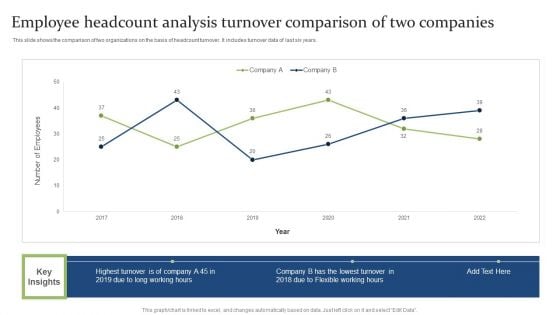
Employee Headcount Analysis Turnover Comparison Of Two Companies Ppt PowerPoint Presentation Infographics Smartart PDF
This slide shows the comparison of two organizations on the basis of headcount turnover. It includes turnover data of last six years. Showcasing this set of slides titled Employee Headcount Analysis Turnover Comparison Of Two Companies Ppt PowerPoint Presentation Infographics Smartart PDF. The topics addressed in these templates are Highest Turnover, Flexible Working, Lowest. All the content presented in this PPT design is completely editable. Download it and make adjustments in color, background, font etc. as per your unique business setting.
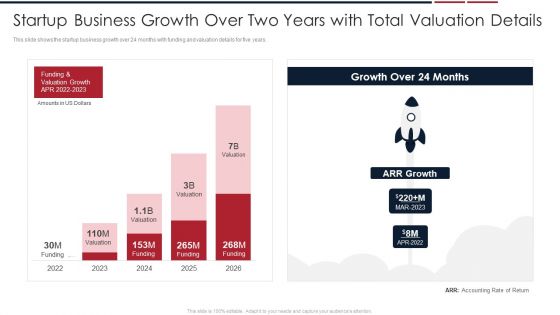
Assessing Startup Company Value Startup Business Growth Over Two Years With Total Valuation Details Background PDF
This slide shows the startup business growth over 24 months with funding and valuation details for five years. Deliver an awe inspiring pitch with this creative assessing startup company value startup business growth over two years with total valuation details background pdf bundle. Topics like startup business growth over two years with total valuation details can be discussed with this completely editable template. It is available for immediate download depending on the needs and requirements of the user.
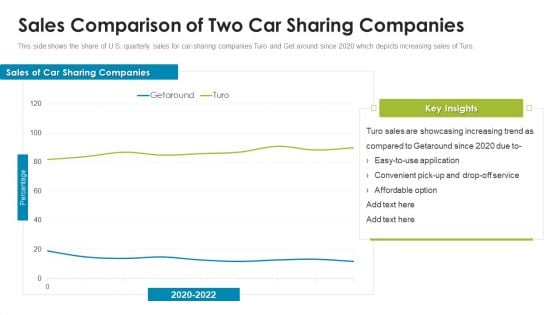
Turo Investor Capital Fundraising Pitch Deck Sales Comparison Of Two Car Sharing Companies Elements PDF
This side shows the share of U.S. quarterly sales for car-sharing companies Turo and Get around since 2020 which depicts increasing sales of Turo. Deliver an awe inspiring pitch with this creative turo investor capital fundraising pitch deck sales comparison of two car sharing companies elements pdf bundle. Topics like sales comparison of two car sharing companies can be discussed with this completely editable template. It is available for immediate download depending on the needs and requirements of the user.
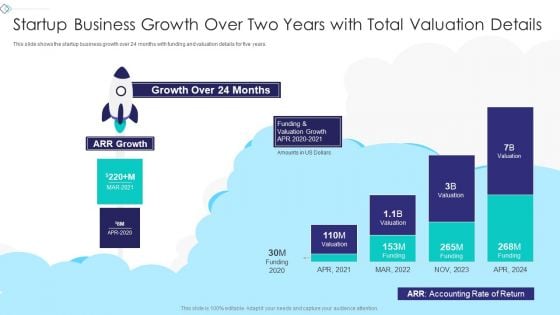
Startup Company Valuation Methodologies Startup Business Growth Over Two Years Slides PDF
This slide shows the startup business growth over 24 months with funding and valuation details for five years.Deliver an awe inspiring pitch with this creative Startup Company Valuation Methodologies Startup Business Growth Over Two Years Slides PDF bundle. Topics like Startup Business, Growth Over Two Years, Total Valuation Details can be discussed with this completely editable template. It is available for immediate download depending on the needs and requirements of the user.
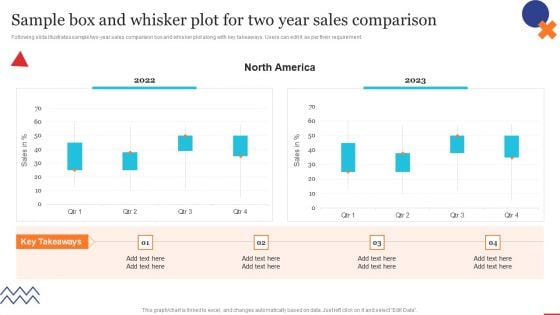
Sample Box And Whisker Plot For Two Year Quality Control Planning Templates Set 1 Download PDF
Following slide illustrates sample two-year sales comparison box and whisker plot along with key takeaways. Users can edit it as per their requirement.Find highly impressive Sample Box And Whisker Plot For Two Year Quality Control Planning Templates Set 1 Download PDF on Slidegeeks to deliver a meaningful presentation. You can save an ample amount of time using these presentation templates. No need to worry to prepare everything from scratch because Slidegeeks experts have already done a huge research and work for you. You need to download Sample Box And Whisker Plot For Two Year Quality Control Planning Templates Set 1 Download PDF for your upcoming presentation. All the presentation templates are 100precent editable and you can change the color and personalize the content accordingly. Download now,
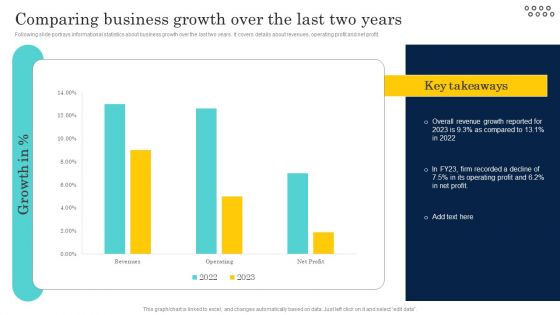
Optimizing And Managing Retail Comparing Business Growth Over The Last Two Pictures PDF
Following slide portrays informational statistics about business growth over the last two years. It covers details about revenues, operating profit and net profit. Do you have to make sure that everyone on your team knows about any specific topic I yes, then you should give Optimizing And Managing Retail Comparing Business Growth Over The Last Two Pictures PDF a try. Our experts have put a lot of knowledge and effort into creating this impeccable Optimizing And Managing Retail Comparing Business Growth Over The Last Two Pictures PDF. You can use this template for your upcoming presentations, as the slides are perfect to represent even the tiniest detail. You can download these templates from the Slidegeeks website and these are easy to edit. So grab these today.
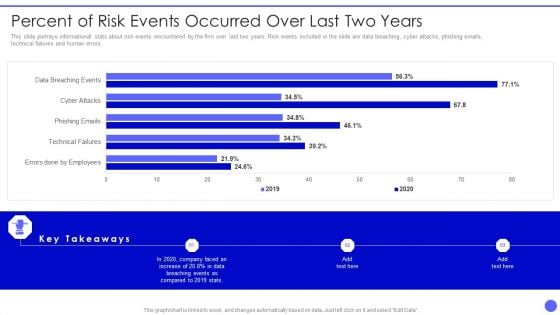
Info Safety And ISO 27001 Percent Of Risk Events Occurred Over Last Two Years Clipart PDF
This slide portrays informational stats about risk events encountered by the firm over last two years. Risk events included in the slide are data breaching, cyber attacks, phishing emails, technical failures and human errors. Deliver an awe inspiring pitch with this creative Info Safety And ISO 27001 Percent Of Risk Events Occurred Over Last Two Years Clipart PDF bundle. Topics like Errors Done By Employees, Technical Failures, Phishing Emails, Cyber Attacks can be discussed with this completely editable template. It is available for immediate download depending on the needs and requirements of the user.
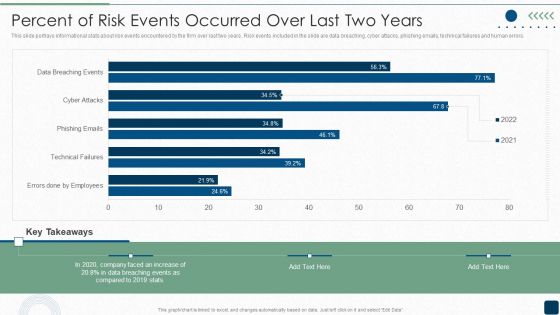
Percent Of Risk Events Occurred Over Last Two Years Inspiration PDF
This slide portrays informational stats about risk events encountered by the firm over last two years. Risk events included in the slide are data breaching, cyber attacks, phishing emails, technical failures and human errors.Deliver and pitch your topic in the best possible manner with this Percent Of Risk Events Occurred Over Last Two Years Inspiration PDF. Use them to share invaluable insights on Data Breaching, Key Takeaways, Faced An Increase and impress your audience. This template can be altered and modified as per your expectations. So, grab it now.
ISO 27001 Organizational Qualifying Procedure Percent Of Risk Events Occurred Over Last Two Years Icons PDF
This slide portrays informational stats about risk events encountered by the firm over last two years. Risk events included in the slide are data breaching, cyber attacks, phishing emails, technical failures and human errors.Deliver an awe inspiring pitch with this creative ISO 27001 Organizational Qualifying Procedure Percent Of Risk Events Occurred Over Last Two Years Icons PDF bundle. Topics like Technical Failures, Phishing Emails, Data Breaching can be discussed with this completely editable template. It is available for immediate download depending on the needs and requirements of the user.
Two Companies Comparison Chart With Sustainability Ppt PowerPoint Presentation Icon Model PDF
Showcasing this set of slides titled two companies comparison chart with sustainability ppt powerpoint presentation icon model pdf. The topics addressed in these templates are develop, leadership, sustainability. All the content presented in this PPT design is completely editable. Download it and make adjustments in color, background, font etc. as per your unique business setting.
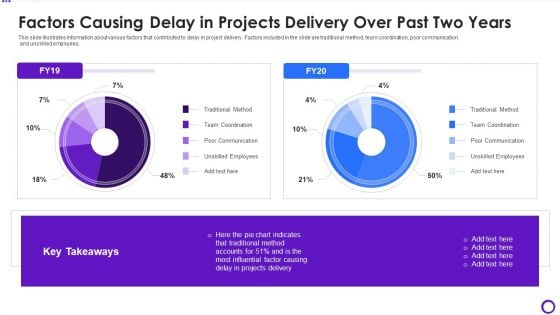
Factors Causing Delay In Projects Delivery Over Past Two Years Guidelines PDF
This slide illustrates information about various factors that contributed to delay in project delivery. Factors included in the slide are traditional method, team coordination, poor communication and unskilled employees.Deliver an awe inspiring pitch with this creative factors causing delay in projects delivery over past two years guidelines pdf bundle. Topics like traditional method, team coordination, unskilled employees can be discussed with this completely editable template. It is available for immediate download depending on the needs and requirements of the user.
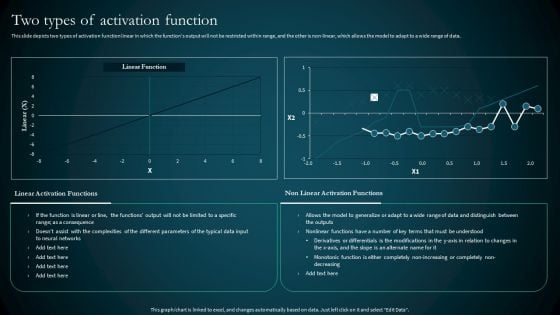
Artificial Reural Network Ann Computational Model Two Types Of Activation Function Slides PDF
This slide depicts two types of activation function linear in which the functions output will not be restricted within range, and the other is non linear, which allows the model to adapt to a wide range of data. Retrieve professionally designed Artificial Reural Network Ann Computational Model Two Types Of Activation Function Slides PDF to effectively convey your message and captivate your listeners. Save time by selecting pre made slideshows that are appropriate for various topics, from business to educational purposes. These themes come in many different styles, from creative to corporate, and all of them are easily adjustable and can be edited quickly. Access them as PowerPoint templates or as Google Slides themes. You do not have to go on a hunt for the perfect presentation because Slidegeeks got you covered from everywhere.
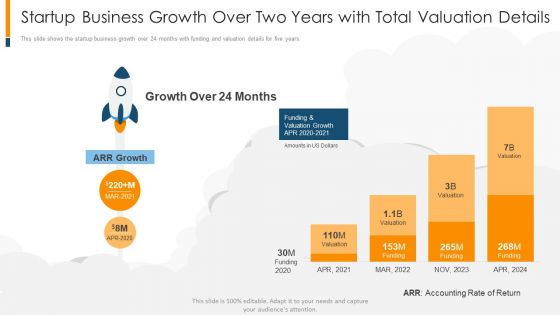
Startup Business Growth Over Two Years With Total Valuation Details Information PDF
This slide shows the startup business growth over 24 months with funding and valuation details for five years. Deliver an awe inspiring pitch with this creative startup business growth over two years with total valuation details information pdf bundle. Topics like growth, valuation, accounting rate of return can be discussed with this completely editable template. It is available for immediate download depending on the needs and requirements of the user.


 Continue with Email

 Home
Home


