Two Graphs
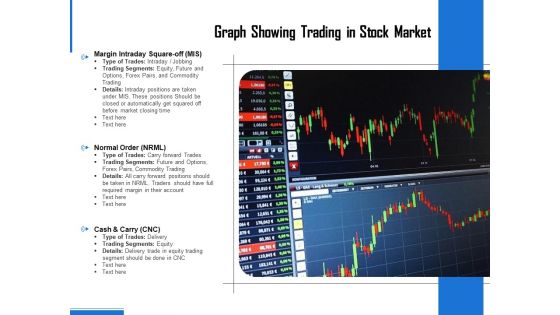
Graph Showing Trading In Stock Market Ppt PowerPoint Presentation Professional Backgrounds PDF
Persuade your audience using this graph showing trading in stock market ppt powerpoint presentation professional backgrounds pdf. This PPT design covers one stages, thus making it a great tool to use. It also caters to a variety of topics including margin intraday square off mis, normal order nrml, cash and carry cnc. Download this PPT design now to present a convincing pitch that not only emphasizes the topic but also showcases your presentation skills.
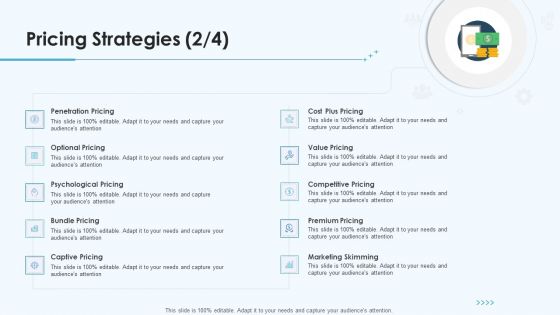
Product Pricing Strategies Pricing Strategies Skimming Ppt Diagram Graph Charts PDF
This is a product pricing strategies pricing strategies skimming ppt diagram graph charts pdf template with various stages. Focus and dispense information on ten stages using this creative set, that comes with editable features. It contains large content boxes to add your information on topics like psychological pricing, captive pricing, marketing skimming, premium pricing, value pricing. You can also showcase facts, figures, and other relevant content using this PPT layout. Grab it now.
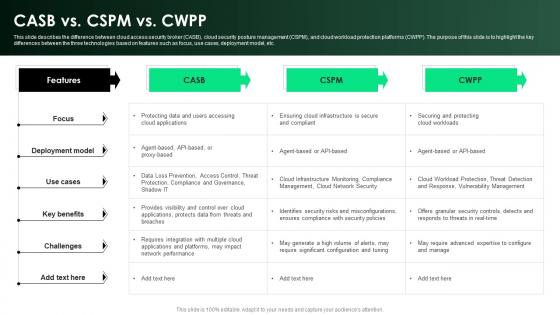
CASB 2 0 IT CASB Vs CSPM Vs CWPP Ppt Diagram Graph Charts
This slide describes the difference between cloud access security broker CASB , cloud security posture management CSPM , and cloud workload protection platforms CWPP . The purpose of this slide is to highlight the key differences between the three technologies based on features such as focus, use cases, deployment model, etc. Are you in need of a template that can accommodate all of your creative concepts This one is crafted professionally and can be altered to fit any style. Use it with Google Slides or PowerPoint. Include striking photographs, symbols, depictions, and other visuals. Fill, move around, or remove text boxes as desired. Test out color palettes and font mixtures. Edit and save your work, or work with colleagues. Download CASB 2 0 IT CASB Vs CSPM Vs CWPP Ppt Diagram Graph Charts and observe how to make your presentation outstanding. Give an impeccable presentation to your group and make your presentation unforgettable. This slide describes the difference between cloud access security broker CASB , cloud security posture management CSPM , and cloud workload protection platforms CWPP . The purpose of this slide is to highlight the key differences between the three technologies based on features such as focus, use cases, deployment model, etc.
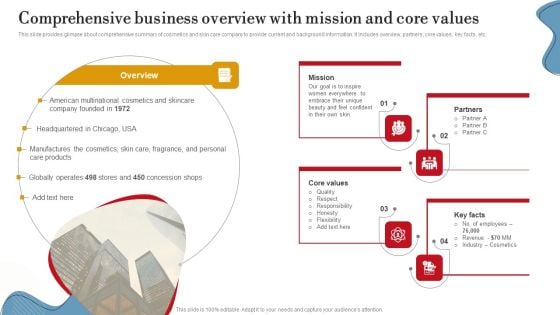
Comprehensive Business Overview With Mission And Core Values Ppt PowerPoint Presentation Diagram Graph Charts PDF
This slide provides glimpse about comprehensive summary of cosmetics and skin care company to provide current and background information. It includes overview, partners, core values, key facts, etc. Want to ace your presentation in front of a live audience Our Comprehensive Business Overview With Mission And Core Values Ppt PowerPoint Presentation Diagram Graph Charts PDF can help you do that by engaging all the users towards you. Slidegeeks experts have put their efforts and expertise into creating these impeccable powerpoint presentations so that you can communicate your ideas clearly. Moreover, all the templates are customizable, and easy to edit and downloadable. Use these for both personal and commercial use.

Presenting Deals And Offers To Lure Prospects Ppt PowerPoint Presentation Diagram Graph Charts PDF
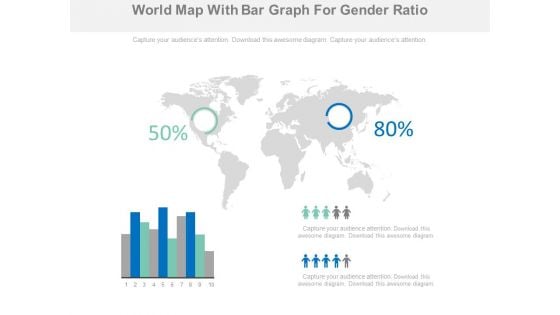
World Map With Bar Graph And Higher Population Areas Powerpoint Slides
This professionally designed PowerPoint template is as an effective tool to display high population areas on world. You can download this diagram to visually support your content. Above PPT slide is suitable for business presentation.
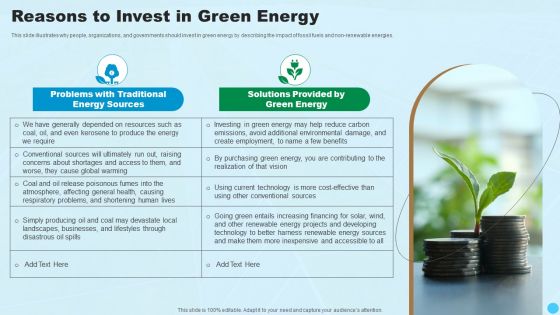
Reasons To Invest In Green Energy Clean And Renewable Energy Ppt PowerPoint Presentation Diagram Graph Charts PDF
This slide illustrates why people, organizations, and governments should invest in green energy by describing the impact of fossil fuels and non-renewable energies.Presenting Reasons To Invest In Green Energy Clean And Renewable Energy Ppt PowerPoint Presentation Diagram Graph Charts PDF to provide visual cues and insights. Share and navigate important information on two stages that need your due attention. This template can be used to pitch topics like Problems Traditional, Energy Sources, Solutions Provided. In addtion, this PPT design contains high resolution images, graphics, etc, that are easily editable and available for immediate download.
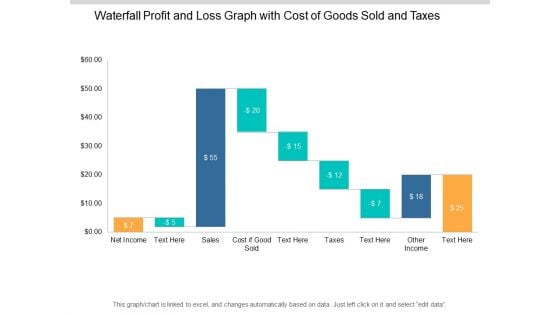
Waterfall Profit And Loss Graph With Cost Of Goods Sold And Taxes Ppt PowerPoint Presentation Show Slideshow
This is a waterfall profit and loss graph with cost of goods sold and taxes ppt powerpoint presentation show slideshow. This is a nine stage process. The stages in this process are sales waterfall, waterfall chart, business.
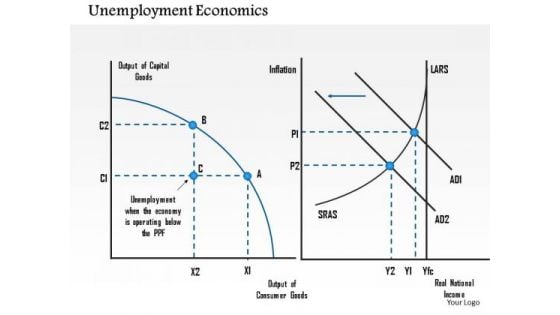
Business Framework Unemployment Economics PowerPoint Presentation
Two separate graphs are used to design this power point template. This PPT slide contains the concept of value addition. Use this PPT slide for value addition related presentations.
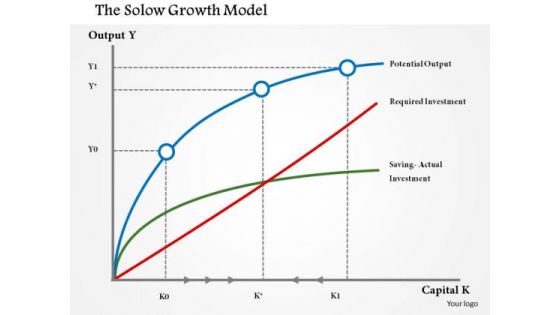
Business Framework Solow Growth PowerPoint Presentation
This Power Point template slide has been designed with two level graph with multiple points. This PPT slide contains the Solow growth. Use this PPT template for business and finance related presentations.
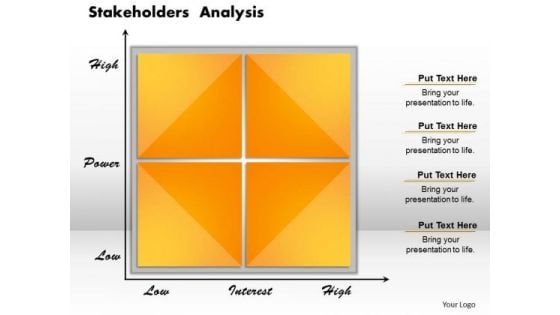
Business Framework Stakeholders Analysis PowerPoint Presentation
This Business framework Power Point template diagram has been crafted with graphic of yellow colored two axis graph. This graph can be used for displaying stakeholder analysis. Use this PPT diagram in your business and finance related presentations. Define marketing management and planning on the basis of this stakeholder analysis.
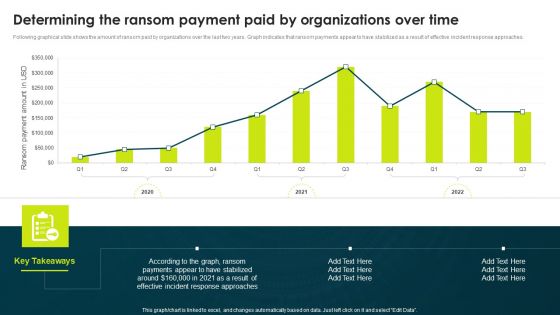
Determining The Ransom Payment Paid By Organizations Over Time Professional PDF
Following graphical slide shows the amount of ransom paid by organizations over the last two years. Graph indicates that ransom payments appear to have stabilized as a result of effective incident response approaches.Deliver an awe inspiring pitch with this creative Determining The Ransom Payment Paid By Organizations Over Time Professional PDF bundle. Topics like According Graph, Payments Appear, Response Approaches can be discussed with this completely editable template. It is available for immediate download depending on the needs and requirements of the user.
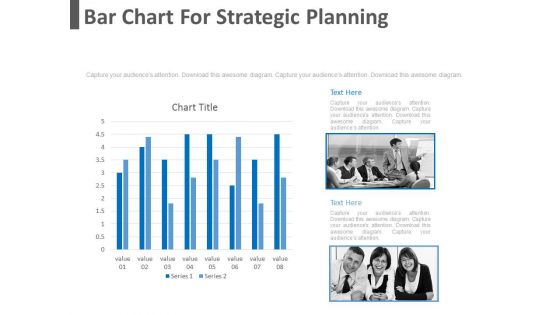
Bar Chart For Strategic Planning Powerpoint Slides
This PowerPoint template has been designed with bar graph with two teams. This diagram is useful to exhibit strategic planning. This diagram slide can be used to make impressive presentations.
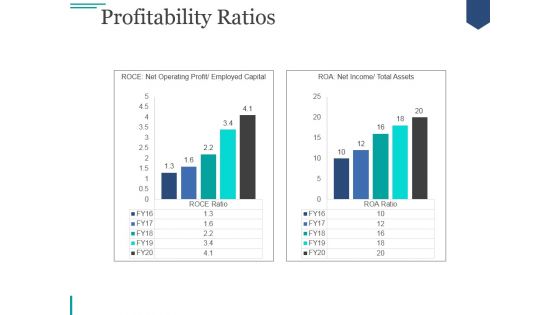
Profitability Ratios Template 2 Ppt PowerPoint Presentation Professional
This is a profitability ratios template 2 ppt powerpoint presentation professional. This is a two stage process. The stages in this process are graph, business, marketing, strategy, growth.
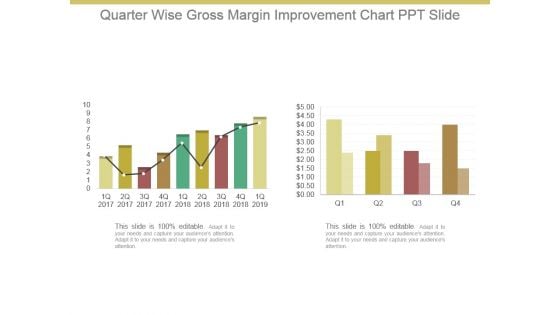
Quarter Wise Gross Margin Improvement Chart Ppt Slide
This is a quarter wise gross margin improvement chart ppt slide. This is a two stage process. The stages in this process are graph, business, growth, marketing.
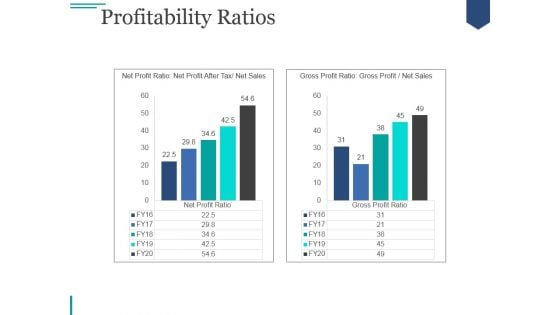
Profitability Ratios Ppt PowerPoint Presentation Infographic Template
This is a profitability ratios ppt powerpoint presentation infographic template. This is a two stage process. The stages in this process are graph, business, marketing, strategy, growth.
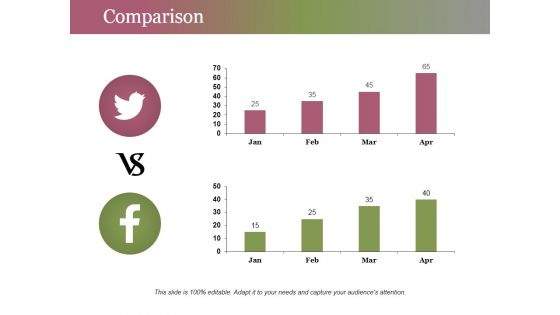
Comparison Ppt PowerPoint Presentation Pictures Gridlines
This is a comparison ppt powerpoint presentation pictures gridlines. This is a two stage process. The stages in this process are graph, compare, social media, business, marketing.
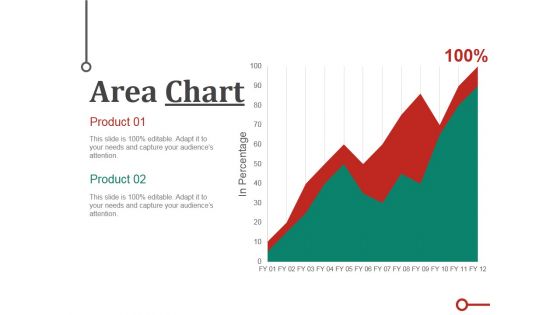
Area Chart Ppt PowerPoint Presentation Ideas Files
This is a area chart ppt powerpoint presentation ideas files. This is a two stage process. The stages in this process are graph, growth, success, business, marketing.
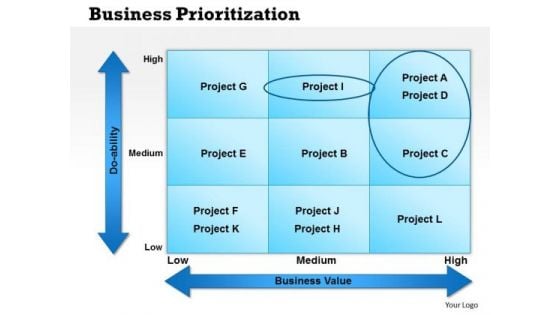
Business Framework Business Prioritization PowerPoint Presentation
This Business framework Pot has been crafted with graphic of square graph and two axial chart. This graphic diagram explains the concept of do ability with high, low and medium states in reference with business value. Use this simple business priotization diagram Pot in your business project related presentation and get noticed.
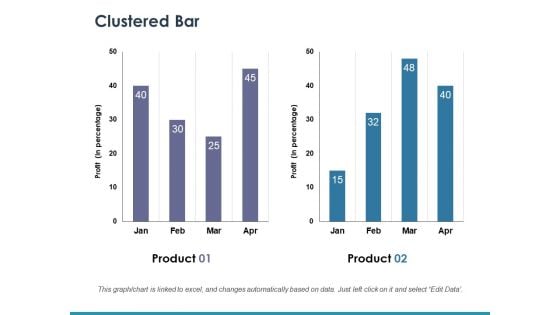
Clustered Bar Ppt PowerPoint Presentation Slides Ideas
This is a clustered bar ppt powerpoint presentation slides ideas. This is a two stage process. The stages in this process are bar graph, growth, success, business, marketing.
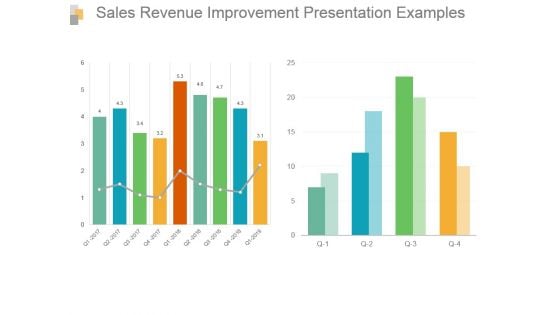
Sales Revenue Improvement Presentation Examples
This is a sales revenue improvement presentation examples. This is a two stage process. The stages in this process are bar graph, growth, sales, data, analysis.
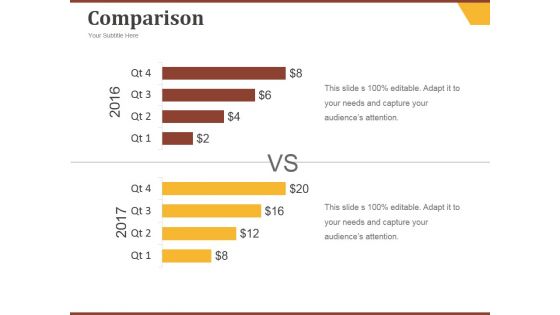
Comparison Ppt PowerPoint Presentation File Example
This is a comparison ppt powerpoint presentation file example. This is a two stage process. The stages in this process are compare, graph, finance, marketing.
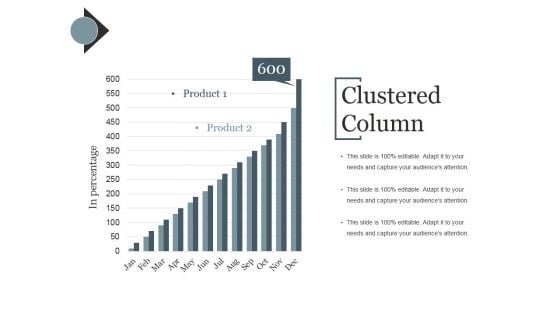
Clustered Column Template Ppt PowerPoint Presentation Portfolio Deck
This is a clustered column template ppt powerpoint presentation portfolio deck. This is a two stage process. The stages in this process are business, graph, bar, finance, analysis.
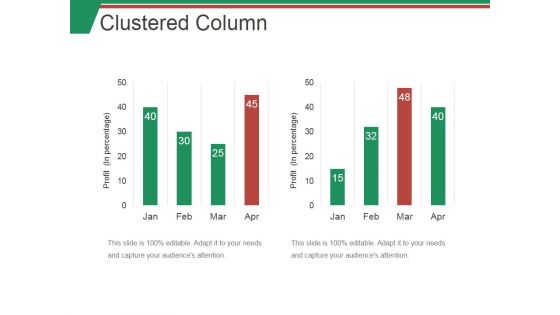
Clustered Column Ppt PowerPoint Presentation Summary Topics
This is a clustered column ppt powerpoint presentation summary topics. This is a two stage process. The stages in this process are bar, graph, finance, marketing, strategy.
Line Chart Ppt PowerPoint Presentation Icon Elements
This is a line chart ppt powerpoint presentation icon elements. This is a two stage process. The stages in this process are line graph, marketing, presentation, business, management.
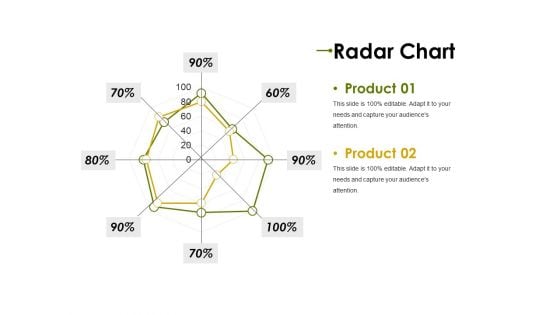
Radar Chart Ppt PowerPoint Presentation Styles Guide
This is a radar chart ppt powerpoint presentation styles guide. This is a two stage process. The stages in this process are product, graph, business, marketing, finance.
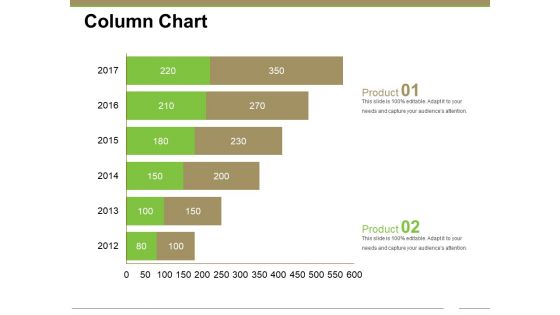
Column Chart Ppt PowerPoint Presentation Gallery Styles
This is a column chart ppt powerpoint presentation gallery styles. This is a two stage process. The stages in this process are years, graph, business, marketing, finance.
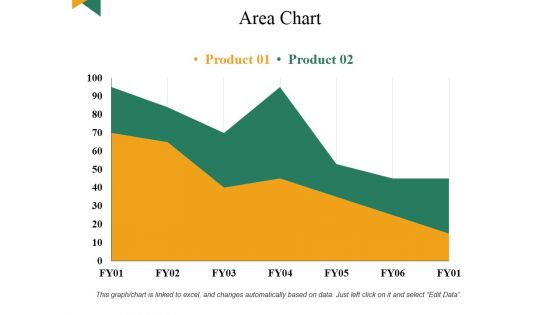
Area Chart Ppt PowerPoint Presentation Gallery Aids
This is a area chart ppt powerpoint presentation gallery aids. This is a two stage process. The stages in this process are business, graph, finance, marketing, planning.
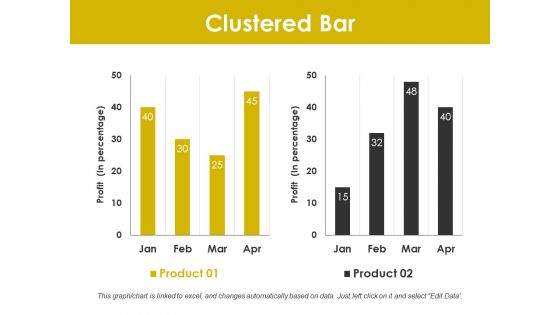
Clustered Bar Ppt PowerPoint Presentation Layouts Layout
This is a clustered bar ppt powerpoint presentation layouts layout. This is a two stage process. The stages in this process are profit, graph, business, marketing, finance.
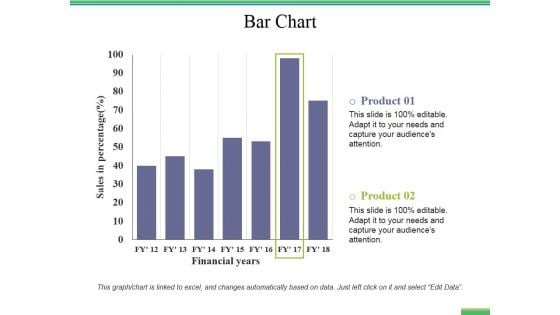
Bar Chart Ppt PowerPoint Presentation File Rules
This is a bar chart ppt powerpoint presentation file rules. This is a two stage process. The stages in this process are bar graph, finance, marketing, strategy, analysis.
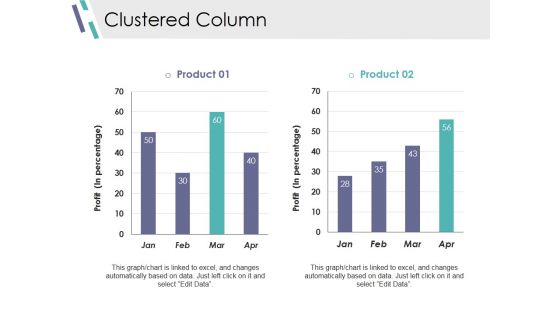
Clustered Column Ppt PowerPoint Presentation Slides Visuals
This is a clustered column ppt powerpoint presentation slides visuals. This is a two stage process. The stages in this process are bar graph, marketing, strategy, finance, planning.
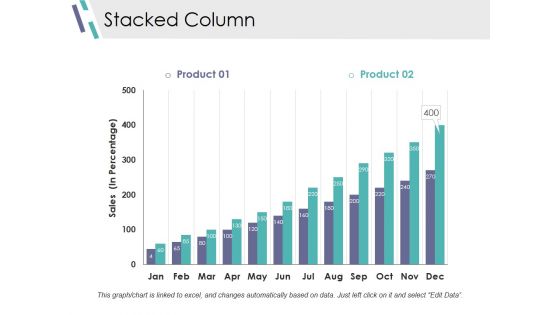
Stacked Column Ppt PowerPoint Presentation Professional Display
This is a stacked column ppt powerpoint presentation professional display. This is a two stage process. The stages in this process are bar graph, marketing, strategy, finance, planning.
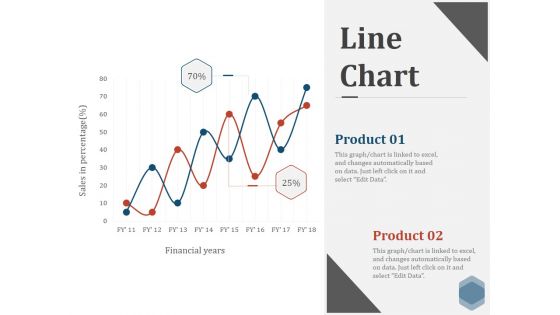
Line Chart Ppt PowerPoint Presentation Show Visuals
This is a line chart ppt powerpoint presentation show visuals. This is a two stage process. The stages in this process are financial, graph, line, marketing, success.
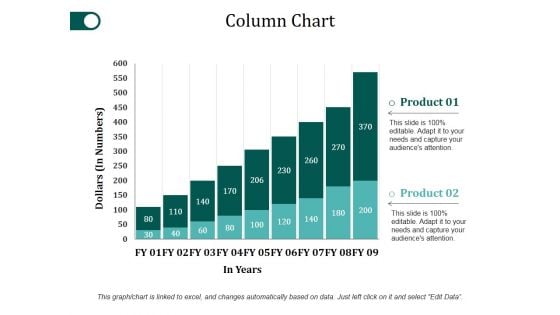
Column Chart Ppt PowerPoint Presentation Portfolio Clipart
This is a column chart ppt powerpoint presentation portfolio clipart. This is a two stage process. The stages in this process are bar graph, growth, success, product, dollars.
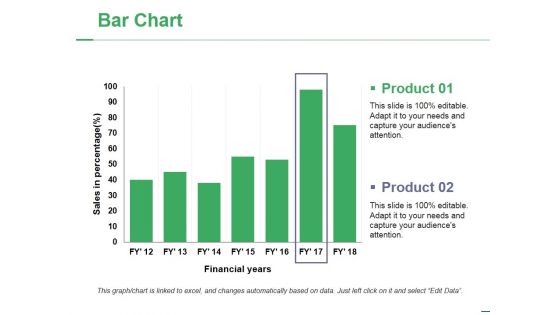
Bar Chart Ppt PowerPoint Presentation Model Topics
This is a bar chart ppt powerpoint presentation model topics. This is a two stage process. The stages in this process are bar graph, growth, success, business, marketing.
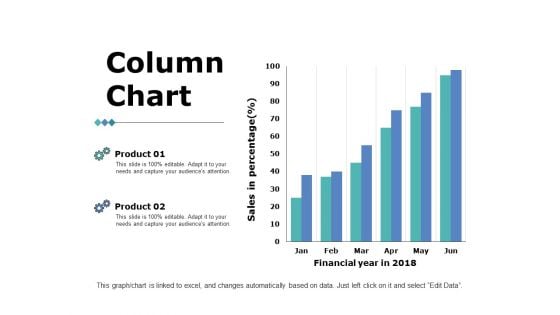
Column Chart Ppt PowerPoint Presentation Summary
This is a column chart ppt powerpoint presentation summary. This is a two stage process. The stages in this process are bar graph, marketing, strategy, finance, planning.
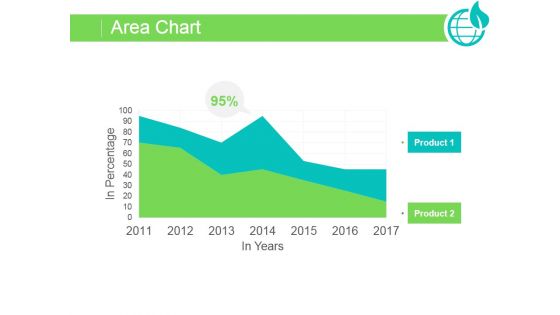
Area Chart Ppt PowerPoint Presentation Backgrounds
This is a area chart ppt powerpoint presentation backgrounds. This is a two stage process. The stages in this process are business, graph, growth, success, marketing.
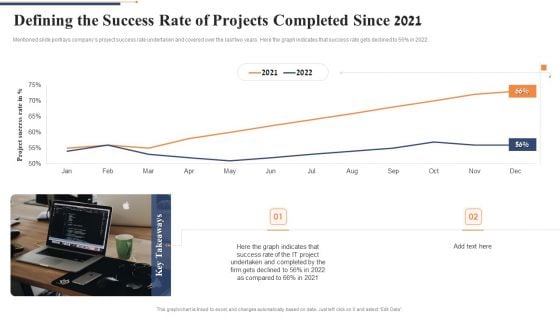
Defining The Success Rate Of Projects Completed Since 2021 Pictures PDF
Mentioned slide portrays companys project success rate undertaken and covered over the last two years. Here the graph indicates that success rate gets declined to 56percentsge in 2022. Deliver an awe inspiring pitch with this creative defining the success rate of projects completed since 2021 pictures pdf bundle. Topics like project success rate can be discussed with this completely editable template. It is available for immediate download depending on the needs and requirements of the user.
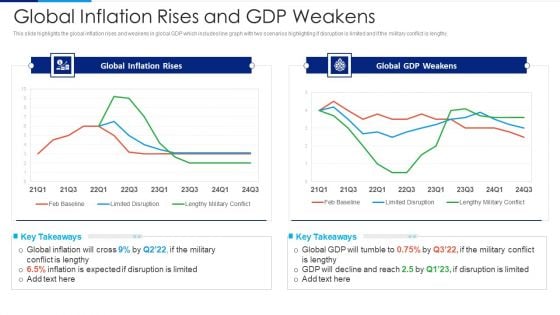
Russia Ukraine Conflict Effect Global Inflation Rises And Gdp Weakens Professional PDF
This slide highlights the global inflation rises and weakens in global GDP which includes line graph with two scenarios highlighting if disruption is limited and if the military conflict is lengthy. Deliver an awe inspiring pitch with this creative Russia Ukraine Conflict Effect Global Inflation Rises And Gdp Weakens Professional PDF bundle. Topics like Global Inflation Rises, Global GDP Weakens can be discussed with this completely editable template. It is available for immediate download depending on the needs and requirements of the user.
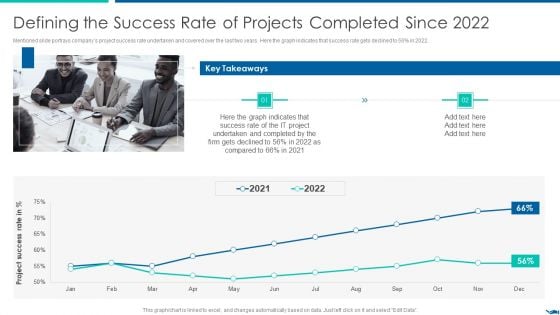
Project QA Through Agile Methodology IT Defining The Success Rate Infographics PDF
Mentioned slide portrays companys project success rate undertaken and covered over the last two years. Here the graph indicates that success rate gets declined to 56percent in 2022.Deliver an awe inspiring pitch with this creative Project QA Through Agile Methodology IT Defining The Success Rate Infographics PDF bundle. Topics like Defining The Success Rate Of Projects Completed Since 2022 can be discussed with this completely editable template. It is available for immediate download depending on the needs and requirements of the user.
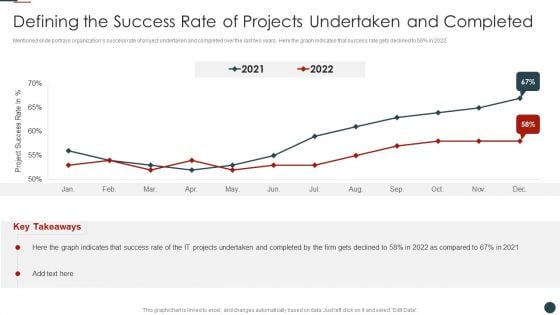
Implementing Agile Software Development Methodology For Cost Cutting IT Defining The Success Rate Introduction PDF
Mentioned slide portrays organizations success rate of project undertaken and completed over the last two years. Here the graph indicates that success rate gets declined to 58percent in 2022.Deliver an awe inspiring pitch with this creative Implementing Agile Software Development Methodology For Cost Cutting IT Defining The Success Rate Introduction PDF bundle. Topics like Defining Success, Rate Projects, Undertaken Completed can be discussed with this completely editable template. It is available for immediate download depending on the needs and requirements of the user.
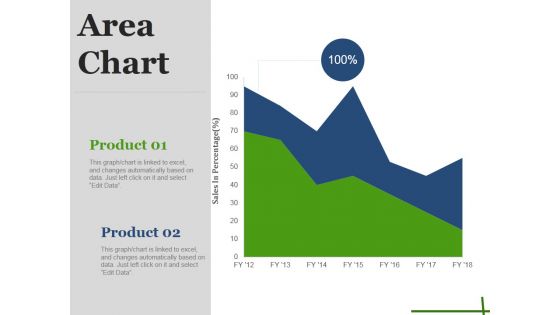
Area Chart Ppt PowerPoint Presentation Styles Graphics
This is a area chart ppt powerpoint presentation styles graphics. This is a two stage process. The stages in this process are business, charts, graphs, marketing, finance.
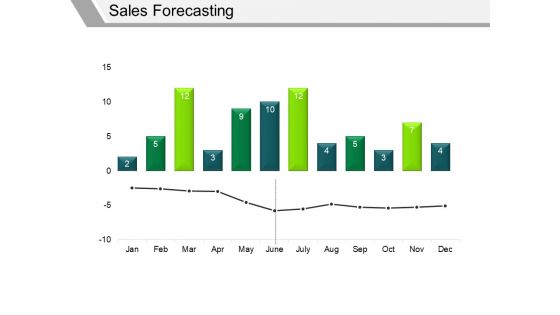
Sales Forecasting Template 2 Ppt PowerPoint Presentation File Graphics
This is a sales forecasting template 2 ppt powerpoint presentation file graphics. This is a two stage process. The stages in this process are finance, marketing, graph, business.
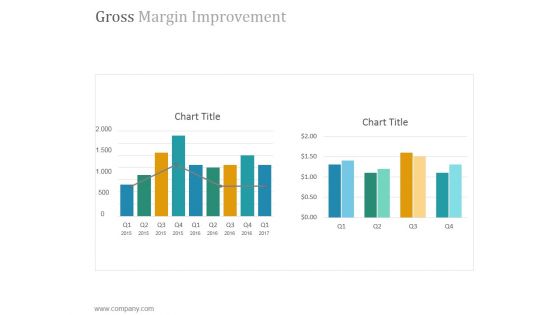
Gross Margin Improvement Ppt PowerPoint Presentation Layout
This is a gross margin improvement ppt powerpoint presentation layout. This is a two stage process. The stages in this process are chart, bar graph, success, growth, marketing.
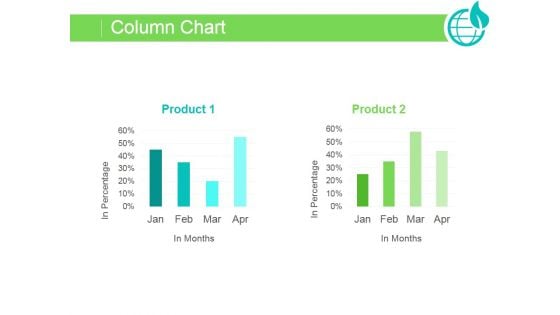
Column Chart Ppt PowerPoint Presentation Slide Download
This is a column chart ppt powerpoint presentation slide download. This is a two stage process. The stages in this process are business, marketing, graph, success, growth.
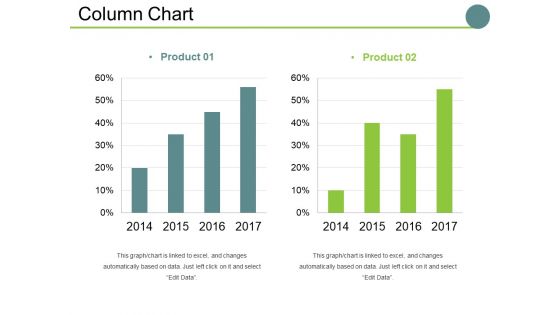
Column Chart Ppt PowerPoint Presentation Outline Themes
This is a column chart ppt powerpoint presentation outline themes. This is a two stage process. The stages in this process are years, business, graph, marketing, finance.
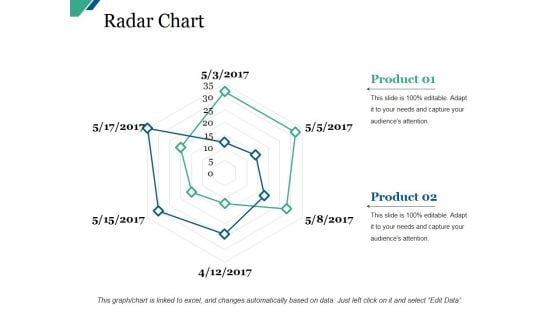
Radar Chart Ppt PowerPoint Presentation Styles Layout Ideas
This is a radar chart ppt powerpoint presentation styles layout ideas. This is a two stage process. The stages in this process are business, marketing, graph, finance, analysis.
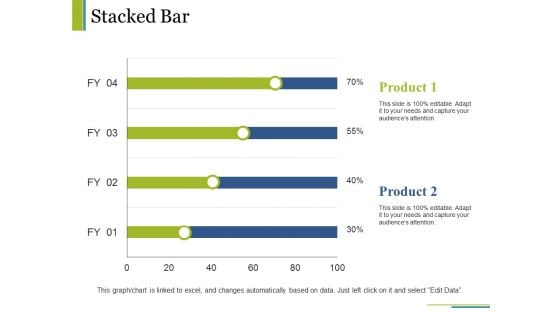
Stacked Bar Ppt PowerPoint Presentation Pictures Slides
This is a stacked bar ppt powerpoint presentation pictures slides. This is a two stage process. The stages in this process are business, marketing, graph, finance, strategy.
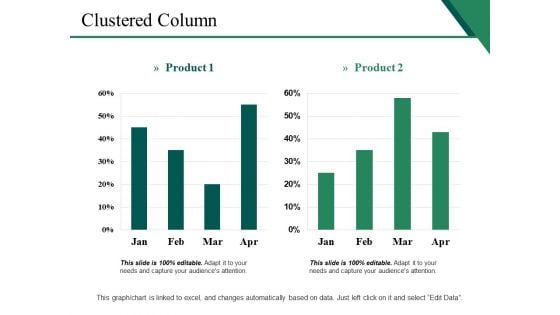
Clustered Column Ppt PowerPoint Presentation Styles Diagrams
This is a clustered column ppt powerpoint presentation styles diagrams. This is a two stage process. The stages in this process are business, marketing, graph, finance, clustered column.
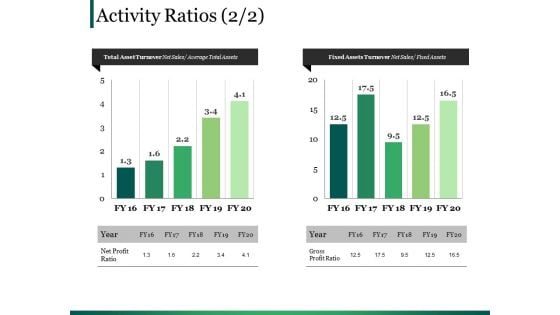
Activity Ratios Ppt PowerPoint Presentation Summary Tips
This is a activity ratios ppt powerpoint presentation summary tips. This is a two stage process. The stages in this process are finance, chart graph, marketing, planning, analysis.
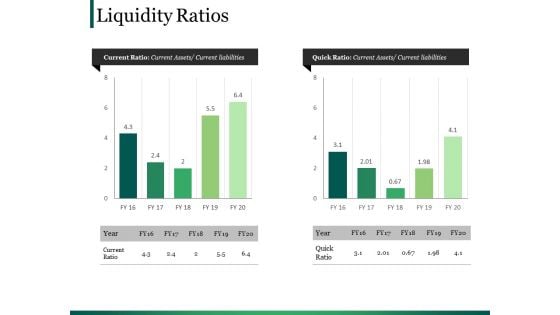
Liquidity Ratios Ppt PowerPoint Presentation Inspiration Skills
This is a liquidity ratios ppt powerpoint presentation inspiration skills. This is a two stage process. The stages in this process are finance, chart graph, marketing, planning, analysis.
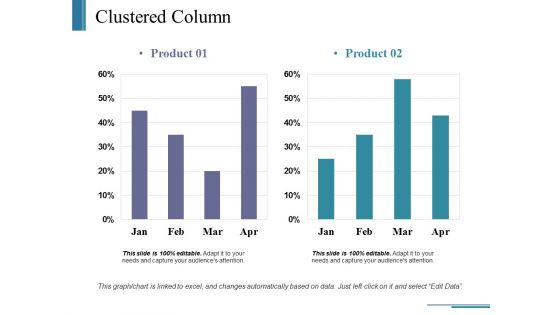
Clustered Column Ppt PowerPoint Presentation Ideas Format Ideas
This is a clustered column ppt powerpoint presentation ideas format ideas. This is a two stage process. The stages in this process are business, marketing, graph, finance, strategy.
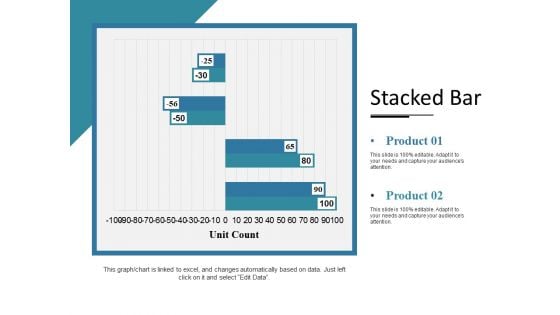
Stacked Bar Ppt PowerPoint Presentation Gallery Summary
This is a stacked bar ppt powerpoint presentation gallery summary. This is a two stage process. The stages in this process are business, marketing, graph, unit count, finance.
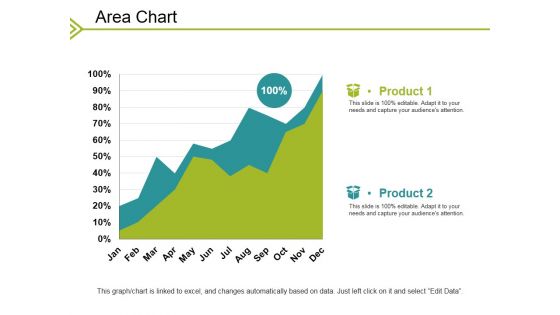
Area Chart Ppt PowerPoint Presentation Outline Examples
This is a area chart ppt powerpoint presentation outline examples. This is a two stage process. The stages in this process are business, marketing, graph, finance, strategy.
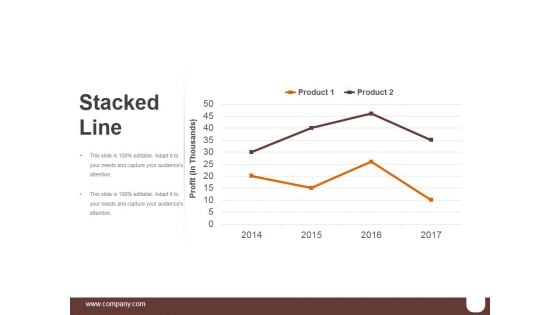
Stacked Line Ppt PowerPoint Presentation Background Images
This is a stacked line ppt powerpoint presentation background images. This is a two stage process. The stages in this process are business, marketing, graph, success, line.
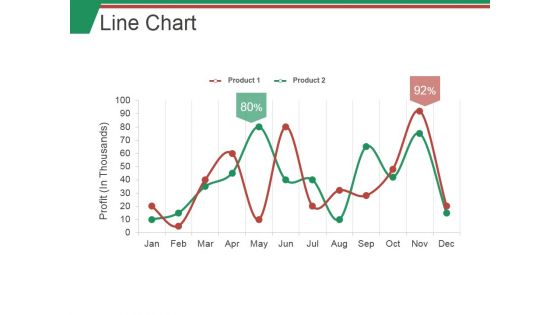
Line Chart Ppt PowerPoint Presentation Inspiration Microsoft
This is a line chart ppt powerpoint presentation inspiration microsoft. This is a two stage process. The stages in this process are business, marketing, graph, line, success.
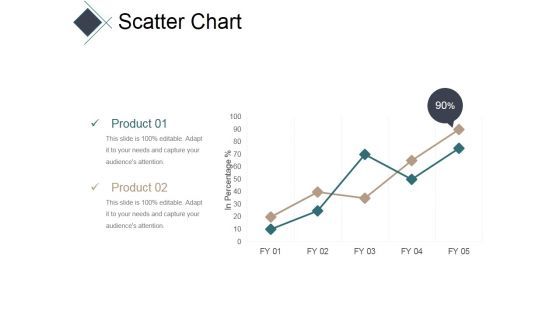
Scatter Chart Ppt PowerPoint Presentation Pictures Slide Portrait
This is a scatter chart ppt powerpoint presentation pictures slide portrait. This is a two stage process. The stages in this process are business, line, graph, success, finance.
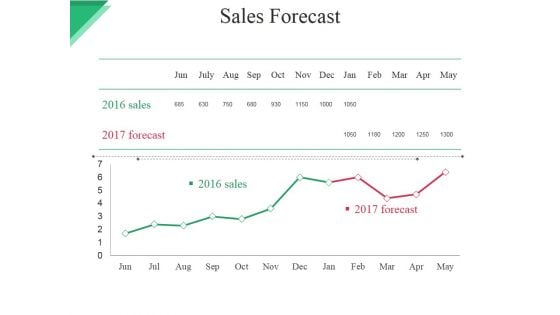
Sales Forecast Ppt PowerPoint Presentation Styles Format
This is a sales forecast ppt powerpoint presentation styles format. This is a two stage process. The stages in this process are sales, forecast, graph, success, marketing.

Column Chart Ppt PowerPoint Presentation Model Visuals
This is a column chart ppt powerpoint presentation model visuals. This is a two stage process. The stages in this process are product, year, graph, business, finance.
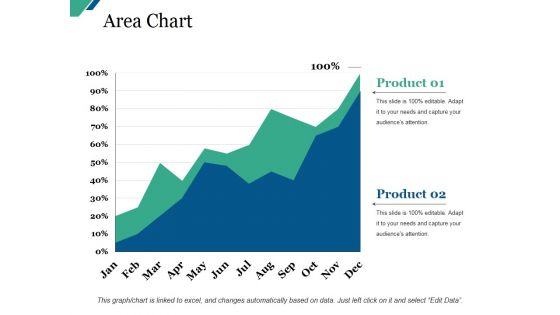
Area Chart Ppt PowerPoint Presentation Pictures Example
This is a area chart ppt powerpoint presentation pictures example. This is a two stage process. The stages in this process are business, marketing, graph, success, growth.


 Continue with Email

 Home
Home


